
|
|||||
|
 | |
| |
| |
| |
| |
| |
|
Gene: KRT14 |
Gene summary for KRT14 |
| Gene information | Species | Human | Gene symbol | KRT14 | Gene ID | 3861 |
| Gene name | keratin 14 | |
| Gene Alias | CK14 | |
| Cytomap | 17q21.2 | |
| Gene Type | protein-coding | GO ID | GO:0006996 | UniProtAcc | P02533 |
Top |
Malignant transformation analysis |
| Identification of the aberrant gene expression in precancerous and cancerous lesions by comparing the gene expression of stem-like cells in diseased tissues with normal stem cells |
| Entrez ID | Symbol | Replicates | Species | Organ | Tissue | Adj P-value | Log2FC | Malignancy |
| 3861 | KRT14 | GSM4909277 | Human | Breast | Precancer | 2.17e-04 | 8.88e-01 | 0.0177 |
| 3861 | KRT14 | GSM4909281 | Human | Breast | IDC | 2.03e-28 | 8.71e-01 | 0.21 |
| 3861 | KRT14 | GSM4909282 | Human | Breast | IDC | 4.66e-116 | 1.65e+00 | -0.0288 |
| 3861 | KRT14 | GSM4909285 | Human | Breast | IDC | 1.23e-111 | 1.57e+00 | 0.21 |
| 3861 | KRT14 | GSM4909287 | Human | Breast | IDC | 2.79e-05 | -2.70e-01 | 0.2057 |
| 3861 | KRT14 | GSM4909288 | Human | Breast | IDC | 2.88e-05 | 5.14e-01 | 0.0988 |
| 3861 | KRT14 | GSM4909290 | Human | Breast | IDC | 1.25e-13 | -4.18e-01 | 0.2096 |
| 3861 | KRT14 | GSM4909291 | Human | Breast | IDC | 5.65e-11 | -4.18e-01 | 0.1753 |
| 3861 | KRT14 | GSM4909293 | Human | Breast | IDC | 1.35e-10 | -2.73e-01 | 0.1581 |
| 3861 | KRT14 | GSM4909294 | Human | Breast | IDC | 7.37e-14 | -3.18e-01 | 0.2022 |
| 3861 | KRT14 | GSM4909296 | Human | Breast | IDC | 2.96e-14 | -3.25e-01 | 0.1524 |
| 3861 | KRT14 | GSM4909297 | Human | Breast | IDC | 6.43e-16 | -3.99e-01 | 0.1517 |
| 3861 | KRT14 | GSM4909298 | Human | Breast | IDC | 8.35e-07 | -2.72e-01 | 0.1551 |
| 3861 | KRT14 | GSM4909299 | Human | Breast | IDC | 1.60e-31 | 9.33e-01 | 0.035 |
| 3861 | KRT14 | GSM4909300 | Human | Breast | IDC | 1.83e-16 | 9.30e-01 | 0.0334 |
| 3861 | KRT14 | GSM4909301 | Human | Breast | IDC | 7.78e-22 | -4.18e-01 | 0.1577 |
| 3861 | KRT14 | GSM4909302 | Human | Breast | IDC | 2.12e-10 | -3.11e-01 | 0.1545 |
| 3861 | KRT14 | GSM4909303 | Human | Breast | IDC | 1.35e-02 | -4.00e-01 | 0.0438 |
| 3861 | KRT14 | GSM4909304 | Human | Breast | IDC | 7.78e-22 | -4.15e-01 | 0.1636 |
| 3861 | KRT14 | GSM4909305 | Human | Breast | IDC | 1.12e-12 | 7.39e-01 | 0.0436 |
| Page: 1 2 3 4 5 6 7 8 9 10 |
| Tissue | Expression Dynamics | Abbreviation |
| Breast |  | IDC: Invasive ductal carcinoma |
| DCIS: Ductal carcinoma in situ | ||
| Precancer(BRCA1-mut): Precancerous lesion from BRCA1 mutation carriers | ||
| Cervix | 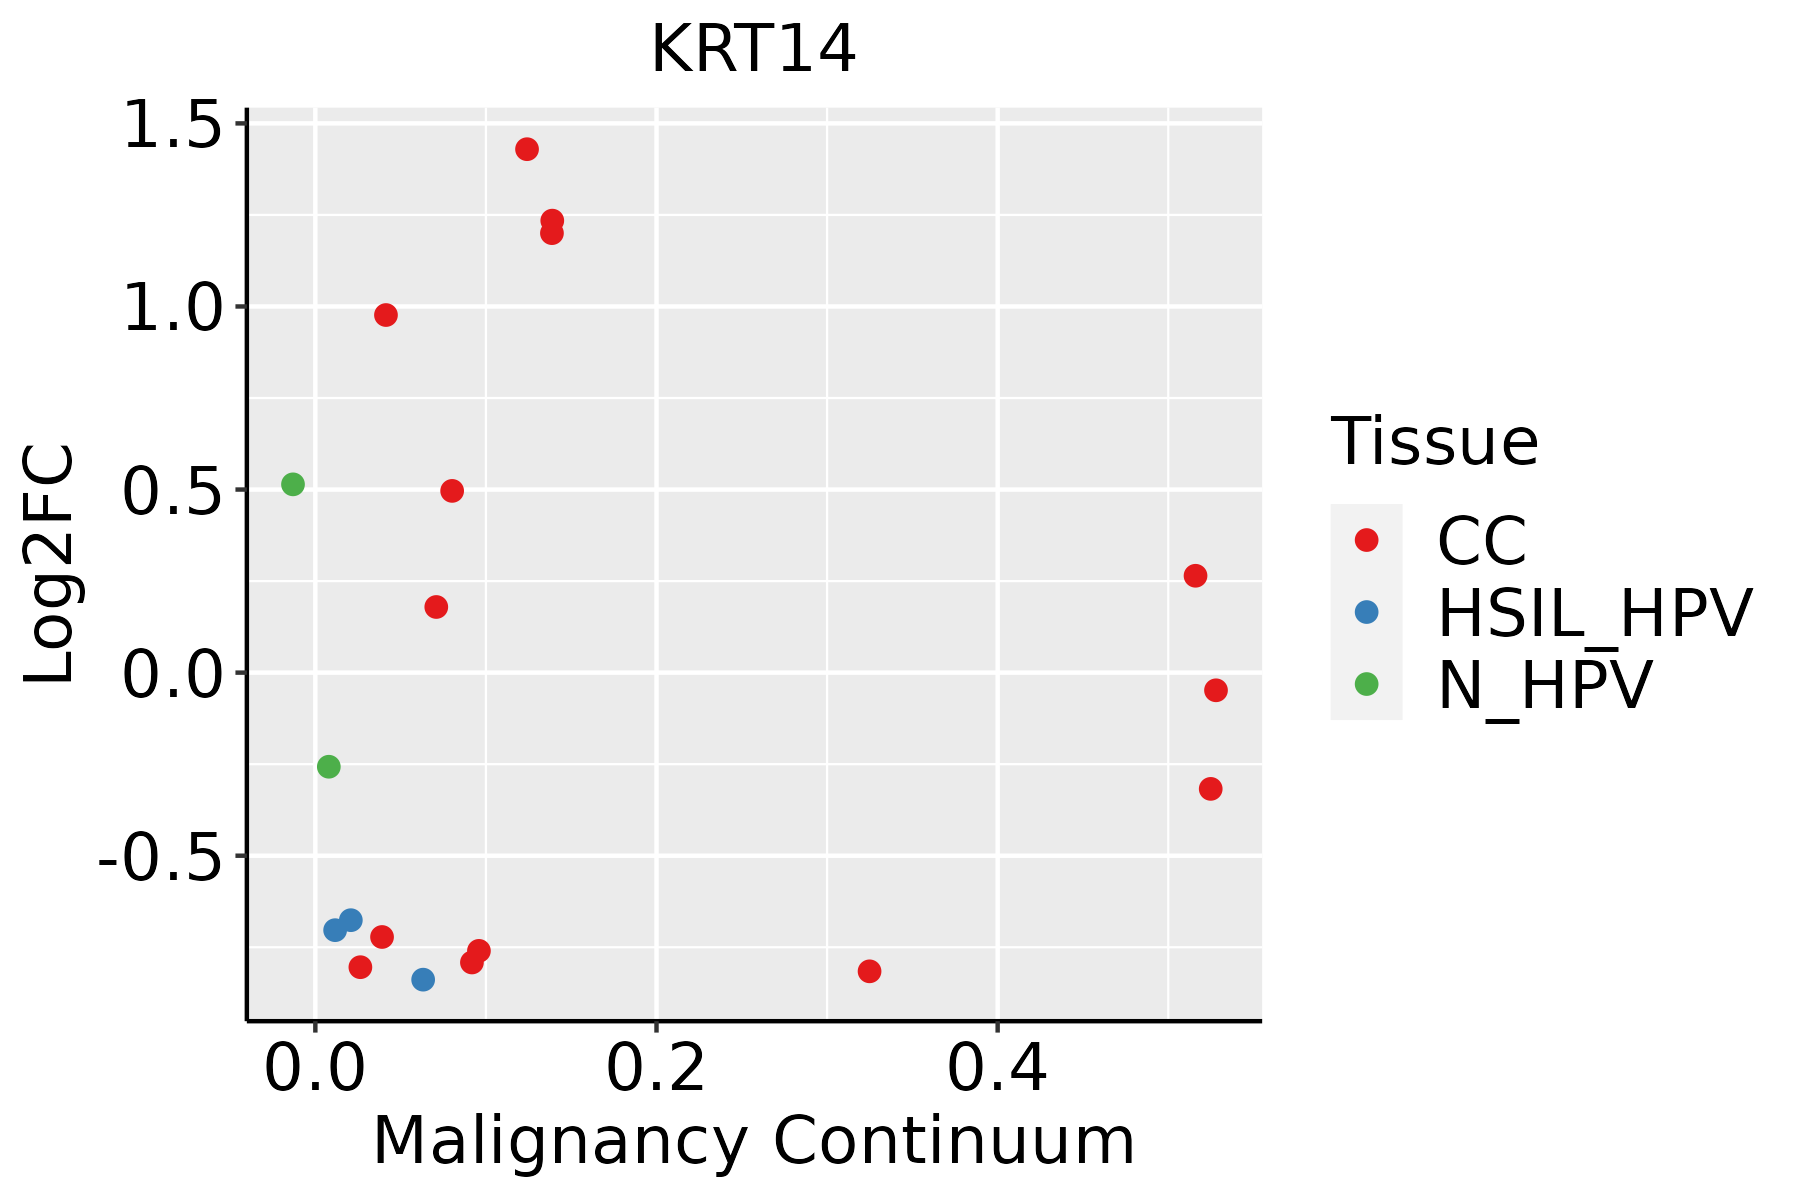 | CC: Cervix cancer |
| HSIL_HPV: HPV-infected high-grade squamous intraepithelial lesions | ||
| N_HPV: HPV-infected normal cervix | ||
| Esophagus | 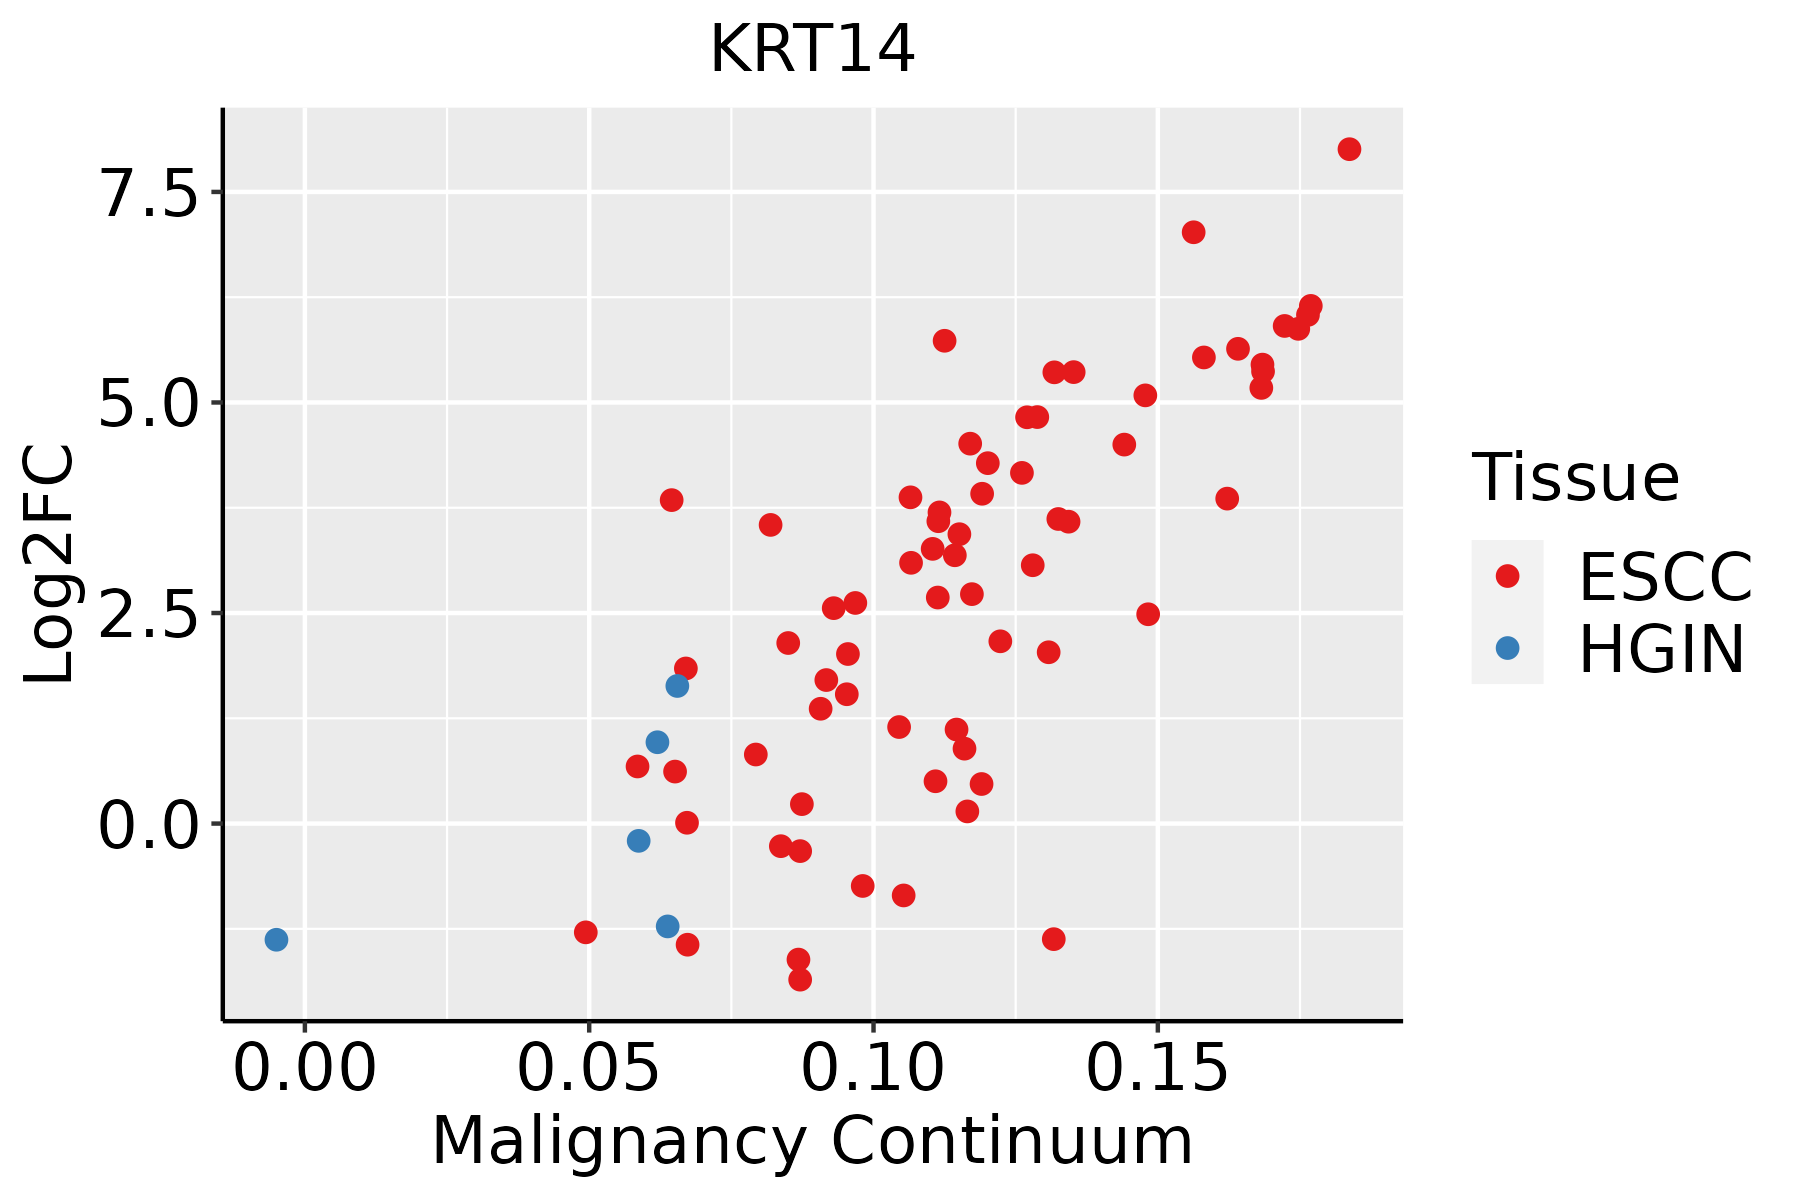 | ESCC: Esophageal squamous cell carcinoma |
| HGIN: High-grade intraepithelial neoplasias | ||
| LGIN: Low-grade intraepithelial neoplasias | ||
| Oral Cavity | 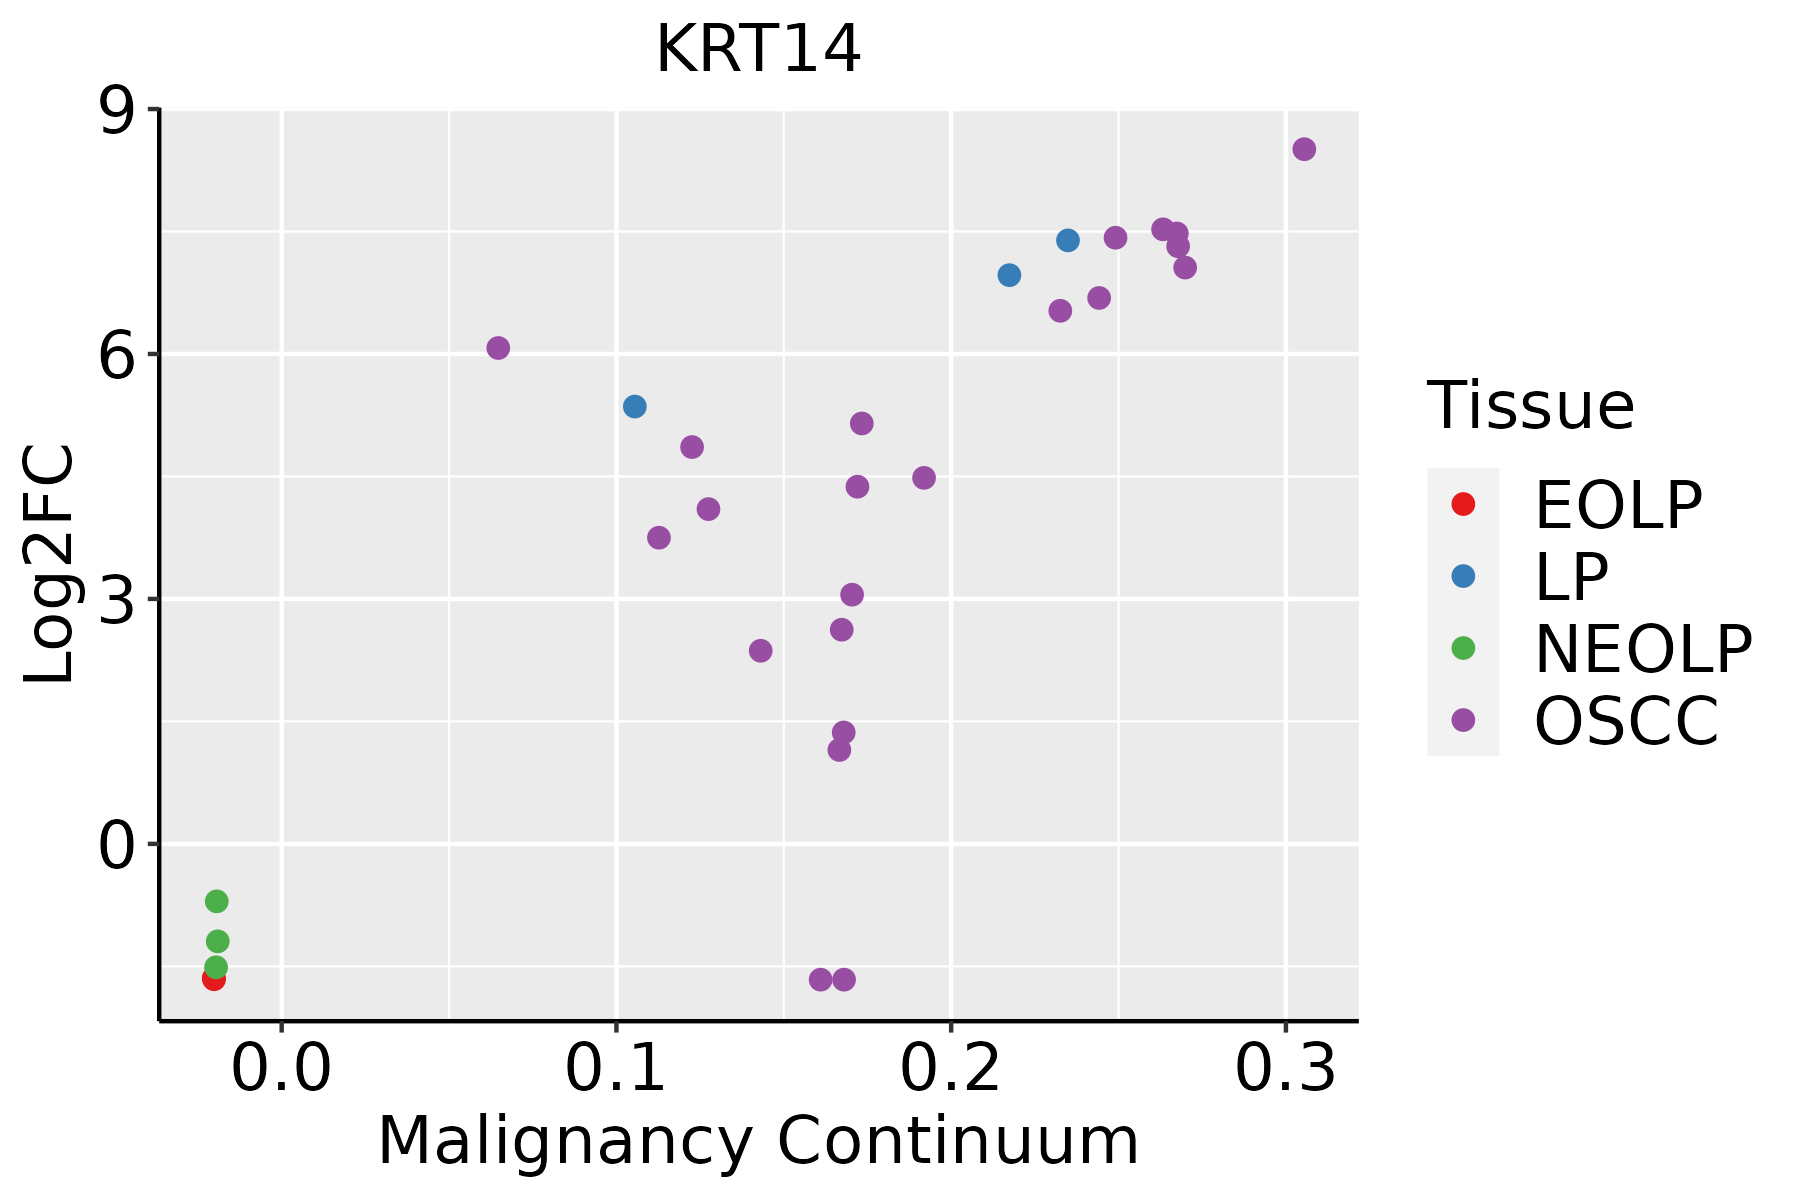 | EOLP: Erosive Oral lichen planus |
| LP: leukoplakia | ||
| NEOLP: Non-erosive oral lichen planus | ||
| OSCC: Oral squamous cell carcinoma | ||
| Prostate | 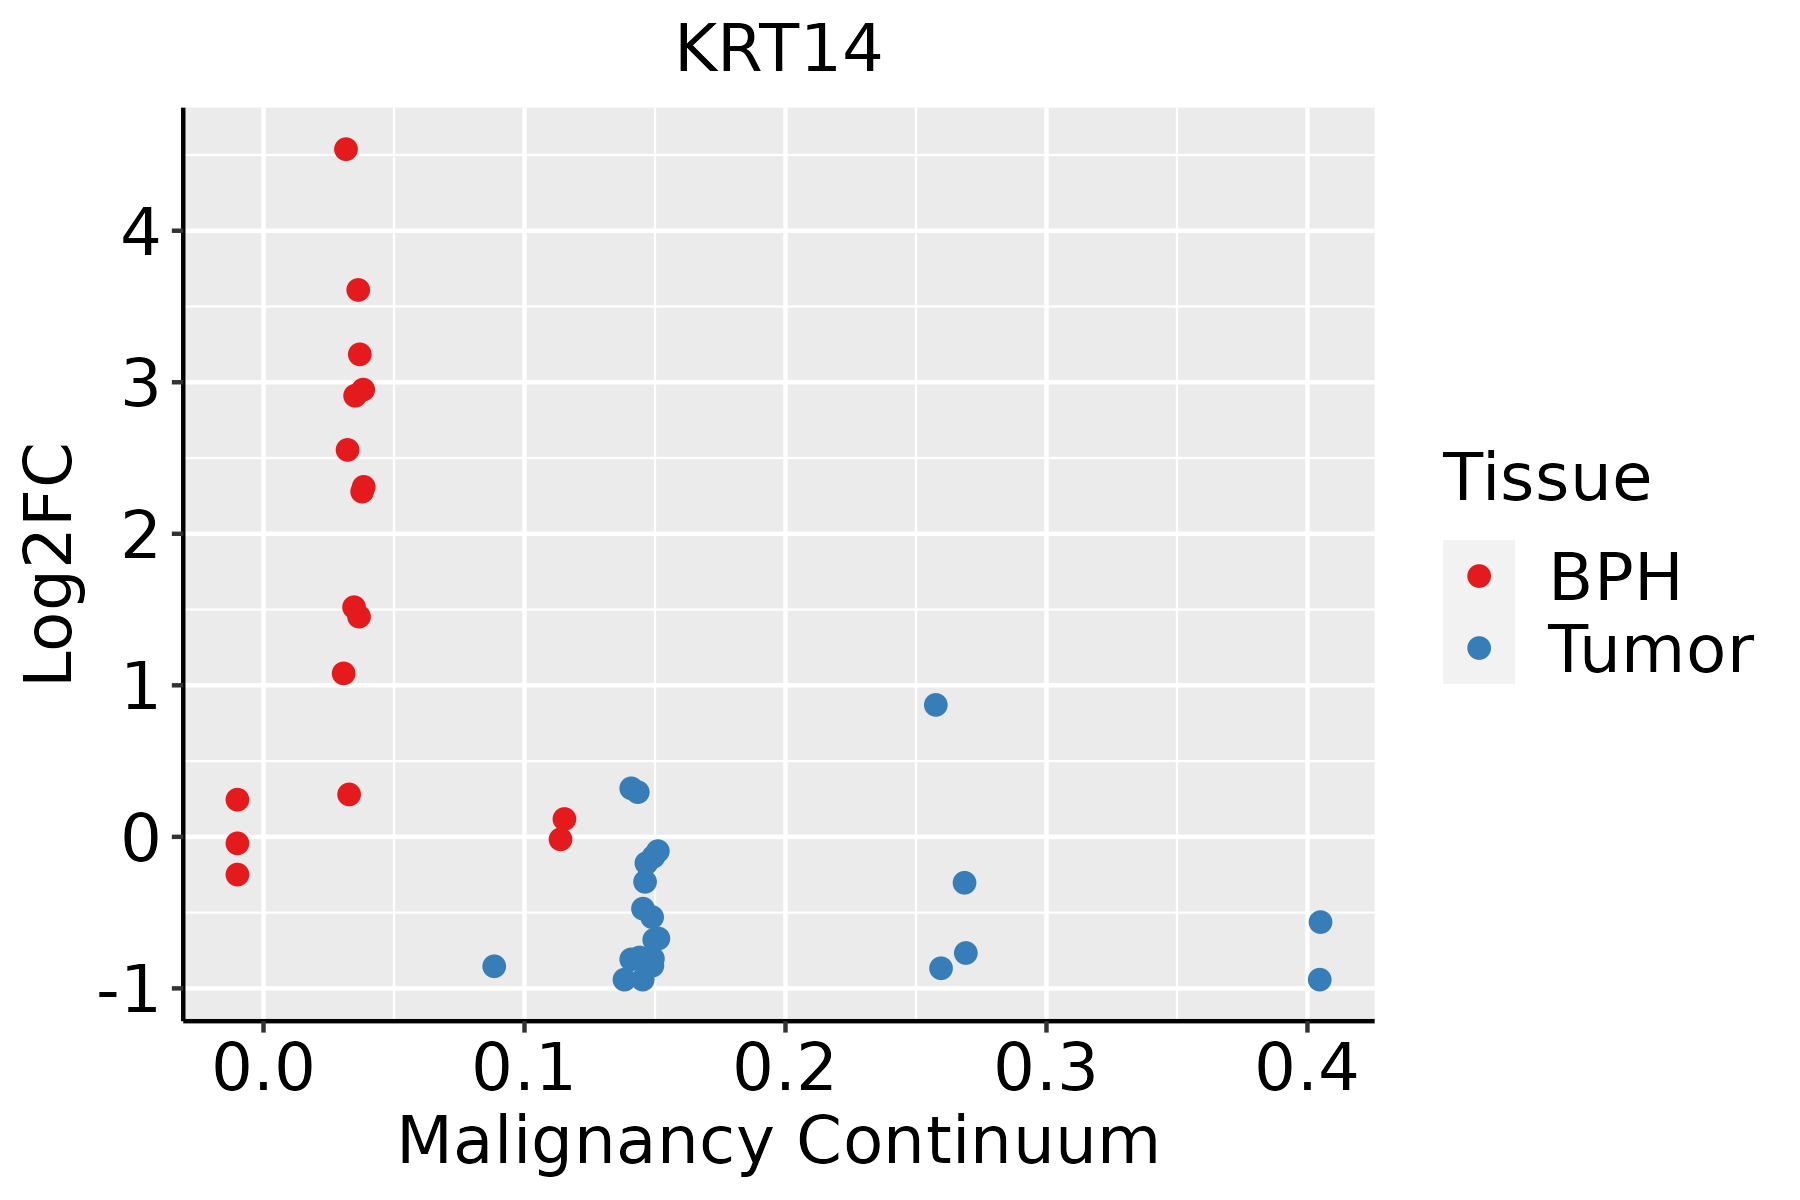 | BPH: Benign Prostatic Hyperplasia |
| Skin | 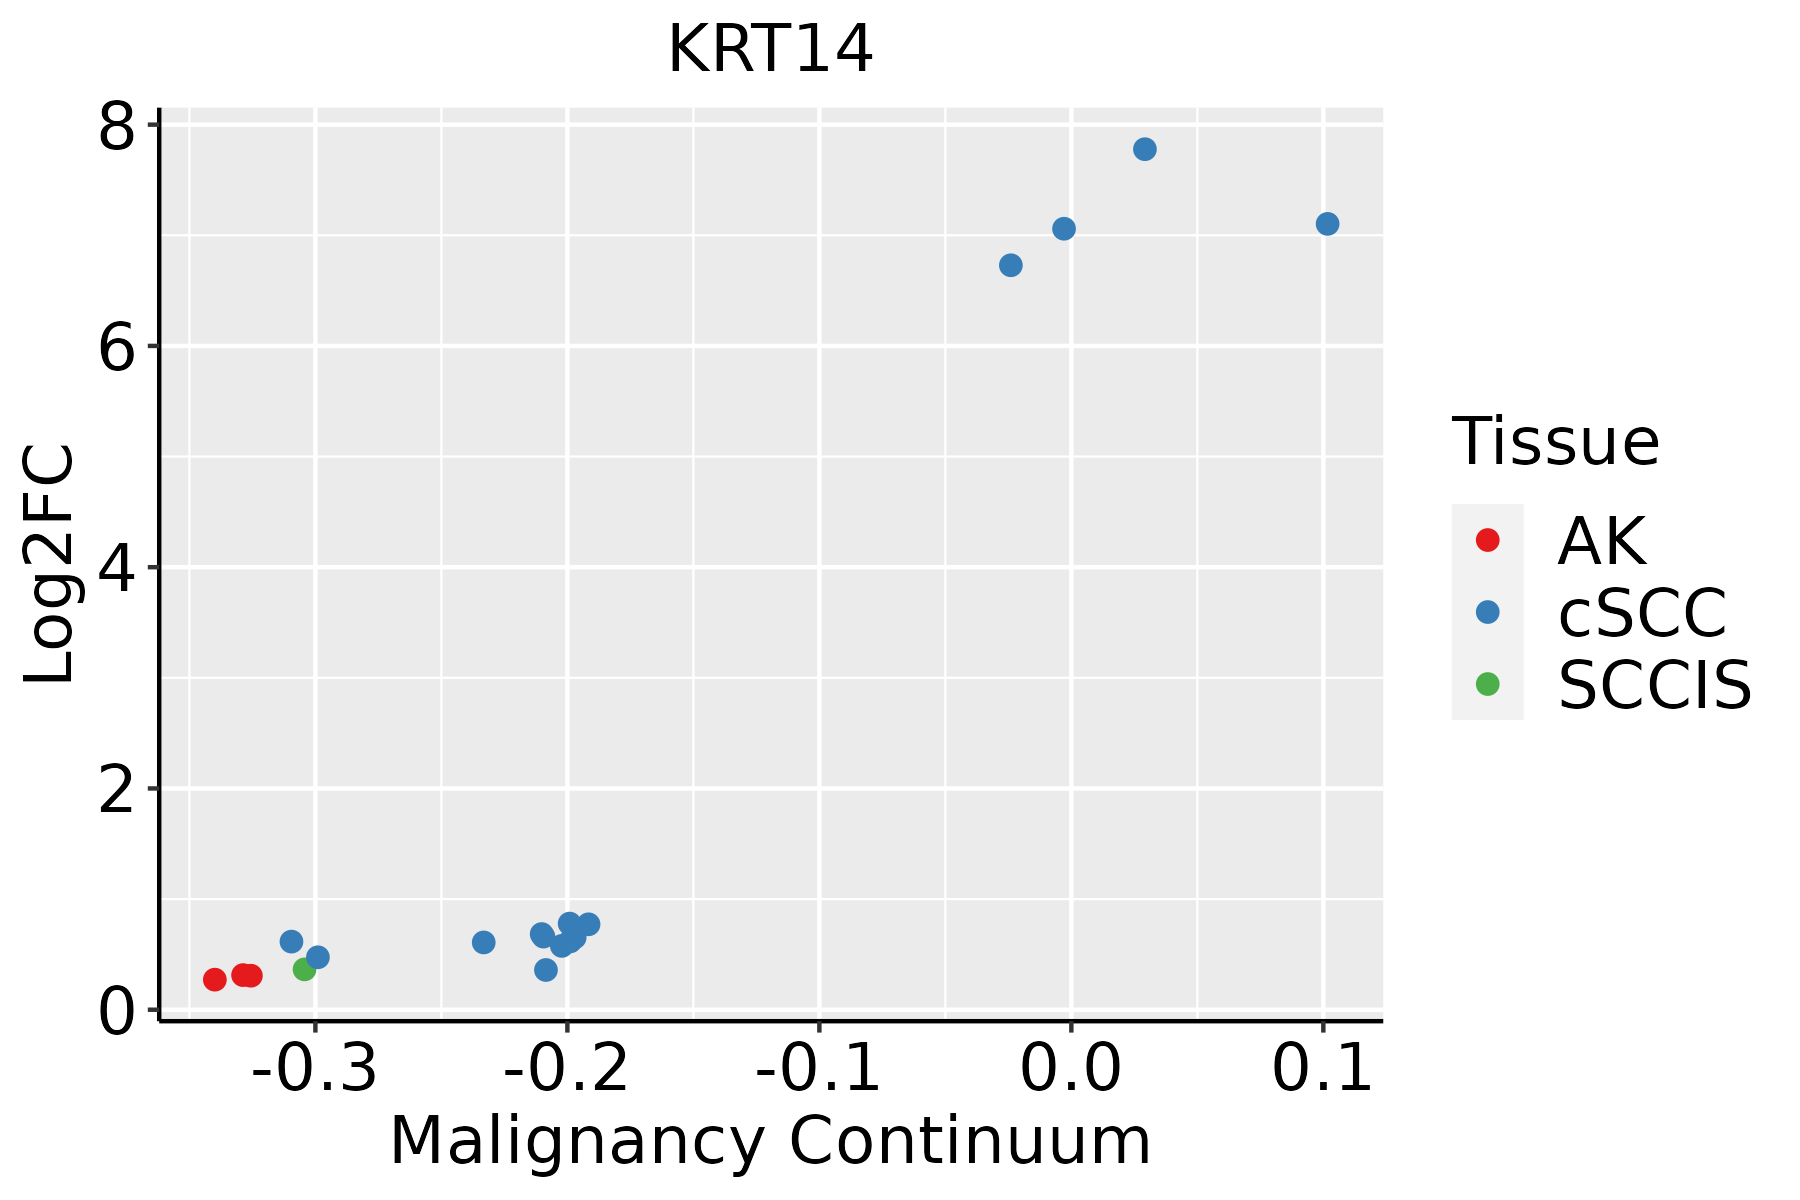 | AK: Actinic keratosis |
| cSCC: Cutaneous squamous cell carcinoma | ||
| SCCIS:squamous cell carcinoma in situ |
| ∗log2FC in expression of this searched gene in stem-like cells from each diseased tissue sample relative to stem-like cells in normal samples in each tissue plotted against the malignancy continuum. Samples are colored based on if they are from different disease stage. |
Top |
Malignant transformation related pathway analysis |
| Find out the enriched GO biological processes and KEGG pathways involved in transition from healthy to precancer to cancer |
| Tissue | Disease Stage | Enriched GO biological Processes |
| Colorectum | AD |  |
| Colorectum | SER |  |
| Colorectum | MSS |  |
| Colorectum | MSI-H |  |
| Colorectum | FAP |  |
| ∗Top 15 enriched GO BP terms are showed in the bar plot of each disease state in each tissue. Each row represents a significant GO biological process which is colored according to the -log10(p.adjust). |
| Page: 1 2 3 4 5 6 7 8 9 |
| GO ID | Tissue | Disease Stage | Description | Gene Ratio | Bg Ratio | pvalue | p.adjust | Count |
| GO:00100389 | Breast | Precancer | response to metal ion | 47/1080 | 373/18723 | 3.88e-07 | 1.79e-05 | 47 |
| GO:00075688 | Breast | Precancer | aging | 41/1080 | 339/18723 | 5.95e-06 | 1.71e-04 | 41 |
| GO:00093148 | Breast | Precancer | response to radiation | 47/1080 | 456/18723 | 8.39e-05 | 1.62e-03 | 47 |
| GO:00102125 | Breast | Precancer | response to ionizing radiation | 21/1080 | 148/18723 | 1.19e-04 | 2.13e-03 | 21 |
| GO:0045104 | Breast | Precancer | intermediate filament cytoskeleton organization | 11/1080 | 51/18723 | 1.26e-04 | 2.22e-03 | 11 |
| GO:0045103 | Breast | Precancer | intermediate filament-based process | 11/1080 | 52/18723 | 1.52e-04 | 2.60e-03 | 11 |
| GO:00085445 | Breast | Precancer | epidermis development | 35/1080 | 324/18723 | 2.71e-04 | 3.96e-03 | 35 |
| GO:00100435 | Breast | Precancer | response to zinc ion | 9/1080 | 58/18723 | 5.67e-03 | 4.08e-02 | 9 |
| GO:001003814 | Breast | IDC | response to metal ion | 65/1434 | 373/18723 | 2.95e-10 | 3.42e-08 | 65 |
| GO:000756813 | Breast | IDC | aging | 52/1434 | 339/18723 | 1.14e-06 | 5.10e-05 | 52 |
| GO:001021213 | Breast | IDC | response to ionizing radiation | 28/1434 | 148/18723 | 6.85e-06 | 2.09e-04 | 28 |
| GO:000931412 | Breast | IDC | response to radiation | 62/1434 | 456/18723 | 6.91e-06 | 2.10e-04 | 62 |
| GO:001004311 | Breast | IDC | response to zinc ion | 13/1434 | 58/18723 | 3.59e-04 | 5.18e-03 | 13 |
| GO:000854412 | Breast | IDC | epidermis development | 41/1434 | 324/18723 | 1.03e-03 | 1.14e-02 | 41 |
| GO:00451041 | Breast | IDC | intermediate filament cytoskeleton organization | 11/1434 | 51/18723 | 1.40e-03 | 1.44e-02 | 11 |
| GO:00451031 | Breast | IDC | intermediate filament-based process | 11/1434 | 52/18723 | 1.66e-03 | 1.63e-02 | 11 |
| GO:001003824 | Breast | DCIS | response to metal ion | 65/1390 | 373/18723 | 8.03e-11 | 9.88e-09 | 65 |
| GO:000756823 | Breast | DCIS | aging | 50/1390 | 339/18723 | 2.38e-06 | 8.46e-05 | 50 |
| GO:000931422 | Breast | DCIS | response to radiation | 62/1390 | 456/18723 | 2.56e-06 | 8.87e-05 | 62 |
| GO:001021223 | Breast | DCIS | response to ionizing radiation | 28/1390 | 148/18723 | 3.79e-06 | 1.16e-04 | 28 |
| Page: 1 2 3 4 5 6 7 |
| Pathway ID | Tissue | Disease Stage | Description | Gene Ratio | Bg Ratio | pvalue | p.adjust | qvalue | Count |
| hsa0491518 | Breast | Precancer | Estrogen signaling pathway | 28/684 | 138/8465 | 4.10e-06 | 5.39e-05 | 4.13e-05 | 28 |
| hsa0491519 | Breast | Precancer | Estrogen signaling pathway | 28/684 | 138/8465 | 4.10e-06 | 5.39e-05 | 4.13e-05 | 28 |
| hsa0491523 | Breast | IDC | Estrogen signaling pathway | 35/867 | 138/8465 | 2.55e-07 | 5.18e-06 | 3.88e-06 | 35 |
| hsa0491533 | Breast | IDC | Estrogen signaling pathway | 35/867 | 138/8465 | 2.55e-07 | 5.18e-06 | 3.88e-06 | 35 |
| hsa0491542 | Breast | DCIS | Estrogen signaling pathway | 35/846 | 138/8465 | 1.40e-07 | 2.51e-06 | 1.85e-06 | 35 |
| hsa05150 | Breast | DCIS | Staphylococcus aureus infection | 19/846 | 96/8465 | 2.68e-03 | 1.67e-02 | 1.23e-02 | 19 |
| hsa0491552 | Breast | DCIS | Estrogen signaling pathway | 35/846 | 138/8465 | 1.40e-07 | 2.51e-06 | 1.85e-06 | 35 |
| hsa051501 | Breast | DCIS | Staphylococcus aureus infection | 19/846 | 96/8465 | 2.68e-03 | 1.67e-02 | 1.23e-02 | 19 |
| hsa0491520 | Cervix | CC | Estrogen signaling pathway | 44/1267 | 138/8465 | 3.55e-07 | 3.97e-06 | 2.35e-06 | 44 |
| hsa04915110 | Cervix | CC | Estrogen signaling pathway | 44/1267 | 138/8465 | 3.55e-07 | 3.97e-06 | 2.35e-06 | 44 |
| hsa051504 | Cervix | HSIL_HPV | Staphylococcus aureus infection | 21/459 | 96/8465 | 2.93e-08 | 1.43e-06 | 1.16e-06 | 21 |
| hsa0491524 | Cervix | HSIL_HPV | Estrogen signaling pathway | 19/459 | 138/8465 | 1.54e-04 | 1.74e-03 | 1.40e-03 | 19 |
| hsa0515011 | Cervix | HSIL_HPV | Staphylococcus aureus infection | 21/459 | 96/8465 | 2.93e-08 | 1.43e-06 | 1.16e-06 | 21 |
| hsa0491534 | Cervix | HSIL_HPV | Estrogen signaling pathway | 19/459 | 138/8465 | 1.54e-04 | 1.74e-03 | 1.40e-03 | 19 |
| hsa051502 | Cervix | N_HPV | Staphylococcus aureus infection | 15/349 | 96/8465 | 7.81e-06 | 1.01e-04 | 7.90e-05 | 15 |
| hsa0491543 | Cervix | N_HPV | Estrogen signaling pathway | 16/349 | 138/8465 | 1.68e-04 | 1.53e-03 | 1.19e-03 | 16 |
| hsa051503 | Cervix | N_HPV | Staphylococcus aureus infection | 15/349 | 96/8465 | 7.81e-06 | 1.01e-04 | 7.90e-05 | 15 |
| hsa0491553 | Cervix | N_HPV | Estrogen signaling pathway | 16/349 | 138/8465 | 1.68e-04 | 1.53e-03 | 1.19e-03 | 16 |
| hsa0491529 | Oral cavity | EOLP | Estrogen signaling pathway | 38/1218 | 138/8465 | 3.78e-05 | 1.82e-04 | 1.07e-04 | 38 |
| hsa04915113 | Oral cavity | EOLP | Estrogen signaling pathway | 38/1218 | 138/8465 | 3.78e-05 | 1.82e-04 | 1.07e-04 | 38 |
| Page: 1 2 |
Top |
Cell-cell communication analysis |
| Identification of potential cell-cell interactions between two cell types and their ligand-receptor pairs for different disease states |
| Ligand | Receptor | LRpair | Pathway | Tissue | Disease Stage |
| Page: 1 |
Top |
Single-cell gene regulatory network inference analysis |
| Find out the significant the regulons (TFs) and the target genes of each regulon across cell types for different disease states |
| TF | Cell Type | Tissue | Disease Stage | Target Gene | RSS | Regulon Activity |
| ∗The dot plots of a searched regulon are shown for all cell subpopulations in each disease state of each tissue based on the regulon specific score inferred using pySCENIC and by calculating the average expression. |
| Page: 1 |
Top |
Somatic mutation of malignant transformation related genes |
| Annotation of somatic variants for genes involved in malignant transformation |
| Hugo Symbol | Variant Class | Variant Classification | dbSNP RS | HGVSc | HGVSp | HGVSp Short | SWISSPROT | BIOTYPE | SIFT | PolyPhen | Tumor Sample Barcode | Tissue | Histology | Sex | Age | Stage | Therapy Types | Drugs | Outcome |
| KRT14 | SNV | Missense_Mutation | c.1369N>A | p.Asp457Asn | p.D457N | P02533 | protein_coding | tolerated(0.14) | benign(0.211) | TCGA-AN-A046-01 | Breast | breast invasive carcinoma | Female | >=65 | I/II | Unknown | Unknown | SD | |
| KRT14 | SNV | Missense_Mutation | c.611A>G | p.Tyr204Cys | p.Y204C | P02533 | protein_coding | deleterious(0) | benign(0.316) | TCGA-AR-A0TU-01 | Breast | breast invasive carcinoma | Female | <65 | I/II | Unspecific | Doxorubicin | SD | |
| KRT14 | SNV | Missense_Mutation | rs769859839 | c.1330T>C | p.Ser444Pro | p.S444P | P02533 | protein_coding | tolerated(0.15) | possibly_damaging(0.616) | TCGA-AR-A1AK-01 | Breast | breast invasive carcinoma | Female | >=65 | I/II | Hormone Therapy | anastrozole | SD |
| KRT14 | SNV | Missense_Mutation | rs775441985 | c.1327N>C | p.Ser443Pro | p.S443P | P02533 | protein_coding | tolerated(0.29) | possibly_damaging(0.506) | TCGA-B6-A1KF-01 | Breast | breast invasive carcinoma | Female | >=65 | I/II | Unknown | Unknown | SD |
| KRT14 | SNV | Missense_Mutation | novel | c.824N>T | p.Ala275Val | p.A275V | P02533 | protein_coding | deleterious(0.02) | probably_damaging(0.951) | TCGA-B6-A40C-01 | Breast | breast invasive carcinoma | Female | <65 | I/II | Hormone Therapy | cyclophosphamide | SD |
| KRT14 | insertion | In_Frame_Ins | novel | c.770_771insTGCTGTTGTGGTCAGCACCATGAACAG | p.Met257delinsIleAlaValValValSerThrMetAsnArg | p.M257delinsIAVVVSTMNR | P02533 | protein_coding | TCGA-A7-A0CE-01 | Breast | breast invasive carcinoma | Female | <65 | I/II | Chemotherapy | adriamycin | SD | ||
| KRT14 | insertion | Frame_Shift_Ins | novel | c.294_295insAACGGGACCAGGCAAG | p.Gly99AsnfsTer15 | p.G99Nfs*15 | P02533 | protein_coding | TCGA-A8-A07R-01 | Breast | breast invasive carcinoma | Female | >=65 | III/IV | Ancillary | zoledronic | SD | ||
| KRT14 | insertion | Frame_Shift_Ins | novel | c.1130_1131insACTCCTGATTAGTCCATTGTCTGTCCACC | p.Gly378LeufsTer37 | p.G378Lfs*37 | P02533 | protein_coding | TCGA-BH-A0BD-01 | Breast | breast invasive carcinoma | Female | <65 | I/II | Chemotherapy | doxorubicin | SD | ||
| KRT14 | insertion | Frame_Shift_Ins | novel | c.484_485insCTATAGGACAGAGTCCACCCCAGATCCCTTCTTTCGAGGTCTTGGA | p.Tyr162SerfsTer24 | p.Y162Sfs*24 | P02533 | protein_coding | TCGA-BH-A0DS-01 | Breast | breast invasive carcinoma | Female | >=65 | III/IV | Chemotherapy | cyclophosphamide | SD | ||
| KRT14 | SNV | Missense_Mutation | novel | c.797G>A | p.Gly266Glu | p.G266E | P02533 | protein_coding | deleterious(0.01) | probably_damaging(0.914) | TCGA-MA-AA41-01 | Cervix | cervical & endocervical cancer | Female | <65 | I/II | Unknown | Unknown | SD |
| Page: 1 2 3 4 5 6 7 8 |
Top |
Related drugs of malignant transformation related genes |
| Identification of chemicals and drugs interact with genes involved in malignant transfromation |
| (DGIdb 4.0) |
| Entrez ID | Symbol | Category | Interaction Types | Drug Claim Name | Drug Name | PMIDs |
| Page: 1 |

Copyright 2023-Present -The University of Texas Health Science Center at Houston |