
|
|||||
|
 | |
| |
| |
| |
| |
| |
|
Gene: KRT13 |
Gene summary for KRT13 |
| Gene information | Species | Human | Gene symbol | KRT13 | Gene ID | 3860 |
| Gene name | keratin 13 | |
| Gene Alias | CK13 | |
| Cytomap | 17q21.2 | |
| Gene Type | protein-coding | GO ID | GO:0006996 | UniProtAcc | P13646 |
Top |
Malignant transformation analysis |
| Identification of the aberrant gene expression in precancerous and cancerous lesions by comparing the gene expression of stem-like cells in diseased tissues with normal stem cells |
| Entrez ID | Symbol | Replicates | Species | Organ | Tissue | Adj P-value | Log2FC | Malignancy |
| 3860 | KRT13 | CA_HPV_1 | Human | Cervix | CC | 5.48e-61 | -1.21e+00 | 0.0264 |
| 3860 | KRT13 | CA_HPV_2 | Human | Cervix | CC | 2.11e-09 | -6.12e-01 | 0.0391 |
| 3860 | KRT13 | HSIL_HPV_1 | Human | Cervix | HSIL_HPV | 2.27e-58 | -1.28e+00 | 0.0116 |
| 3860 | KRT13 | HSIL_HPV_2 | Human | Cervix | HSIL_HPV | 2.04e-52 | -1.18e+00 | 0.0208 |
| 3860 | KRT13 | N_HPV_1 | Human | Cervix | N_HPV | 3.16e-24 | -8.27e-01 | 0.0079 |
| 3860 | KRT13 | N_HPV_2 | Human | Cervix | N_HPV | 2.10e-08 | 3.13e-01 | -0.0131 |
| 3860 | KRT13 | CCI_2 | Human | Cervix | CC | 1.56e-24 | -1.46e+00 | 0.5249 |
| 3860 | KRT13 | CCI_3 | Human | Cervix | CC | 6.25e-04 | 4.63e-01 | 0.516 |
| 3860 | KRT13 | CCII_1 | Human | Cervix | CC | 3.41e-32 | -1.33e+00 | 0.3249 |
| 3860 | KRT13 | Tumor | Human | Cervix | CC | 6.13e-11 | 4.66e-01 | 0.1241 |
| 3860 | KRT13 | sample1 | Human | Cervix | CC | 2.74e-29 | -1.33e+00 | 0.0959 |
| 3860 | KRT13 | sample3 | Human | Cervix | CC | 2.55e-03 | 2.90e-01 | 0.1387 |
| 3860 | KRT13 | H2 | Human | Cervix | HSIL_HPV | 7.79e-03 | 2.79e-01 | 0.0632 |
| 3860 | KRT13 | L1 | Human | Cervix | CC | 1.08e-04 | 3.64e-02 | 0.0802 |
| 3860 | KRT13 | T1 | Human | Cervix | CC | 6.97e-50 | -1.26e+00 | 0.0918 |
| 3860 | KRT13 | T2 | Human | Cervix | CC | 3.08e-23 | -1.40e+00 | 0.0709 |
| 3860 | KRT13 | T3 | Human | Cervix | CC | 4.26e-05 | 3.20e-01 | 0.1389 |
| 3860 | KRT13 | LZE2T | Human | Esophagus | ESCC | 2.07e-02 | 1.28e+00 | 0.082 |
| 3860 | KRT13 | LZE5T | Human | Esophagus | ESCC | 6.34e-10 | -2.37e-01 | 0.0514 |
| 3860 | KRT13 | LZE8T | Human | Esophagus | ESCC | 6.64e-16 | 2.50e+00 | 0.067 |
| Page: 1 2 3 4 |
| Tissue | Expression Dynamics | Abbreviation |
| Cervix |  | CC: Cervix cancer |
| HSIL_HPV: HPV-infected high-grade squamous intraepithelial lesions | ||
| N_HPV: HPV-infected normal cervix | ||
| Esophagus |  | ESCC: Esophageal squamous cell carcinoma |
| HGIN: High-grade intraepithelial neoplasias | ||
| LGIN: Low-grade intraepithelial neoplasias | ||
| Oral Cavity | 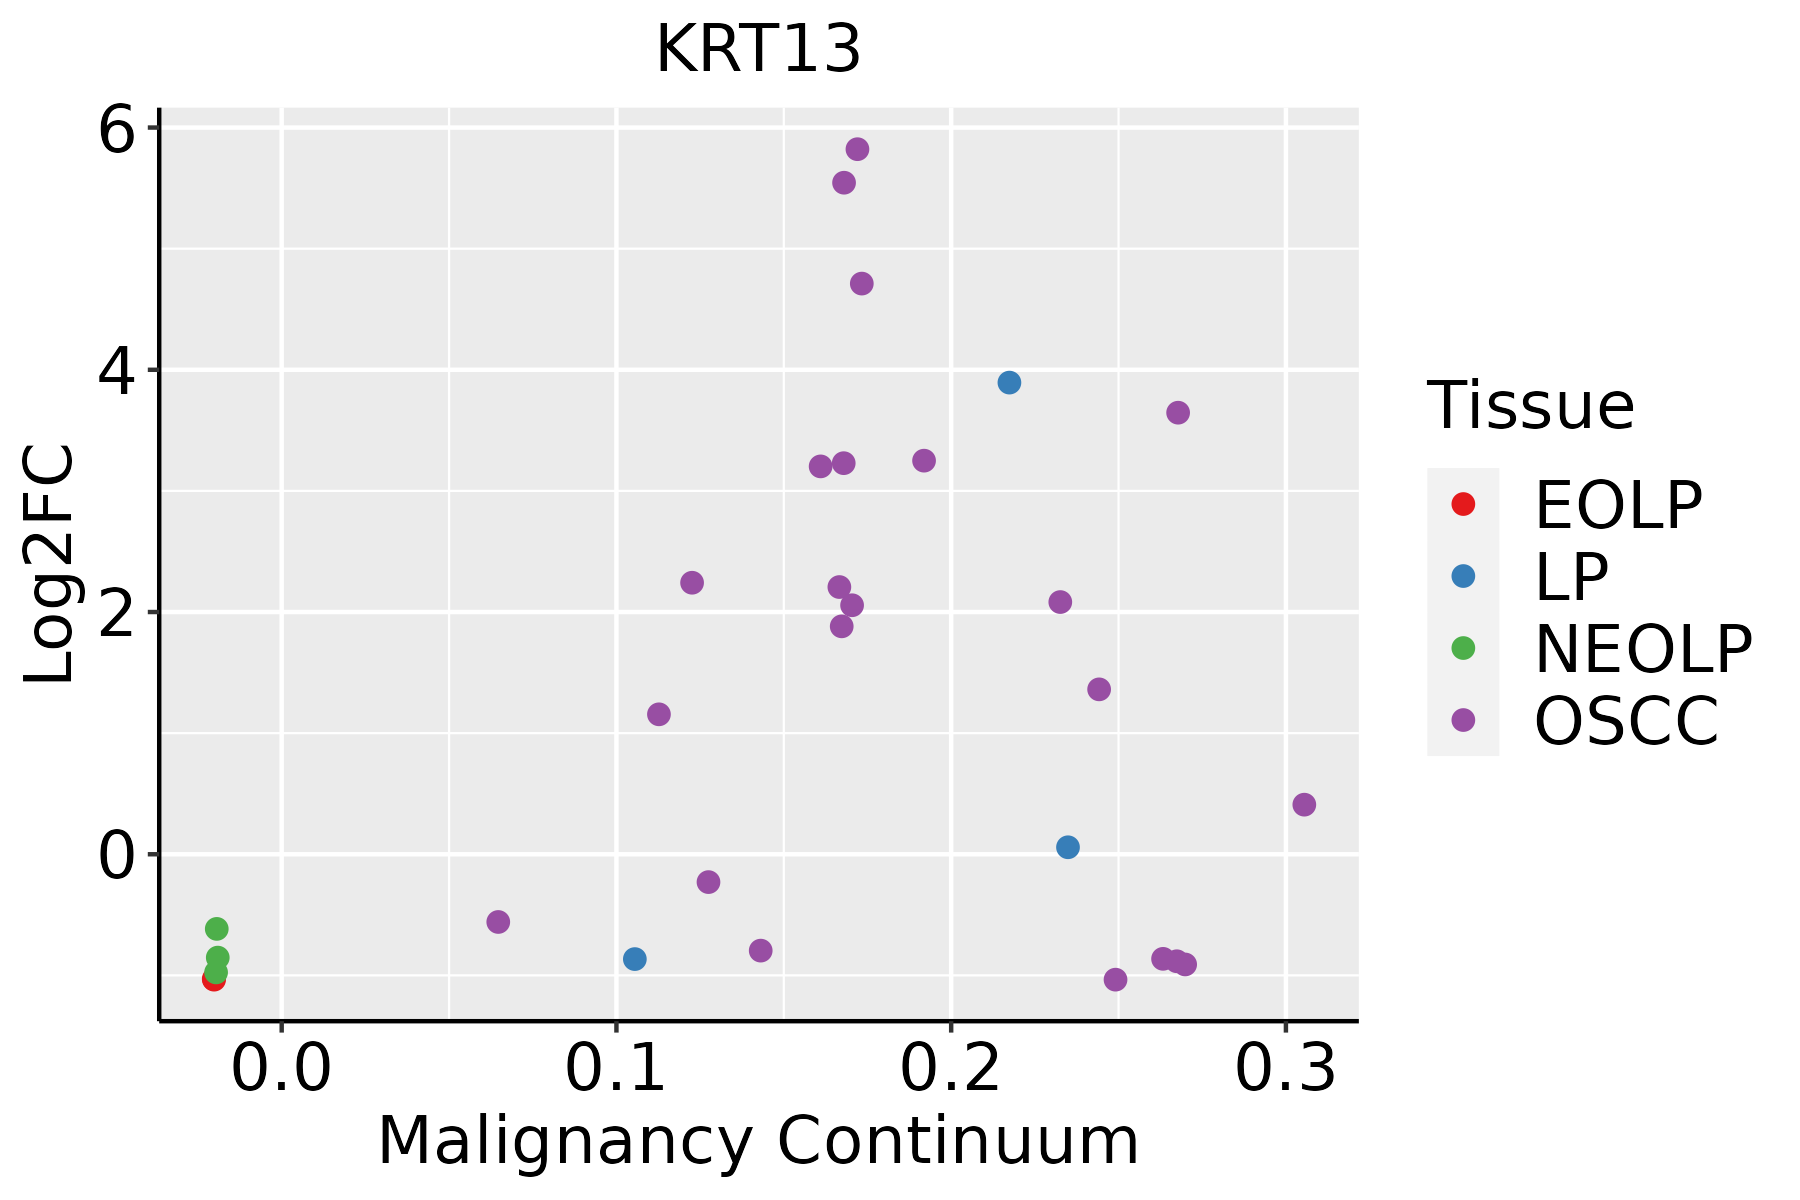 | EOLP: Erosive Oral lichen planus |
| LP: leukoplakia | ||
| NEOLP: Non-erosive oral lichen planus | ||
| OSCC: Oral squamous cell carcinoma | ||
| Prostate |  | BPH: Benign Prostatic Hyperplasia |
| ∗log2FC in expression of this searched gene in stem-like cells from each diseased tissue sample relative to stem-like cells in normal samples in each tissue plotted against the malignancy continuum. Samples are colored based on if they are from different disease stage. |
Top |
Malignant transformation related pathway analysis |
| Find out the enriched GO biological processes and KEGG pathways involved in transition from healthy to precancer to cancer |
| Tissue | Disease Stage | Enriched GO biological Processes |
| Colorectum | AD |  |
| Colorectum | SER |  |
| Colorectum | MSS |  |
| Colorectum | MSI-H |  |
| Colorectum | FAP |  |
| ∗Top 15 enriched GO BP terms are showed in the bar plot of each disease state in each tissue. Each row represents a significant GO biological process which is colored according to the -log10(p.adjust). |
| Page: 1 2 3 4 5 6 7 8 9 |
| GO ID | Tissue | Disease Stage | Description | Gene Ratio | Bg Ratio | pvalue | p.adjust | Count |
| Page: 1 |
| Pathway ID | Tissue | Disease Stage | Description | Gene Ratio | Bg Ratio | pvalue | p.adjust | qvalue | Count |
| hsa0491520 | Cervix | CC | Estrogen signaling pathway | 44/1267 | 138/8465 | 3.55e-07 | 3.97e-06 | 2.35e-06 | 44 |
| hsa04915110 | Cervix | CC | Estrogen signaling pathway | 44/1267 | 138/8465 | 3.55e-07 | 3.97e-06 | 2.35e-06 | 44 |
| hsa051504 | Cervix | HSIL_HPV | Staphylococcus aureus infection | 21/459 | 96/8465 | 2.93e-08 | 1.43e-06 | 1.16e-06 | 21 |
| hsa0491524 | Cervix | HSIL_HPV | Estrogen signaling pathway | 19/459 | 138/8465 | 1.54e-04 | 1.74e-03 | 1.40e-03 | 19 |
| hsa0515011 | Cervix | HSIL_HPV | Staphylococcus aureus infection | 21/459 | 96/8465 | 2.93e-08 | 1.43e-06 | 1.16e-06 | 21 |
| hsa0491534 | Cervix | HSIL_HPV | Estrogen signaling pathway | 19/459 | 138/8465 | 1.54e-04 | 1.74e-03 | 1.40e-03 | 19 |
| hsa051502 | Cervix | N_HPV | Staphylococcus aureus infection | 15/349 | 96/8465 | 7.81e-06 | 1.01e-04 | 7.90e-05 | 15 |
| hsa0491543 | Cervix | N_HPV | Estrogen signaling pathway | 16/349 | 138/8465 | 1.68e-04 | 1.53e-03 | 1.19e-03 | 16 |
| hsa051503 | Cervix | N_HPV | Staphylococcus aureus infection | 15/349 | 96/8465 | 7.81e-06 | 1.01e-04 | 7.90e-05 | 15 |
| hsa0491553 | Cervix | N_HPV | Estrogen signaling pathway | 16/349 | 138/8465 | 1.68e-04 | 1.53e-03 | 1.19e-03 | 16 |
| hsa0491529 | Oral cavity | EOLP | Estrogen signaling pathway | 38/1218 | 138/8465 | 3.78e-05 | 1.82e-04 | 1.07e-04 | 38 |
| hsa04915113 | Oral cavity | EOLP | Estrogen signaling pathway | 38/1218 | 138/8465 | 3.78e-05 | 1.82e-04 | 1.07e-04 | 38 |
| hsa04915210 | Oral cavity | NEOLP | Estrogen signaling pathway | 29/1112 | 138/8465 | 6.33e-03 | 2.34e-02 | 1.47e-02 | 29 |
| hsa0491537 | Oral cavity | NEOLP | Estrogen signaling pathway | 29/1112 | 138/8465 | 6.33e-03 | 2.34e-02 | 1.47e-02 | 29 |
| hsa0491527 | Prostate | BPH | Estrogen signaling pathway | 48/1718 | 138/8465 | 4.60e-05 | 3.16e-04 | 1.96e-04 | 48 |
| hsa04915112 | Prostate | BPH | Estrogen signaling pathway | 48/1718 | 138/8465 | 4.60e-05 | 3.16e-04 | 1.96e-04 | 48 |
| hsa0491528 | Prostate | Tumor | Estrogen signaling pathway | 48/1791 | 138/8465 | 1.36e-04 | 8.33e-04 | 5.17e-04 | 48 |
| hsa0491536 | Prostate | Tumor | Estrogen signaling pathway | 48/1791 | 138/8465 | 1.36e-04 | 8.33e-04 | 5.17e-04 | 48 |
| Page: 1 |
Top |
Cell-cell communication analysis |
| Identification of potential cell-cell interactions between two cell types and their ligand-receptor pairs for different disease states |
| Ligand | Receptor | LRpair | Pathway | Tissue | Disease Stage |
| Page: 1 |
Top |
Single-cell gene regulatory network inference analysis |
| Find out the significant the regulons (TFs) and the target genes of each regulon across cell types for different disease states |
| TF | Cell Type | Tissue | Disease Stage | Target Gene | RSS | Regulon Activity |
| ∗The dot plots of a searched regulon are shown for all cell subpopulations in each disease state of each tissue based on the regulon specific score inferred using pySCENIC and by calculating the average expression. |
| Page: 1 |
Top |
Somatic mutation of malignant transformation related genes |
| Annotation of somatic variants for genes involved in malignant transformation |
| Hugo Symbol | Variant Class | Variant Classification | dbSNP RS | HGVSc | HGVSp | HGVSp Short | SWISSPROT | BIOTYPE | SIFT | PolyPhen | Tumor Sample Barcode | Tissue | Histology | Sex | Age | Stage | Therapy Types | Drugs | Outcome |
| KRT13 | SNV | Missense_Mutation | novel | c.1340C>T | p.Ala447Val | p.A447V | P13646 | protein_coding | tolerated(0.42) | benign(0.011) | TCGA-A2-A0CO-01 | Breast | breast invasive carcinoma | Female | >=65 | I/II | Hormone Therapy | tamoxiphen | CR |
| KRT13 | SNV | Missense_Mutation | novel | c.794N>A | p.Thr265Asn | p.T265N | P13646 | protein_coding | deleterious(0) | probably_damaging(0.917) | TCGA-E9-A3HO-01 | Breast | breast invasive carcinoma | Female | <65 | I/II | Chemotherapy | cyclophosphamide | CR |
| KRT13 | SNV | Missense_Mutation | rs202015813 | c.814N>T | p.Arg272Cys | p.R272C | P13646 | protein_coding | deleterious(0.04) | possibly_damaging(0.478) | TCGA-E9-A54X-01 | Breast | breast invasive carcinoma | Female | >=65 | I/II | Unknown | Unknown | SD |
| KRT13 | SNV | Missense_Mutation | c.388N>A | p.Ala130Thr | p.A130T | P13646 | protein_coding | tolerated(0.73) | benign(0.053) | TCGA-A6-3809-01 | Colorectum | colon adenocarcinoma | Female | >=65 | I/II | Unknown | Unknown | SD | |
| KRT13 | SNV | Missense_Mutation | c.1241C>A | p.Ala414Asp | p.A414D | P13646 | protein_coding | deleterious(0.01) | probably_damaging(0.952) | TCGA-AA-3662-01 | Colorectum | colon adenocarcinoma | Female | >=65 | III/IV | Chemotherapy | capecitabine | PR | |
| KRT13 | SNV | Missense_Mutation | novel | c.698N>C | p.Asn233Thr | p.N233T | P13646 | protein_coding | tolerated(0.21) | benign(0.015) | TCGA-AA-3984-01 | Colorectum | colon adenocarcinoma | Female | <65 | I/II | Unknown | Unknown | SD |
| KRT13 | SNV | Missense_Mutation | c.1253N>A | p.Gly418Asp | p.G418D | P13646 | protein_coding | tolerated(0.12) | benign(0.005) | TCGA-DM-A0XD-01 | Colorectum | colon adenocarcinoma | Male | >=65 | I/II | Unknown | Unknown | PD | |
| KRT13 | SNV | Missense_Mutation | rs138885186 | c.1216N>T | p.Arg406Cys | p.R406C | P13646 | protein_coding | deleterious(0.03) | possibly_damaging(0.479) | TCGA-A5-A0G2-01 | Endometrium | uterine corpus endometrioid carcinoma | Female | <65 | III/IV | Unknown | Unknown | SD |
| KRT13 | SNV | Missense_Mutation | rs200309164 | c.1133N>A | p.Arg378His | p.R378H | P13646 | protein_coding | deleterious(0.02) | probably_damaging(0.996) | TCGA-A5-A0G2-01 | Endometrium | uterine corpus endometrioid carcinoma | Female | <65 | III/IV | Unknown | Unknown | SD |
| KRT13 | SNV | Missense_Mutation | rs201006488 | c.628N>A | p.Gly210Ser | p.G210S | P13646 | protein_coding | deleterious(0.01) | probably_damaging(0.985) | TCGA-A5-A0G2-01 | Endometrium | uterine corpus endometrioid carcinoma | Female | <65 | III/IV | Unknown | Unknown | SD |
| Page: 1 2 3 4 5 6 |
Top |
Related drugs of malignant transformation related genes |
| Identification of chemicals and drugs interact with genes involved in malignant transfromation |
| (DGIdb 4.0) |
| Entrez ID | Symbol | Category | Interaction Types | Drug Claim Name | Drug Name | PMIDs |
| Page: 1 |

Copyright 2023-Present -The University of Texas Health Science Center at Houston |