
|
|||||
|
 | |
| |
| |
| |
| |
| |
|
Gene: KRT10 |
Gene summary for KRT10 |
| Gene information | Species | Human | Gene symbol | KRT10 | Gene ID | 3858 |
| Gene name | keratin 10 | |
| Gene Alias | BCIE | |
| Cytomap | 17q21.2 | |
| Gene Type | protein-coding | GO ID | GO:0006464 | UniProtAcc | P13645 |
Top |
Malignant transformation analysis |
| Identification of the aberrant gene expression in precancerous and cancerous lesions by comparing the gene expression of stem-like cells in diseased tissues with normal stem cells |
| Entrez ID | Symbol | Replicates | Species | Organ | Tissue | Adj P-value | Log2FC | Malignancy |
| 3858 | KRT10 | GSM4909281 | Human | Breast | IDC | 1.36e-02 | 2.11e-01 | 0.21 |
| 3858 | KRT10 | GSM4909286 | Human | Breast | IDC | 3.43e-06 | 1.22e-01 | 0.1081 |
| 3858 | KRT10 | GSM4909288 | Human | Breast | IDC | 1.05e-02 | -3.00e-01 | 0.0988 |
| 3858 | KRT10 | GSM4909290 | Human | Breast | IDC | 2.12e-139 | 1.36e+00 | 0.2096 |
| 3858 | KRT10 | GSM4909292 | Human | Breast | IDC | 8.16e-21 | 7.78e-01 | 0.1236 |
| 3858 | KRT10 | GSM4909294 | Human | Breast | IDC | 7.12e-06 | 1.47e-01 | 0.2022 |
| 3858 | KRT10 | GSM4909296 | Human | Breast | IDC | 3.64e-14 | -4.23e-01 | 0.1524 |
| 3858 | KRT10 | GSM4909297 | Human | Breast | IDC | 6.57e-16 | -2.20e-01 | 0.1517 |
| 3858 | KRT10 | GSM4909301 | Human | Breast | IDC | 1.65e-27 | 4.81e-01 | 0.1577 |
| 3858 | KRT10 | GSM4909307 | Human | Breast | IDC | 8.88e-04 | 2.54e-01 | 0.1569 |
| 3858 | KRT10 | GSM4909308 | Human | Breast | IDC | 1.60e-13 | 4.04e-01 | 0.158 |
| 3858 | KRT10 | GSM4909309 | Human | Breast | IDC | 4.06e-06 | 2.28e-01 | 0.0483 |
| 3858 | KRT10 | GSM4909311 | Human | Breast | IDC | 1.24e-39 | -4.56e-01 | 0.1534 |
| 3858 | KRT10 | GSM4909312 | Human | Breast | IDC | 7.57e-11 | -1.53e-01 | 0.1552 |
| 3858 | KRT10 | GSM4909316 | Human | Breast | IDC | 3.41e-02 | -1.23e-01 | 0.21 |
| 3858 | KRT10 | GSM4909317 | Human | Breast | IDC | 3.46e-04 | 2.97e-01 | 0.1355 |
| 3858 | KRT10 | GSM4909318 | Human | Breast | IDC | 3.98e-05 | 3.70e-01 | 0.2031 |
| 3858 | KRT10 | GSM4909319 | Human | Breast | IDC | 3.50e-50 | -5.78e-02 | 0.1563 |
| 3858 | KRT10 | GSM4909320 | Human | Breast | IDC | 1.55e-08 | 2.77e-02 | 0.1575 |
| 3858 | KRT10 | GSM4909321 | Human | Breast | IDC | 8.50e-21 | 1.82e-01 | 0.1559 |
| Page: 1 2 3 4 5 6 7 8 9 10 11 12 |
| Tissue | Expression Dynamics | Abbreviation |
| Breast | 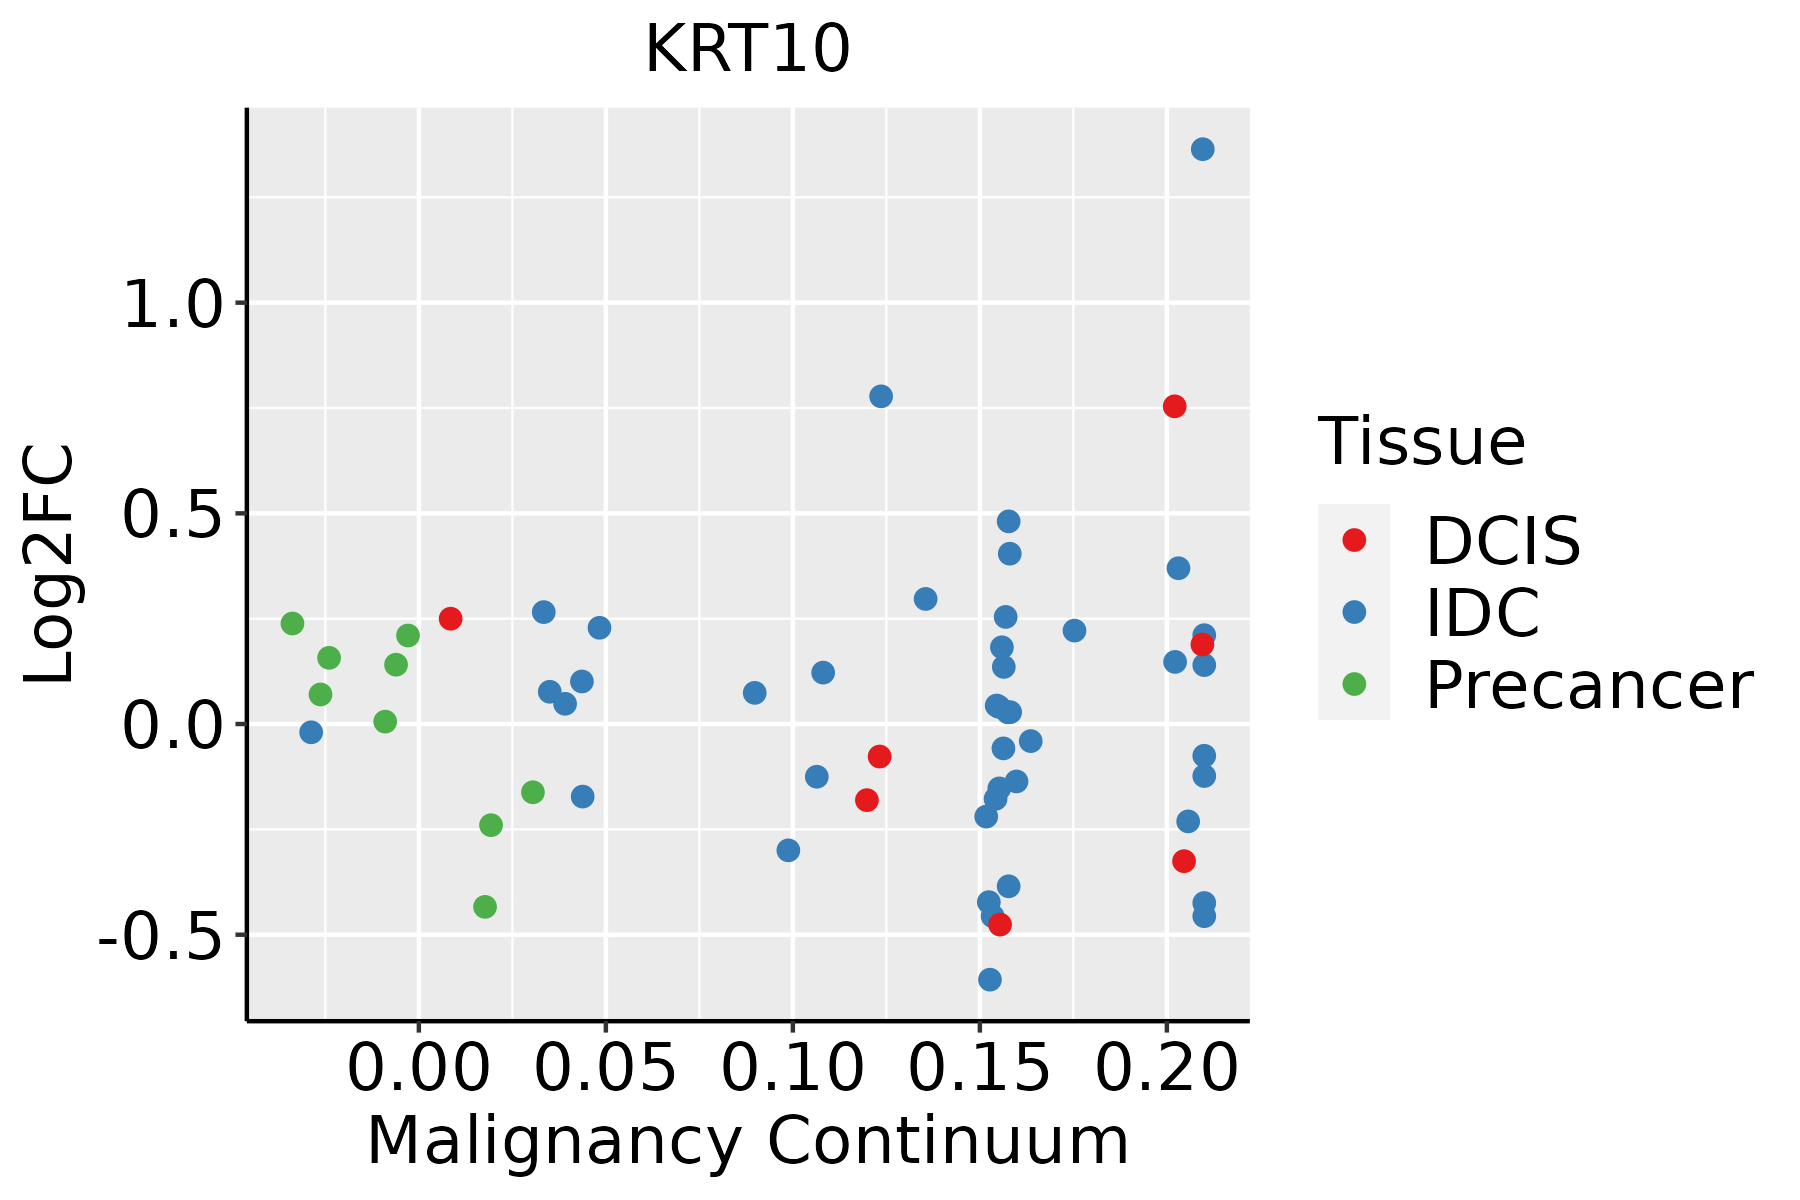 | IDC: Invasive ductal carcinoma |
| DCIS: Ductal carcinoma in situ | ||
| Precancer(BRCA1-mut): Precancerous lesion from BRCA1 mutation carriers | ||
| Cervix | 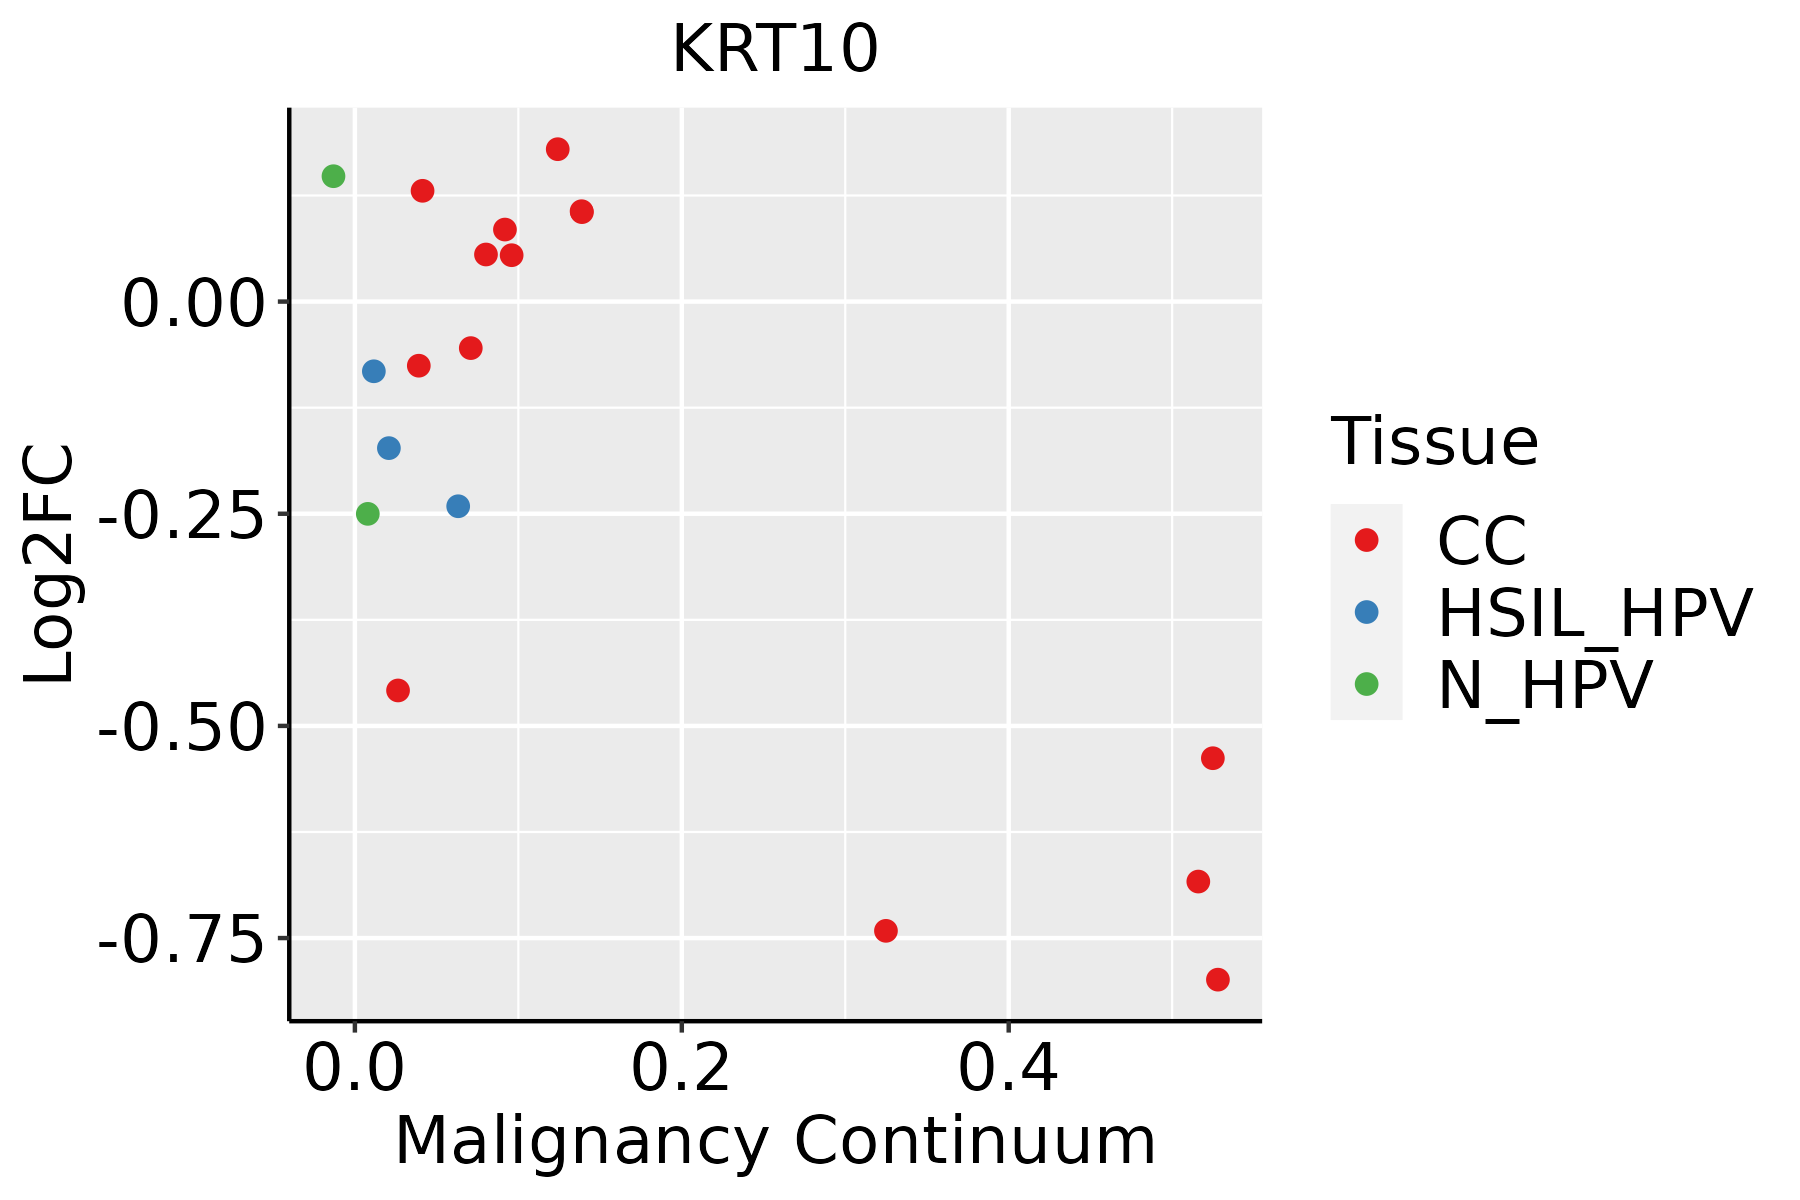 | CC: Cervix cancer |
| HSIL_HPV: HPV-infected high-grade squamous intraepithelial lesions | ||
| N_HPV: HPV-infected normal cervix | ||
| Colorectum (GSE201348) |  | FAP: Familial adenomatous polyposis |
| CRC: Colorectal cancer | ||
| Colorectum (HTA11) | 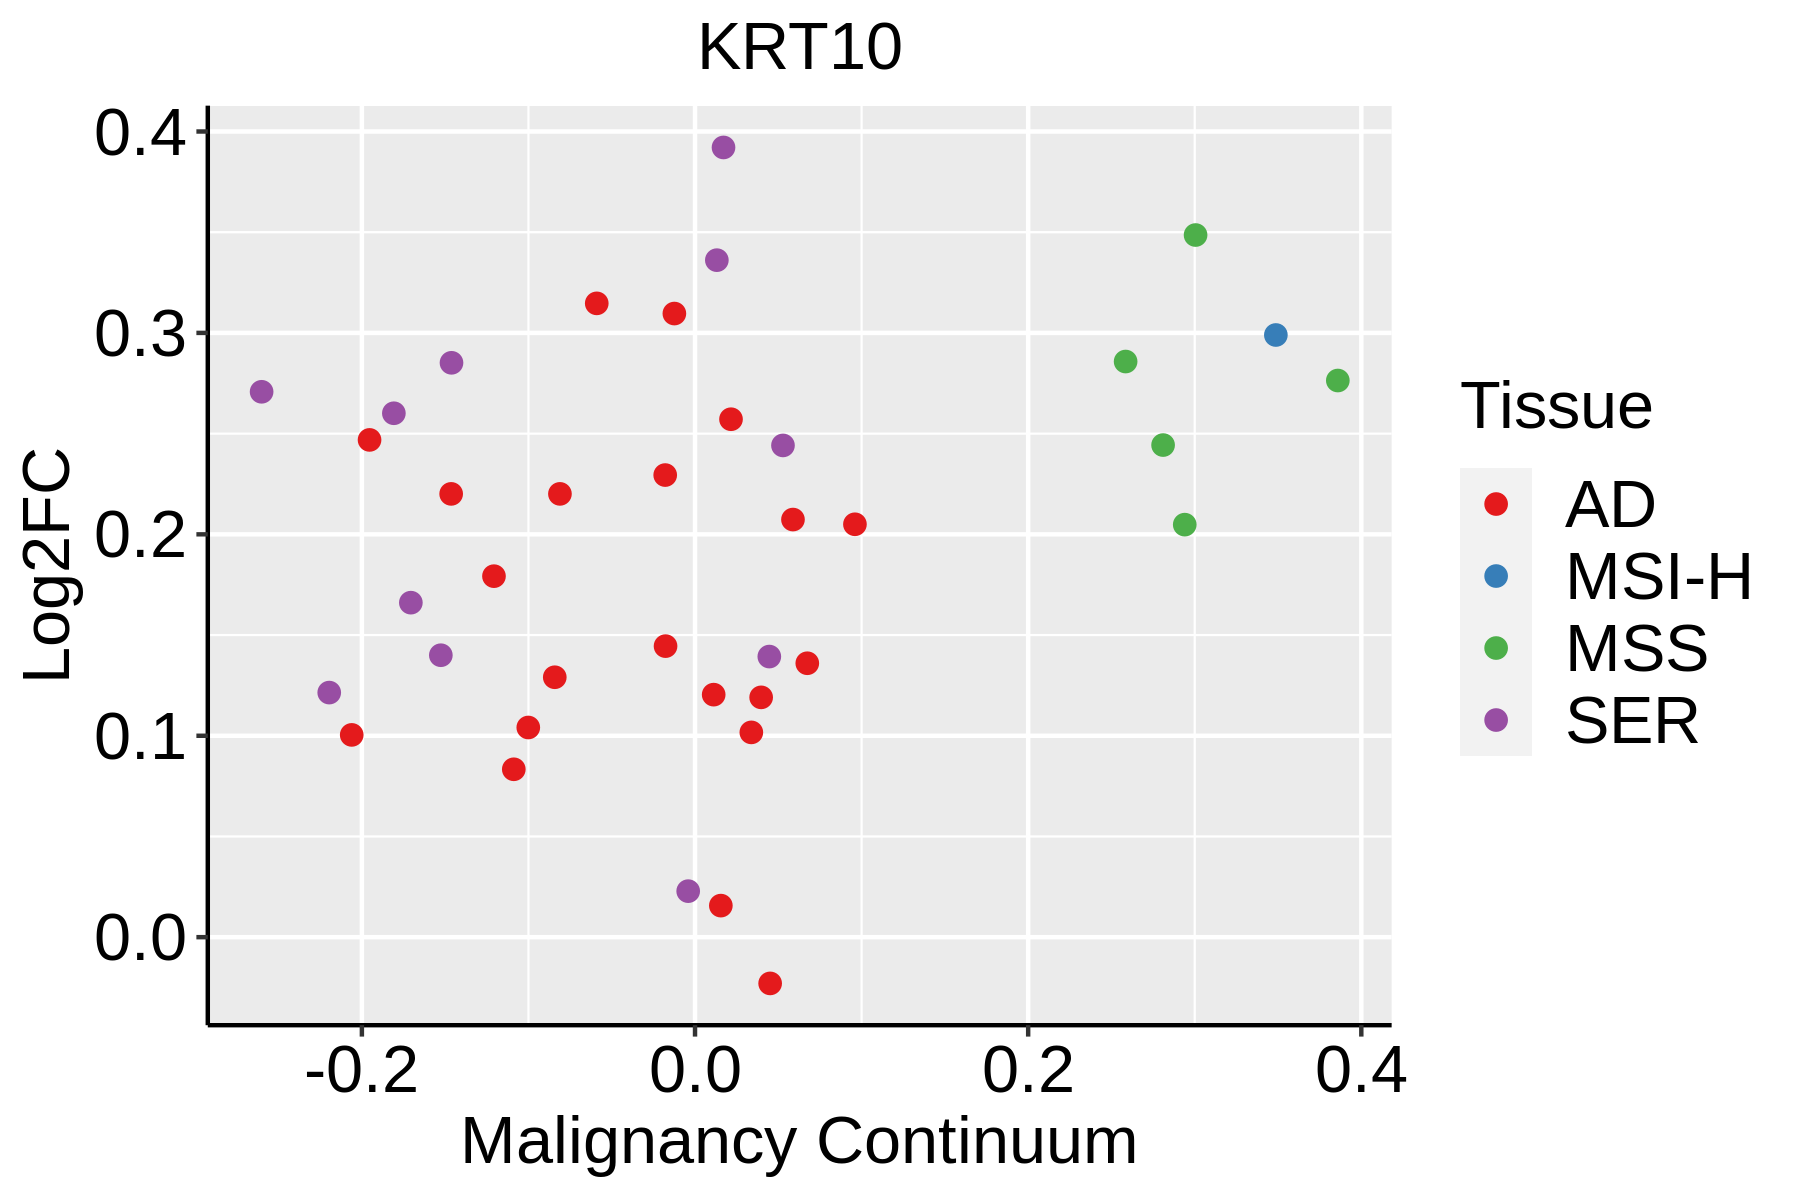 | AD: Adenomas |
| SER: Sessile serrated lesions | ||
| MSI-H: Microsatellite-high colorectal cancer | ||
| MSS: Microsatellite stable colorectal cancer | ||
| Endometrium | 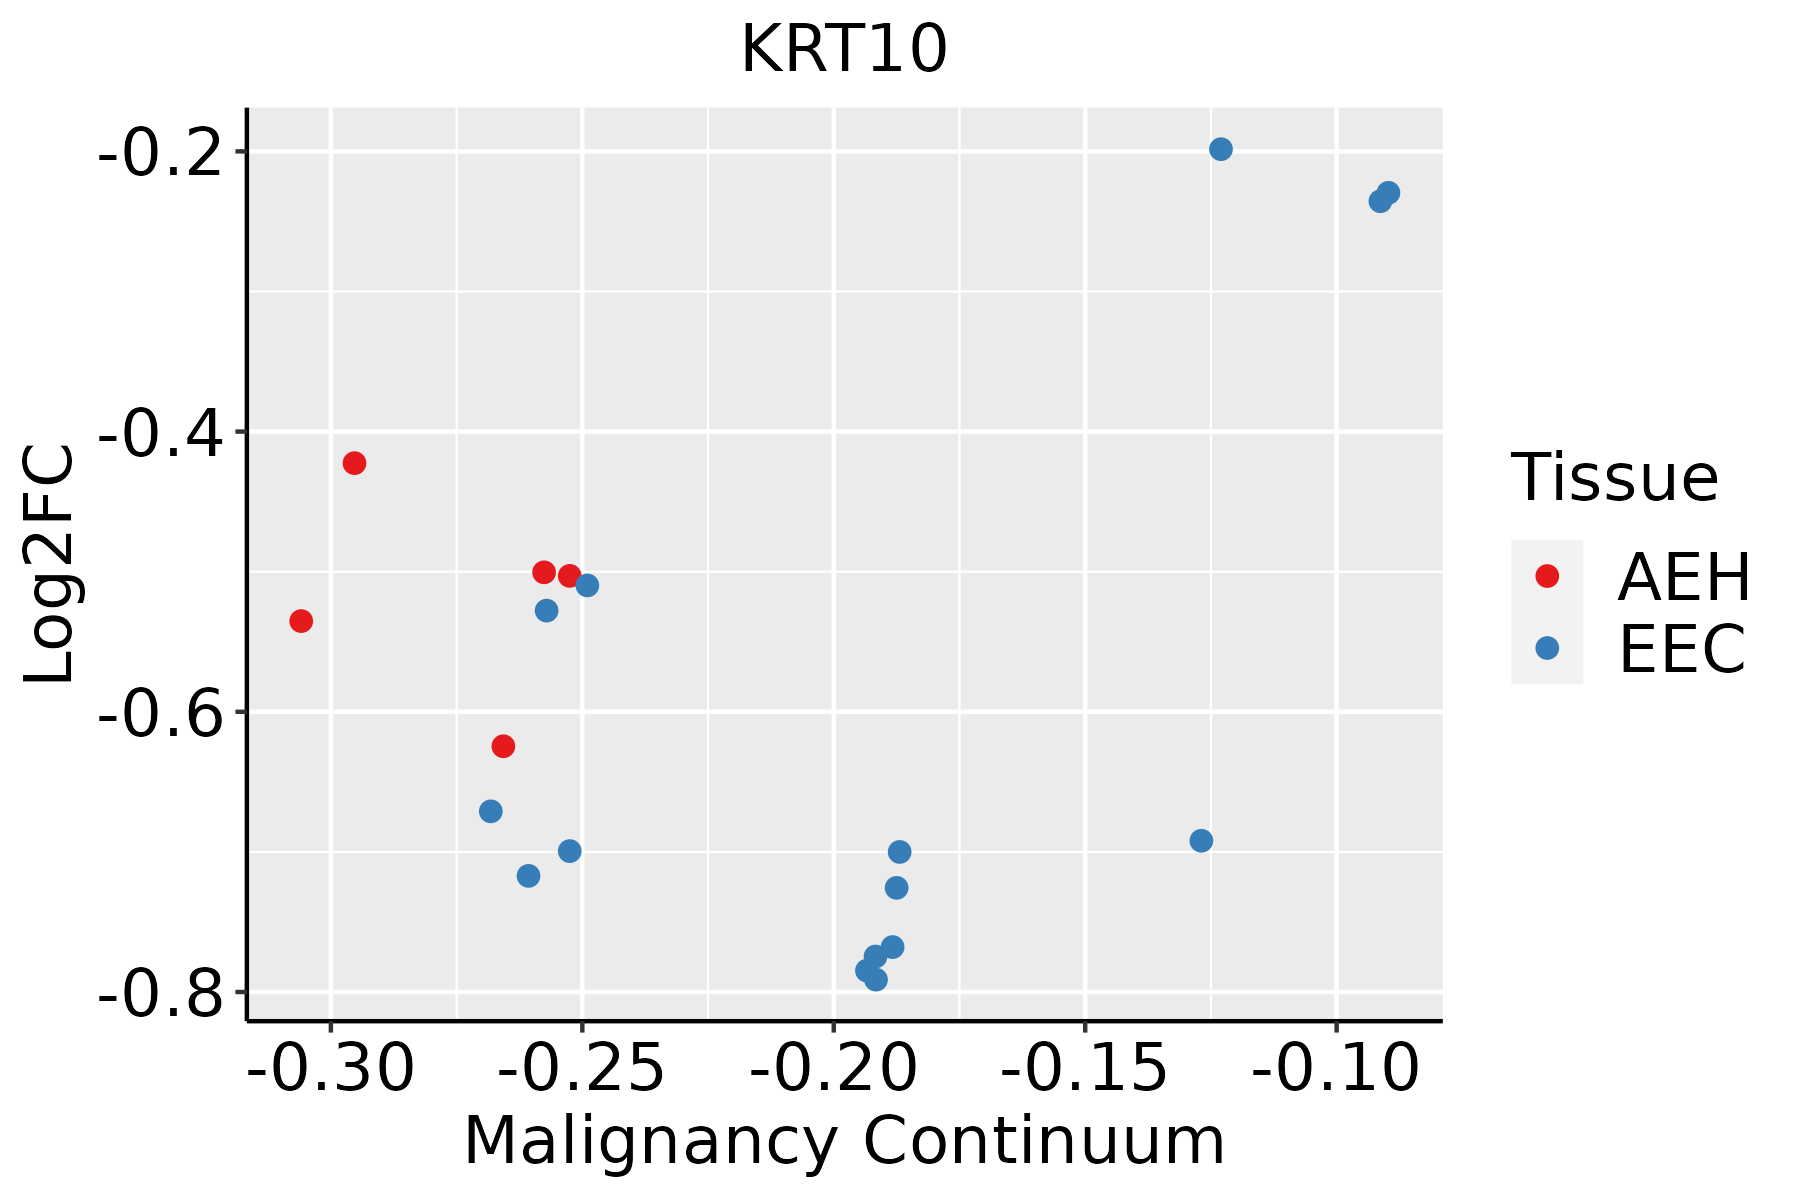 | AEH: Atypical endometrial hyperplasia |
| EEC: Endometrioid Cancer | ||
| Esophagus | 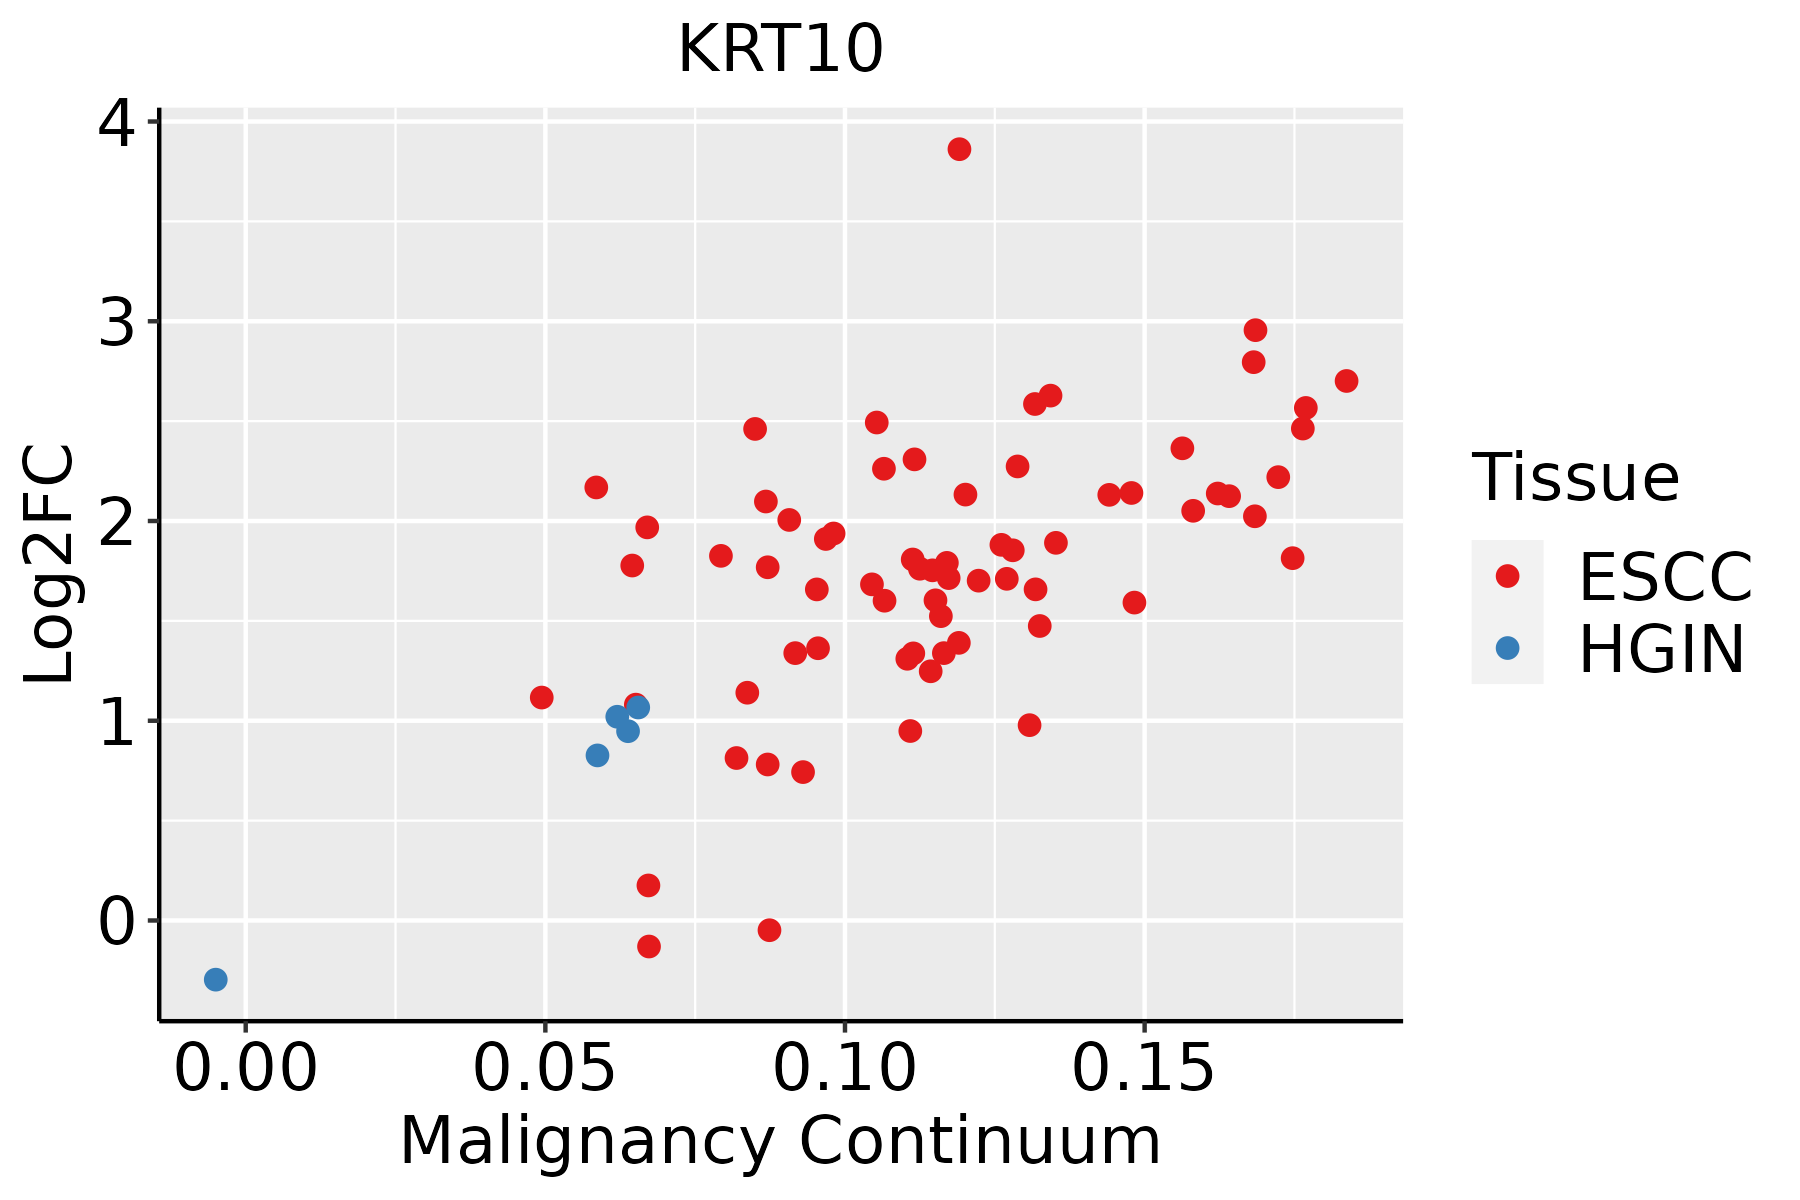 | ESCC: Esophageal squamous cell carcinoma |
| HGIN: High-grade intraepithelial neoplasias | ||
| LGIN: Low-grade intraepithelial neoplasias | ||
| Liver |  | HCC: Hepatocellular carcinoma |
| NAFLD: Non-alcoholic fatty liver disease | ||
| Oral Cavity | 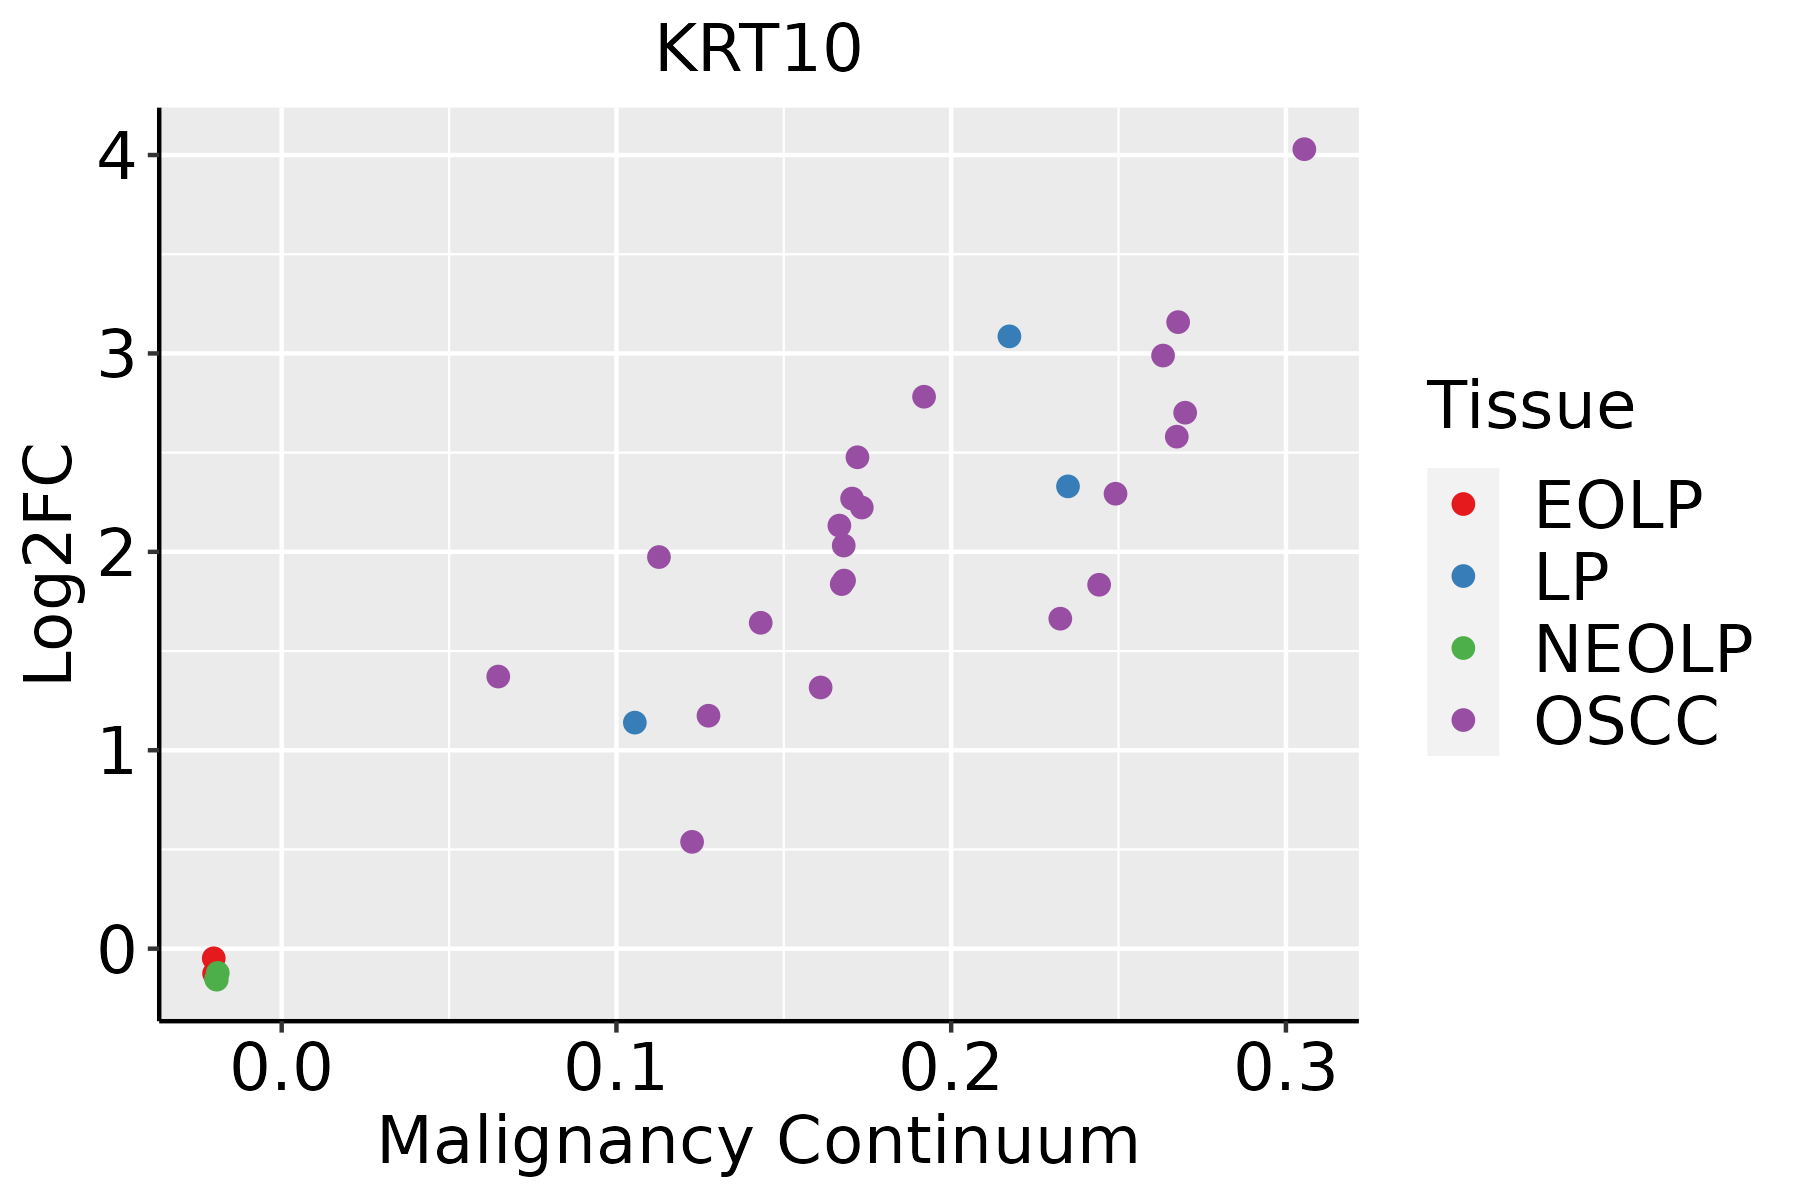 | EOLP: Erosive Oral lichen planus |
| LP: leukoplakia | ||
| NEOLP: Non-erosive oral lichen planus | ||
| OSCC: Oral squamous cell carcinoma | ||
| Prostate | 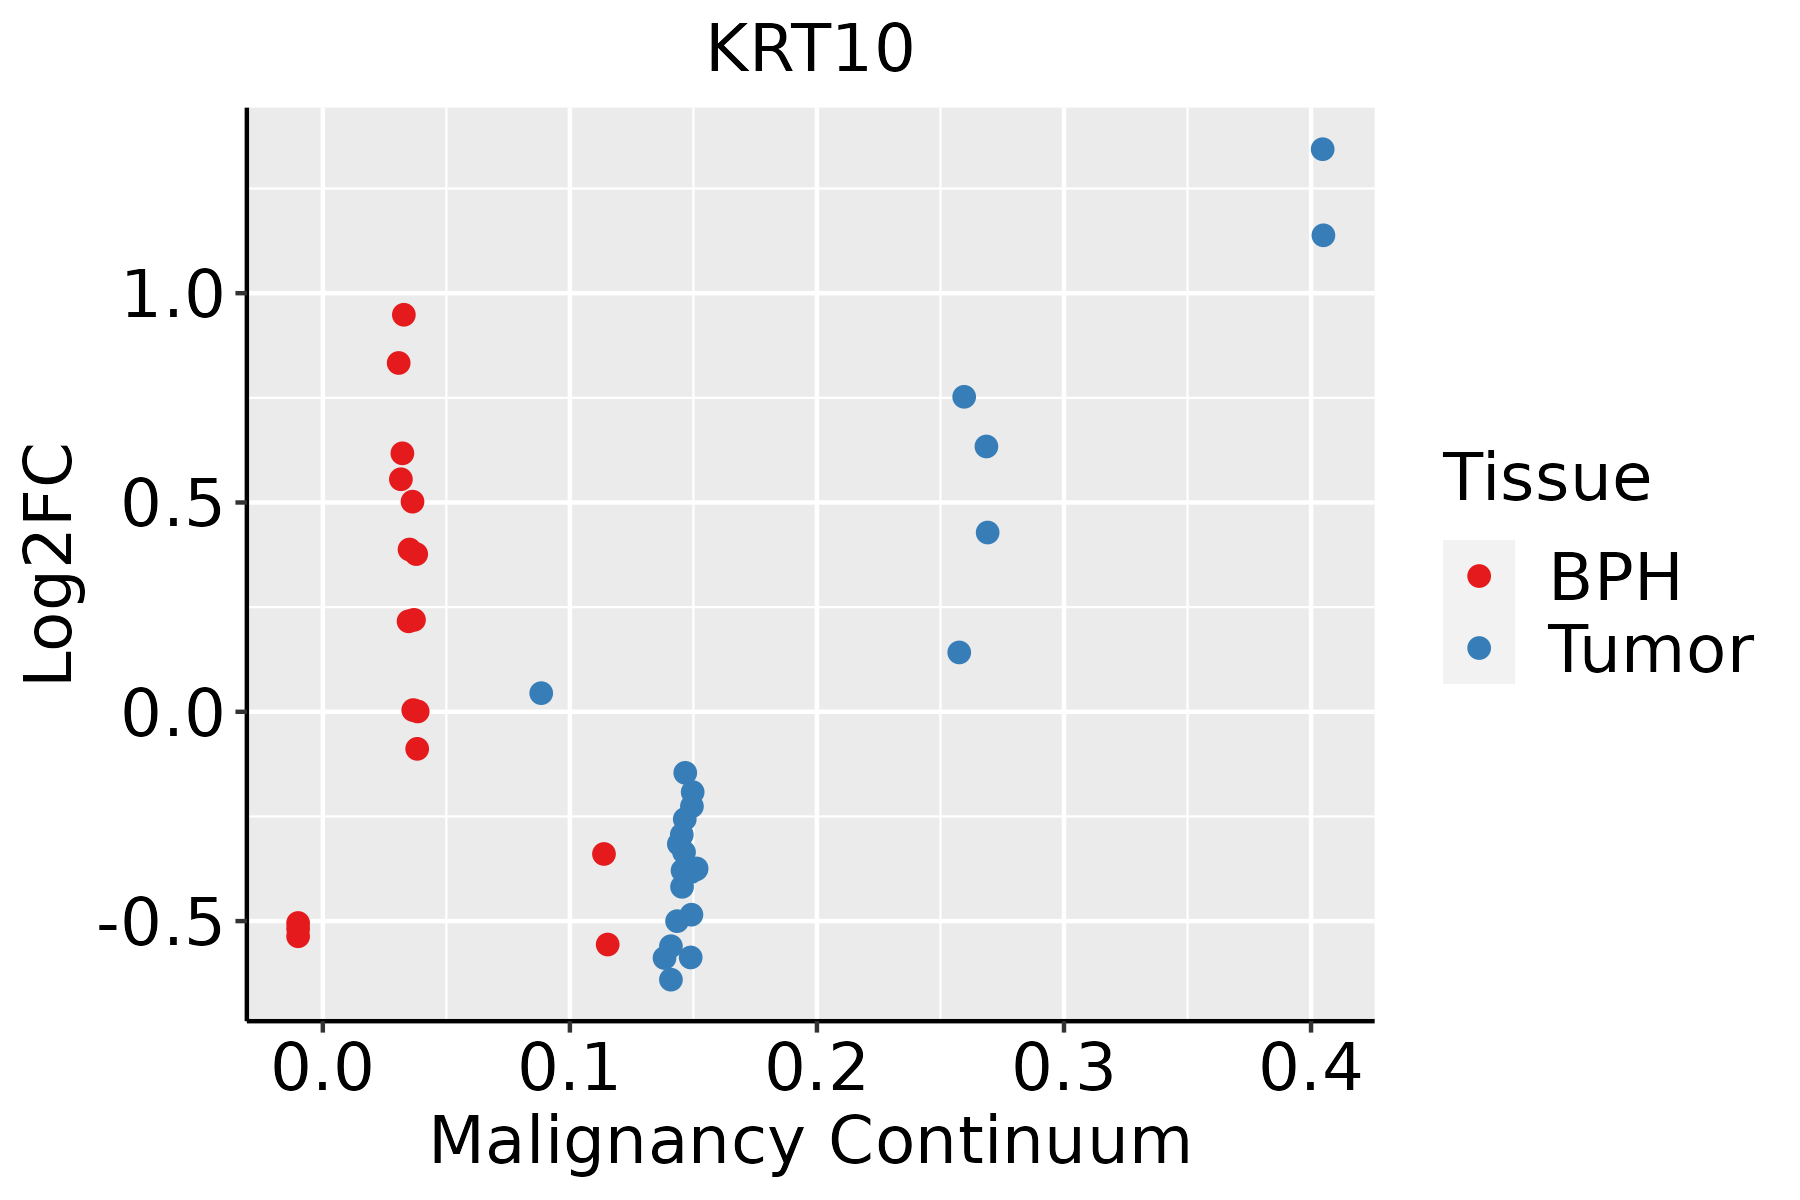 | BPH: Benign Prostatic Hyperplasia |
| Skin | 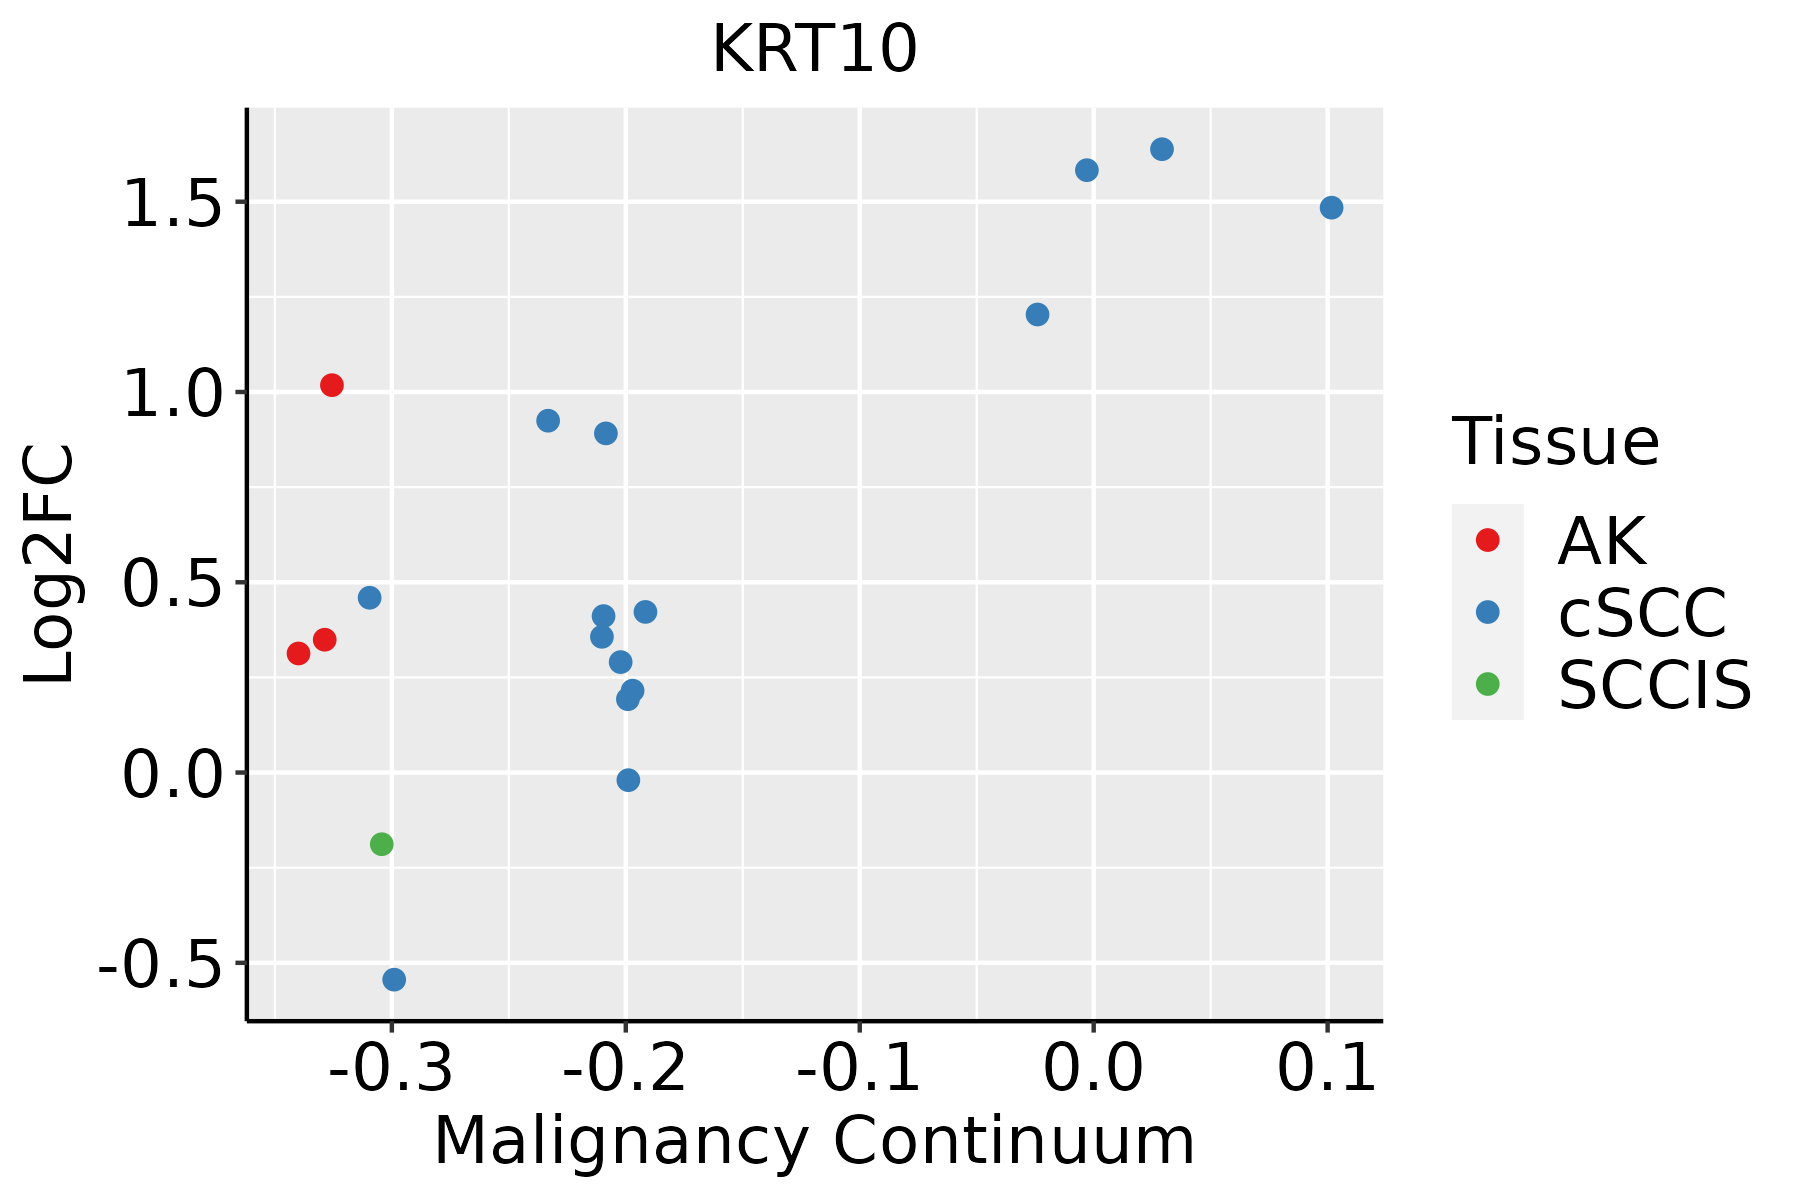 | AK: Actinic keratosis |
| cSCC: Cutaneous squamous cell carcinoma | ||
| SCCIS:squamous cell carcinoma in situ | ||
| Thyroid | 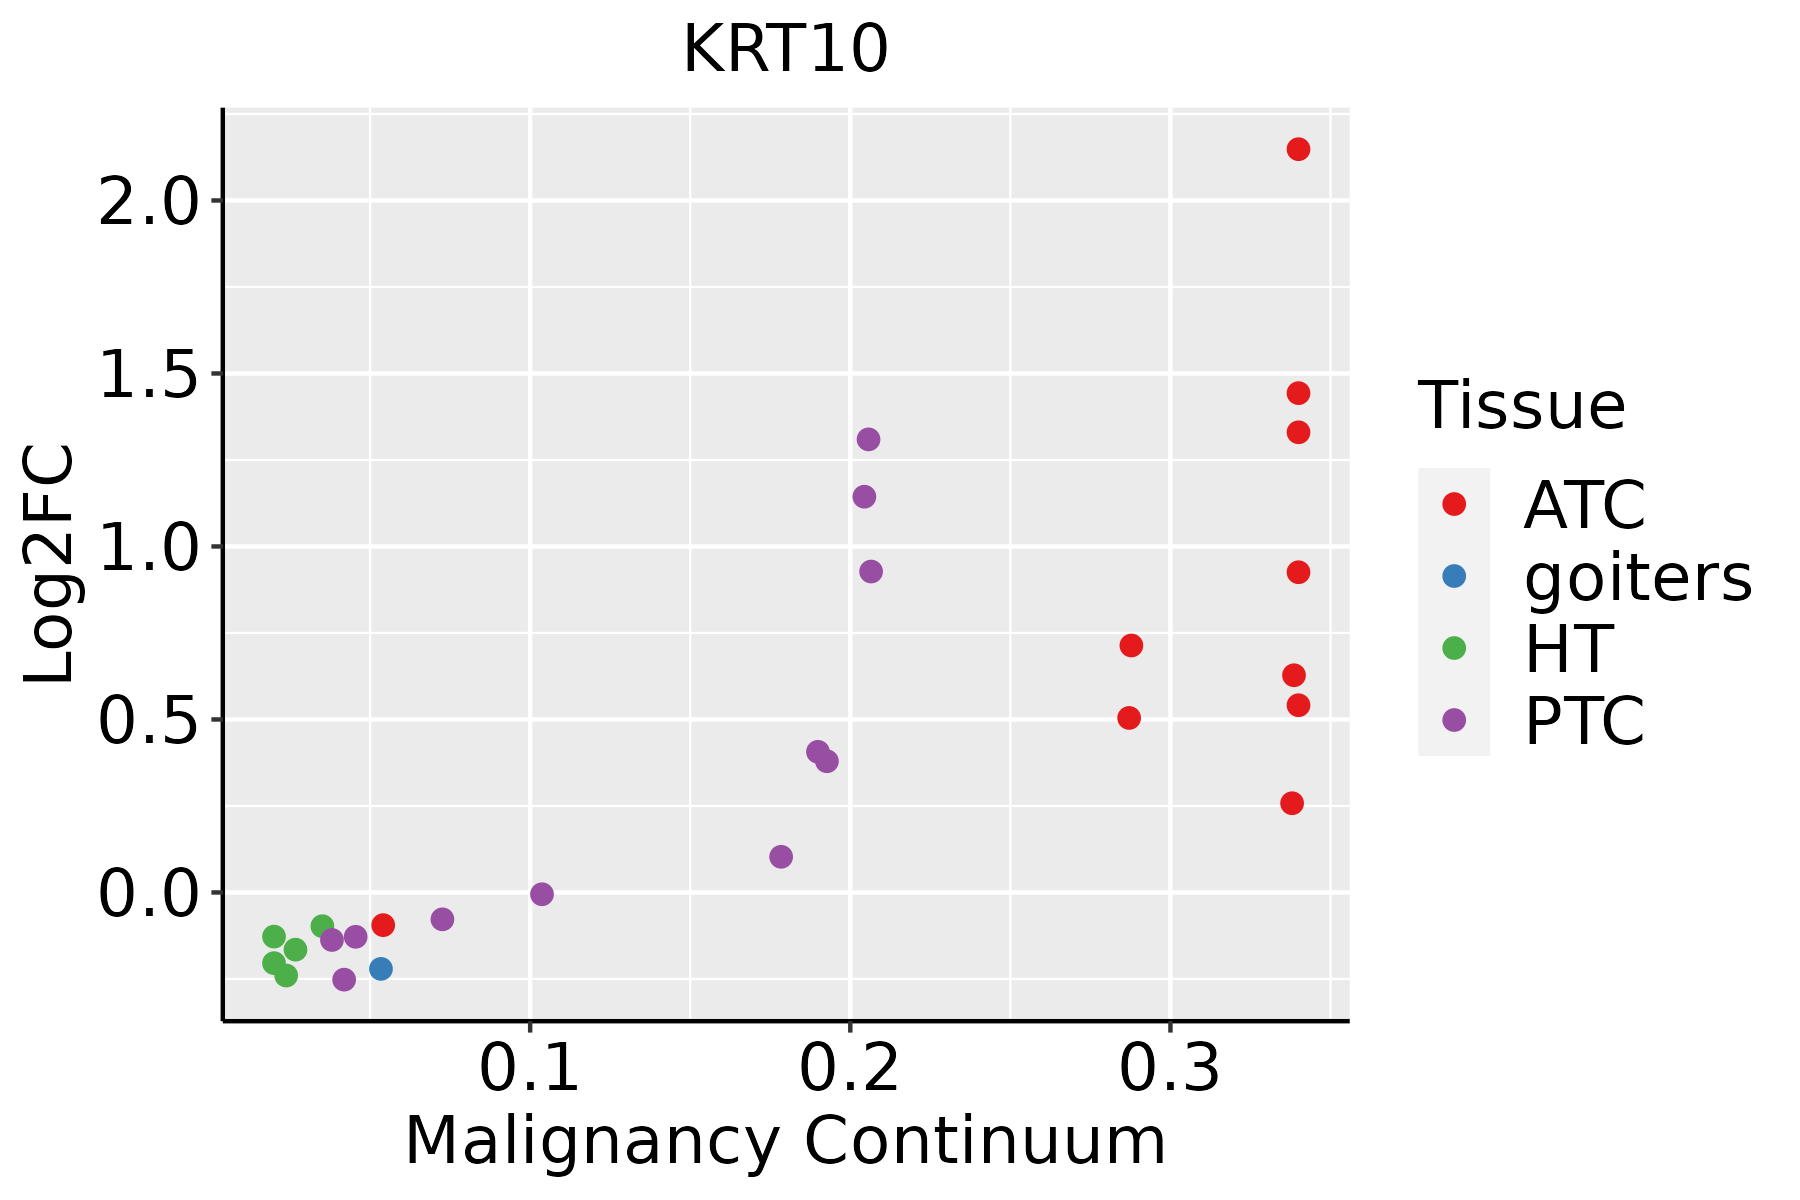 | ATC: Anaplastic thyroid cancer |
| HT: Hashimoto's thyroiditis | ||
| PTC: Papillary thyroid cancer |
| ∗log2FC in expression of this searched gene in stem-like cells from each diseased tissue sample relative to stem-like cells in normal samples in each tissue plotted against the malignancy continuum. Samples are colored based on if they are from different disease stage. |
Top |
Malignant transformation related pathway analysis |
| Find out the enriched GO biological processes and KEGG pathways involved in transition from healthy to precancer to cancer |
| Tissue | Disease Stage | Enriched GO biological Processes |
| Colorectum | AD |  |
| Colorectum | SER |  |
| Colorectum | MSS |  |
| Colorectum | MSI-H |  |
| Colorectum | FAP |  |
| ∗Top 15 enriched GO BP terms are showed in the bar plot of each disease state in each tissue. Each row represents a significant GO biological process which is colored according to the -log10(p.adjust). |
| Page: 1 2 3 4 5 6 7 8 9 |
| GO ID | Tissue | Disease Stage | Description | Gene Ratio | Bg Ratio | pvalue | p.adjust | Count |
| GO:00085445 | Breast | Precancer | epidermis development | 35/1080 | 324/18723 | 2.71e-04 | 3.96e-03 | 35 |
| GO:00099136 | Breast | Precancer | epidermal cell differentiation | 23/1080 | 202/18723 | 1.43e-03 | 1.50e-02 | 23 |
| GO:00302163 | Breast | Precancer | keratinocyte differentiation | 17/1080 | 139/18723 | 2.71e-03 | 2.39e-02 | 17 |
| GO:000854412 | Breast | IDC | epidermis development | 41/1434 | 324/18723 | 1.03e-03 | 1.14e-02 | 41 |
| GO:000991312 | Breast | IDC | epidermal cell differentiation | 28/1434 | 202/18723 | 1.62e-03 | 1.60e-02 | 28 |
| GO:00302161 | Breast | IDC | keratinocyte differentiation | 21/1434 | 139/18723 | 2.06e-03 | 1.95e-02 | 21 |
| GO:00435883 | Breast | IDC | skin development | 33/1434 | 263/18723 | 3.46e-03 | 2.87e-02 | 33 |
| GO:0018149 | Breast | IDC | peptide cross-linking | 8/1434 | 35/18723 | 4.22e-03 | 3.31e-02 | 8 |
| GO:000854422 | Breast | DCIS | epidermis development | 40/1390 | 324/18723 | 1.05e-03 | 1.16e-02 | 40 |
| GO:000991322 | Breast | DCIS | epidermal cell differentiation | 27/1390 | 202/18723 | 2.11e-03 | 1.97e-02 | 27 |
| GO:00302162 | Breast | DCIS | keratinocyte differentiation | 20/1390 | 139/18723 | 3.24e-03 | 2.74e-02 | 20 |
| GO:004358812 | Breast | DCIS | skin development | 31/1390 | 263/18723 | 7.15e-03 | 4.85e-02 | 31 |
| GO:00085446 | Cervix | CC | epidermis development | 83/2311 | 324/18723 | 3.91e-11 | 8.54e-09 | 83 |
| GO:00435884 | Cervix | CC | skin development | 71/2311 | 263/18723 | 8.04e-11 | 1.46e-08 | 71 |
| GO:00302164 | Cervix | CC | keratinocyte differentiation | 42/2311 | 139/18723 | 1.74e-08 | 1.28e-06 | 42 |
| GO:00099137 | Cervix | CC | epidermal cell differentiation | 53/2311 | 202/18723 | 5.48e-08 | 3.25e-06 | 53 |
| GO:00456822 | Cervix | CC | regulation of epidermis development | 22/2311 | 65/18723 | 5.56e-06 | 1.38e-04 | 22 |
| GO:00181493 | Cervix | CC | peptide cross-linking | 10/2311 | 35/18723 | 7.99e-03 | 4.18e-02 | 10 |
| GO:0009913 | Colorectum | AD | epidermal cell differentiation | 58/3918 | 202/18723 | 5.16e-03 | 3.42e-02 | 58 |
| GO:0008544 | Colorectum | AD | epidermis development | 87/3918 | 324/18723 | 5.99e-03 | 3.76e-02 | 87 |
| Page: 1 2 3 4 |
| Pathway ID | Tissue | Disease Stage | Description | Gene Ratio | Bg Ratio | pvalue | p.adjust | qvalue | Count |
| hsa0491518 | Breast | Precancer | Estrogen signaling pathway | 28/684 | 138/8465 | 4.10e-06 | 5.39e-05 | 4.13e-05 | 28 |
| hsa0491519 | Breast | Precancer | Estrogen signaling pathway | 28/684 | 138/8465 | 4.10e-06 | 5.39e-05 | 4.13e-05 | 28 |
| hsa0491523 | Breast | IDC | Estrogen signaling pathway | 35/867 | 138/8465 | 2.55e-07 | 5.18e-06 | 3.88e-06 | 35 |
| hsa0491533 | Breast | IDC | Estrogen signaling pathway | 35/867 | 138/8465 | 2.55e-07 | 5.18e-06 | 3.88e-06 | 35 |
| hsa0491542 | Breast | DCIS | Estrogen signaling pathway | 35/846 | 138/8465 | 1.40e-07 | 2.51e-06 | 1.85e-06 | 35 |
| hsa05150 | Breast | DCIS | Staphylococcus aureus infection | 19/846 | 96/8465 | 2.68e-03 | 1.67e-02 | 1.23e-02 | 19 |
| hsa0491552 | Breast | DCIS | Estrogen signaling pathway | 35/846 | 138/8465 | 1.40e-07 | 2.51e-06 | 1.85e-06 | 35 |
| hsa051501 | Breast | DCIS | Staphylococcus aureus infection | 19/846 | 96/8465 | 2.68e-03 | 1.67e-02 | 1.23e-02 | 19 |
| hsa0491520 | Cervix | CC | Estrogen signaling pathway | 44/1267 | 138/8465 | 3.55e-07 | 3.97e-06 | 2.35e-06 | 44 |
| hsa04915110 | Cervix | CC | Estrogen signaling pathway | 44/1267 | 138/8465 | 3.55e-07 | 3.97e-06 | 2.35e-06 | 44 |
| hsa04915 | Colorectum | SER | Estrogen signaling pathway | 38/1580 | 138/8465 | 6.51e-03 | 3.68e-02 | 2.67e-02 | 38 |
| hsa049151 | Colorectum | SER | Estrogen signaling pathway | 38/1580 | 138/8465 | 6.51e-03 | 3.68e-02 | 2.67e-02 | 38 |
| hsa049152 | Colorectum | MSS | Estrogen signaling pathway | 48/1875 | 138/8465 | 4.23e-04 | 3.08e-03 | 1.89e-03 | 48 |
| hsa049153 | Colorectum | MSS | Estrogen signaling pathway | 48/1875 | 138/8465 | 4.23e-04 | 3.08e-03 | 1.89e-03 | 48 |
| hsa0491525 | Endometrium | AEH | Estrogen signaling pathway | 35/1197 | 138/8465 | 3.10e-04 | 2.40e-03 | 1.75e-03 | 35 |
| hsa04915111 | Endometrium | AEH | Estrogen signaling pathway | 35/1197 | 138/8465 | 3.10e-04 | 2.40e-03 | 1.75e-03 | 35 |
| hsa0491526 | Endometrium | EEC | Estrogen signaling pathway | 34/1237 | 138/8465 | 1.19e-03 | 8.02e-03 | 5.98e-03 | 34 |
| hsa0491535 | Endometrium | EEC | Estrogen signaling pathway | 34/1237 | 138/8465 | 1.19e-03 | 8.02e-03 | 5.98e-03 | 34 |
| hsa0491514 | Liver | Cyst | Estrogen signaling pathway | 16/339 | 138/8465 | 1.20e-04 | 1.57e-03 | 1.30e-03 | 16 |
| hsa0491515 | Liver | Cyst | Estrogen signaling pathway | 16/339 | 138/8465 | 1.20e-04 | 1.57e-03 | 1.30e-03 | 16 |
| Page: 1 2 |
Top |
Cell-cell communication analysis |
| Identification of potential cell-cell interactions between two cell types and their ligand-receptor pairs for different disease states |
| Ligand | Receptor | LRpair | Pathway | Tissue | Disease Stage |
| Page: 1 |
Top |
Single-cell gene regulatory network inference analysis |
| Find out the significant the regulons (TFs) and the target genes of each regulon across cell types for different disease states |
| TF | Cell Type | Tissue | Disease Stage | Target Gene | RSS | Regulon Activity |
| ∗The dot plots of a searched regulon are shown for all cell subpopulations in each disease state of each tissue based on the regulon specific score inferred using pySCENIC and by calculating the average expression. |
| Page: 1 |
Top |
Somatic mutation of malignant transformation related genes |
| Annotation of somatic variants for genes involved in malignant transformation |
| Hugo Symbol | Variant Class | Variant Classification | dbSNP RS | HGVSc | HGVSp | HGVSp Short | SWISSPROT | BIOTYPE | SIFT | PolyPhen | Tumor Sample Barcode | Tissue | Histology | Sex | Age | Stage | Therapy Types | Drugs | Outcome |
| KRT10 | SNV | Missense_Mutation | rs779748369 | c.493N>T | p.Arg165Trp | p.R165W | P13645 | protein_coding | deleterious(0) | probably_damaging(0.999) | TCGA-AN-A046-01 | Breast | breast invasive carcinoma | Female | >=65 | I/II | Unknown | Unknown | SD |
| KRT10 | SNV | Missense_Mutation | c.1270G>A | p.Glu424Lys | p.E424K | P13645 | protein_coding | deleterious(0.02) | possibly_damaging(0.838) | TCGA-C8-A275-01 | Breast | breast invasive carcinoma | Female | <65 | I/II | Unknown | Unknown | SD | |
| KRT10 | insertion | Nonsense_Mutation | novel | c.388_389insTCCATGTAATCCAGACAGATGAATCTTAAATTAAGCACAATGTGGC | p.Gly130ValfsTer10 | p.G130Vfs*10 | P13645 | protein_coding | TCGA-AN-A0FX-01 | Breast | breast invasive carcinoma | Female | <65 | I/II | Unknown | Unknown | SD | ||
| KRT10 | SNV | Missense_Mutation | c.167C>G | p.Ser56Cys | p.S56C | P13645 | protein_coding | deleterious_low_confidence(0) | probably_damaging(0.972) | TCGA-EK-A3GK-01 | Cervix | cervical & endocervical cancer | Female | <65 | I/II | Unknown | Unknown | SD | |
| KRT10 | SNV | Missense_Mutation | c.669N>C | p.Gln223His | p.Q223H | P13645 | protein_coding | deleterious(0.01) | possibly_damaging(0.759) | TCGA-Q1-A73O-01 | Cervix | cervical & endocervical cancer | Female | <65 | I/II | Chemotherapy | cisplatin | CR | |
| KRT10 | deletion | In_Frame_Del | novel | c.1361_1363delNNN | p.Glu454del | p.E454del | P13645 | protein_coding | TCGA-EA-A3HU-01 | Cervix | cervical & endocervical cancer | Female | <65 | I/II | Unknown | Unknown | SD | ||
| KRT10 | SNV | Missense_Mutation | rs779748369 | c.493C>T | p.Arg165Trp | p.R165W | P13645 | protein_coding | deleterious(0) | probably_damaging(0.999) | TCGA-5M-AAT6-01 | Colorectum | colon adenocarcinoma | Female | <65 | III/IV | Unknown | Unknown | PD |
| KRT10 | SNV | Missense_Mutation | c.830N>T | p.Thr277Ile | p.T277I | P13645 | protein_coding | deleterious(0.01) | possibly_damaging(0.593) | TCGA-A6-2686-01 | Colorectum | colon adenocarcinoma | Female | >=65 | I/II | Unknown | Unknown | SD | |
| KRT10 | SNV | Missense_Mutation | rs369473843 | c.734G>A | p.Arg245His | p.R245H | P13645 | protein_coding | tolerated(0.5) | benign(0.279) | TCGA-AA-3947-01 | Colorectum | colon adenocarcinoma | Female | <65 | I/II | Unknown | Unknown | SD |
| KRT10 | SNV | Missense_Mutation | rs373319671 | c.581G>A | p.Arg194His | p.R194H | P13645 | protein_coding | tolerated(0.39) | benign(0.183) | TCGA-AA-3947-01 | Colorectum | colon adenocarcinoma | Female | <65 | I/II | Unknown | Unknown | SD |
| Page: 1 2 3 4 5 |
Top |
Related drugs of malignant transformation related genes |
| Identification of chemicals and drugs interact with genes involved in malignant transfromation |
| (DGIdb 4.0) |
| Entrez ID | Symbol | Category | Interaction Types | Drug Claim Name | Drug Name | PMIDs |
| 3858 | KRT10 | CELL SURFACE | EGFR TYROSINE KINASE INHIBITOR | 10601294 | ||
| 3858 | KRT10 | CELL SURFACE | OPIOID | 9450624 |
| Page: 1 |

Copyright 2023-Present -The University of Texas Health Science Center at Houston |