
|
|||||
|
 | |
| |
| |
| |
| |
| |
|
Gene: KRR1 |
Gene summary for KRR1 |
| Gene information | Species | Human | Gene symbol | KRR1 | Gene ID | 11103 |
| Gene name | KRR1 small subunit processome component homolog | |
| Gene Alias | HRB2 | |
| Cytomap | 12q21.2 | |
| Gene Type | protein-coding | GO ID | GO:0006139 | UniProtAcc | Q13601 |
Top |
Malignant transformation analysis |
| Identification of the aberrant gene expression in precancerous and cancerous lesions by comparing the gene expression of stem-like cells in diseased tissues with normal stem cells |
| Entrez ID | Symbol | Replicates | Species | Organ | Tissue | Adj P-value | Log2FC | Malignancy |
| 11103 | KRR1 | LZE4T | Human | Esophagus | ESCC | 8.79e-15 | 3.45e-01 | 0.0811 |
| 11103 | KRR1 | LZE5T | Human | Esophagus | ESCC | 4.86e-04 | 3.97e-01 | 0.0514 |
| 11103 | KRR1 | LZE7T | Human | Esophagus | ESCC | 1.30e-06 | 8.62e-01 | 0.0667 |
| 11103 | KRR1 | LZE8T | Human | Esophagus | ESCC | 2.70e-02 | 1.19e-01 | 0.067 |
| 11103 | KRR1 | LZE20T | Human | Esophagus | ESCC | 1.28e-03 | 2.14e-01 | 0.0662 |
| 11103 | KRR1 | LZE22T | Human | Esophagus | ESCC | 3.75e-03 | 1.38e-01 | 0.068 |
| 11103 | KRR1 | LZE24T | Human | Esophagus | ESCC | 1.13e-13 | 4.41e-01 | 0.0596 |
| 11103 | KRR1 | P1T-E | Human | Esophagus | ESCC | 1.88e-02 | 4.86e-01 | 0.0875 |
| 11103 | KRR1 | P2T-E | Human | Esophagus | ESCC | 5.42e-54 | 1.21e+00 | 0.1177 |
| 11103 | KRR1 | P4T-E | Human | Esophagus | ESCC | 1.31e-28 | 8.45e-01 | 0.1323 |
| 11103 | KRR1 | P5T-E | Human | Esophagus | ESCC | 1.62e-18 | 6.19e-01 | 0.1327 |
| 11103 | KRR1 | P8T-E | Human | Esophagus | ESCC | 7.53e-34 | 7.92e-01 | 0.0889 |
| 11103 | KRR1 | P9T-E | Human | Esophagus | ESCC | 8.61e-03 | 1.69e-01 | 0.1131 |
| 11103 | KRR1 | P10T-E | Human | Esophagus | ESCC | 4.82e-31 | 8.39e-01 | 0.116 |
| 11103 | KRR1 | P11T-E | Human | Esophagus | ESCC | 9.36e-09 | 5.30e-01 | 0.1426 |
| 11103 | KRR1 | P12T-E | Human | Esophagus | ESCC | 3.56e-30 | 8.11e-01 | 0.1122 |
| 11103 | KRR1 | P15T-E | Human | Esophagus | ESCC | 8.51e-29 | 7.70e-01 | 0.1149 |
| 11103 | KRR1 | P16T-E | Human | Esophagus | ESCC | 5.42e-38 | 8.60e-01 | 0.1153 |
| 11103 | KRR1 | P17T-E | Human | Esophagus | ESCC | 9.39e-09 | 4.15e-01 | 0.1278 |
| 11103 | KRR1 | P19T-E | Human | Esophagus | ESCC | 7.75e-05 | 7.61e-01 | 0.1662 |
| Page: 1 2 3 4 5 6 7 |
| Tissue | Expression Dynamics | Abbreviation |
| Esophagus | 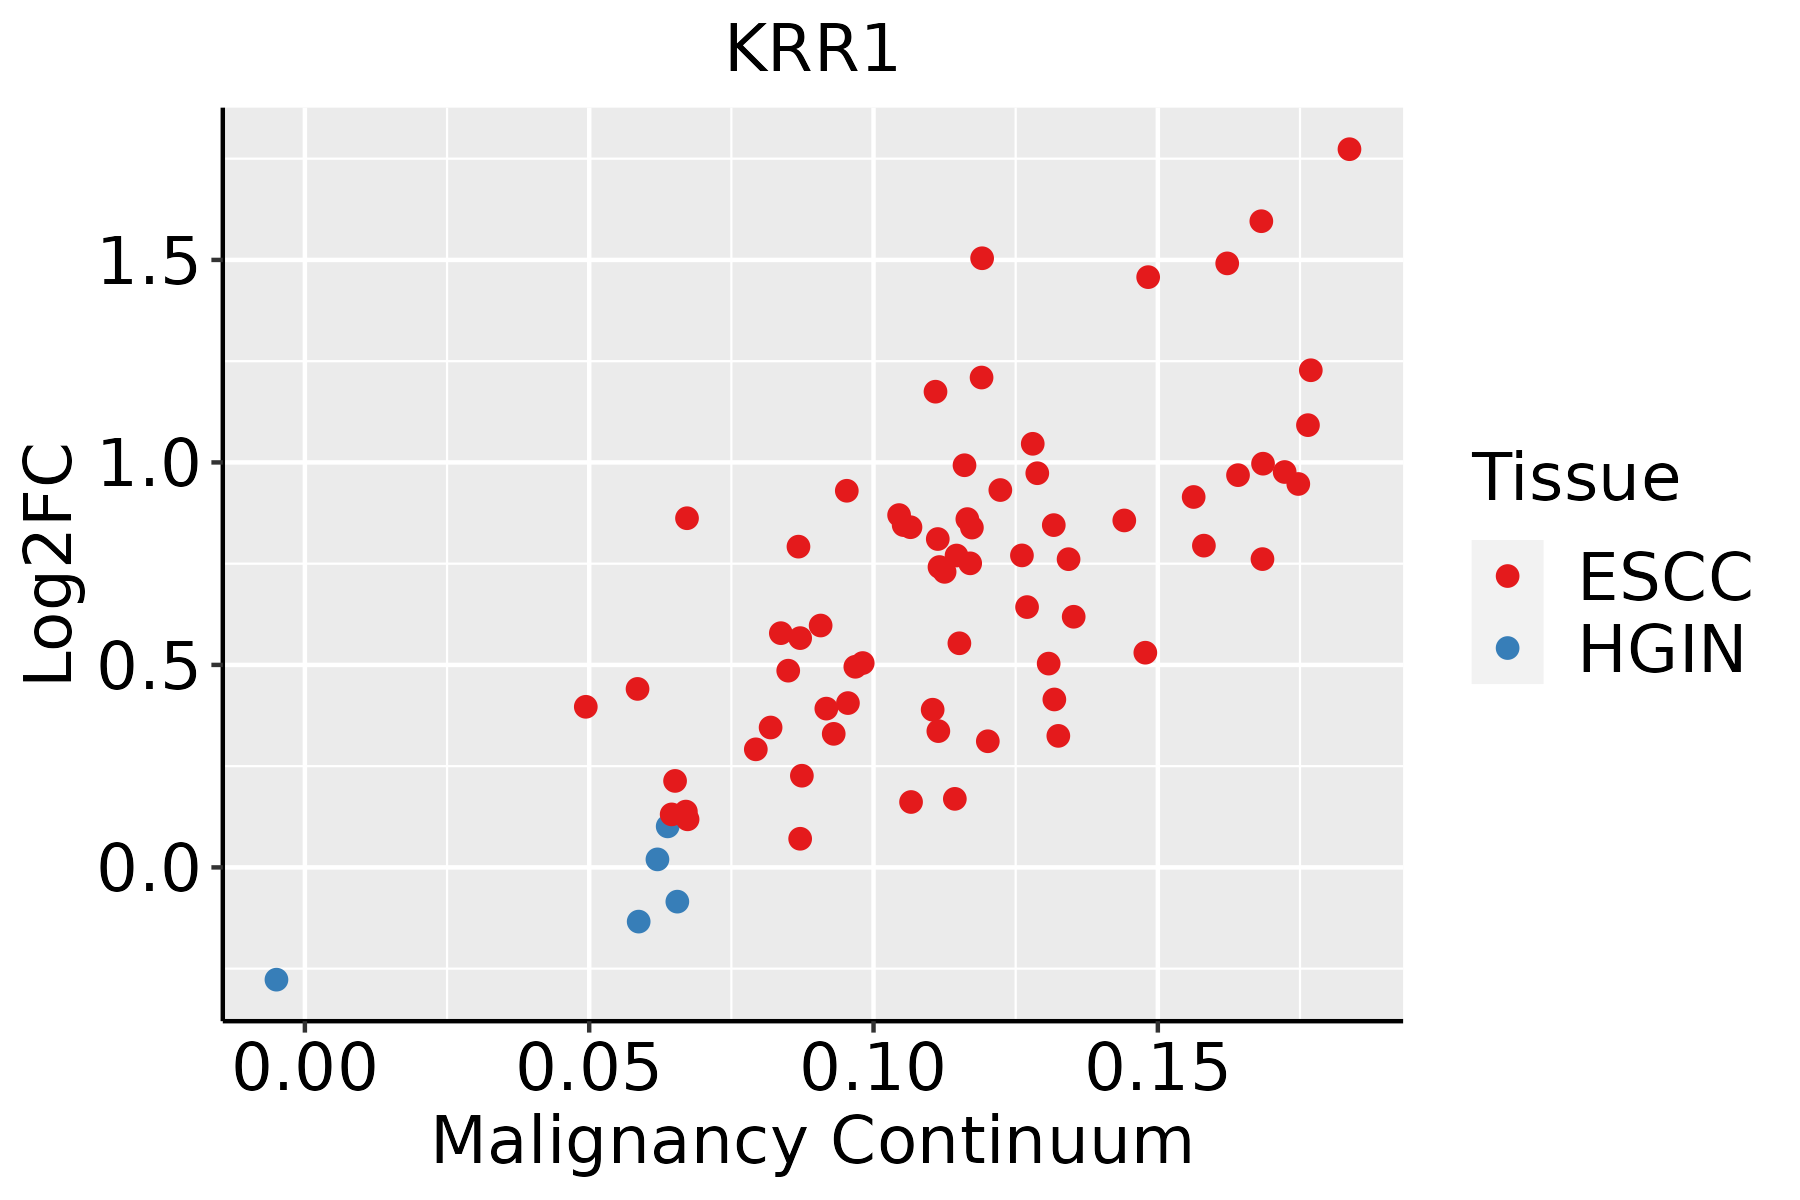 | ESCC: Esophageal squamous cell carcinoma |
| HGIN: High-grade intraepithelial neoplasias | ||
| LGIN: Low-grade intraepithelial neoplasias | ||
| Liver | 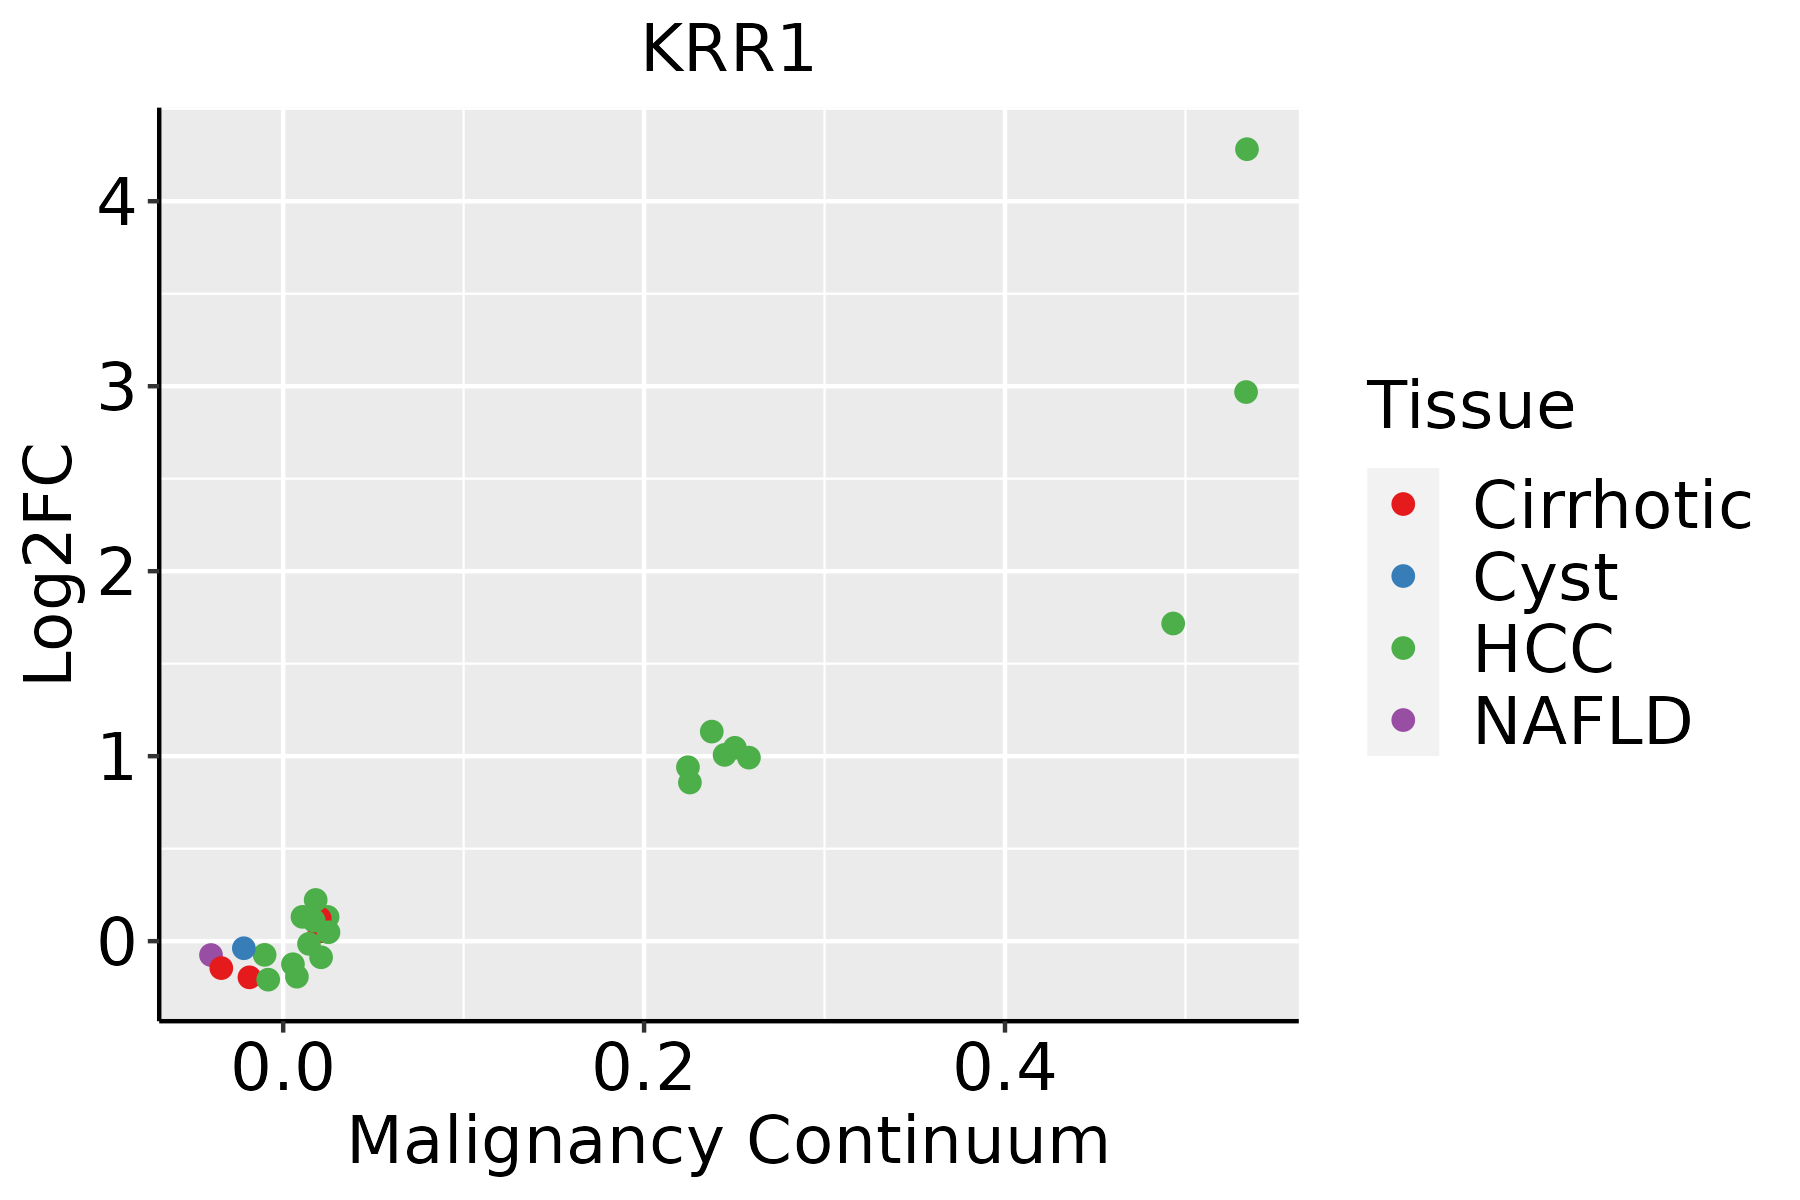 | HCC: Hepatocellular carcinoma |
| NAFLD: Non-alcoholic fatty liver disease | ||
| Oral Cavity | 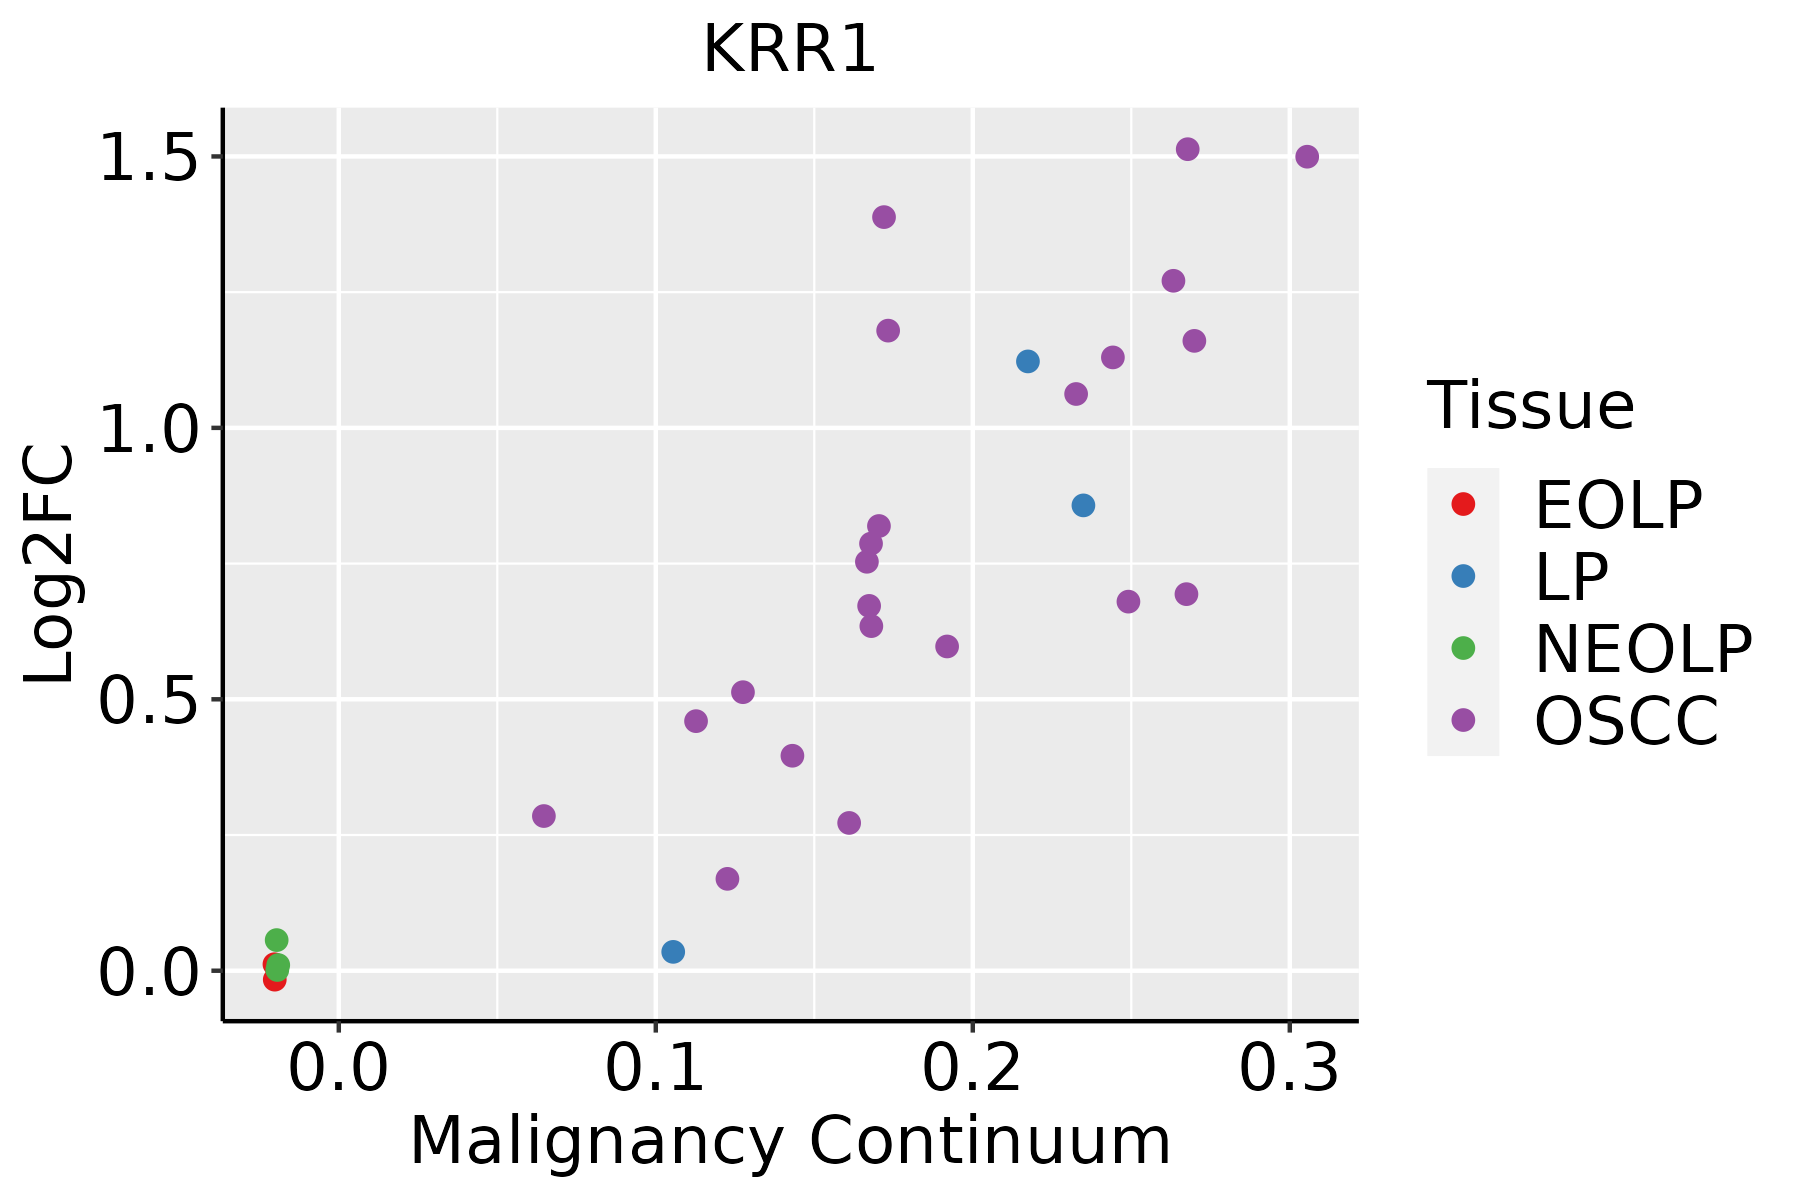 | EOLP: Erosive Oral lichen planus |
| LP: leukoplakia | ||
| NEOLP: Non-erosive oral lichen planus | ||
| OSCC: Oral squamous cell carcinoma | ||
| Prostate | 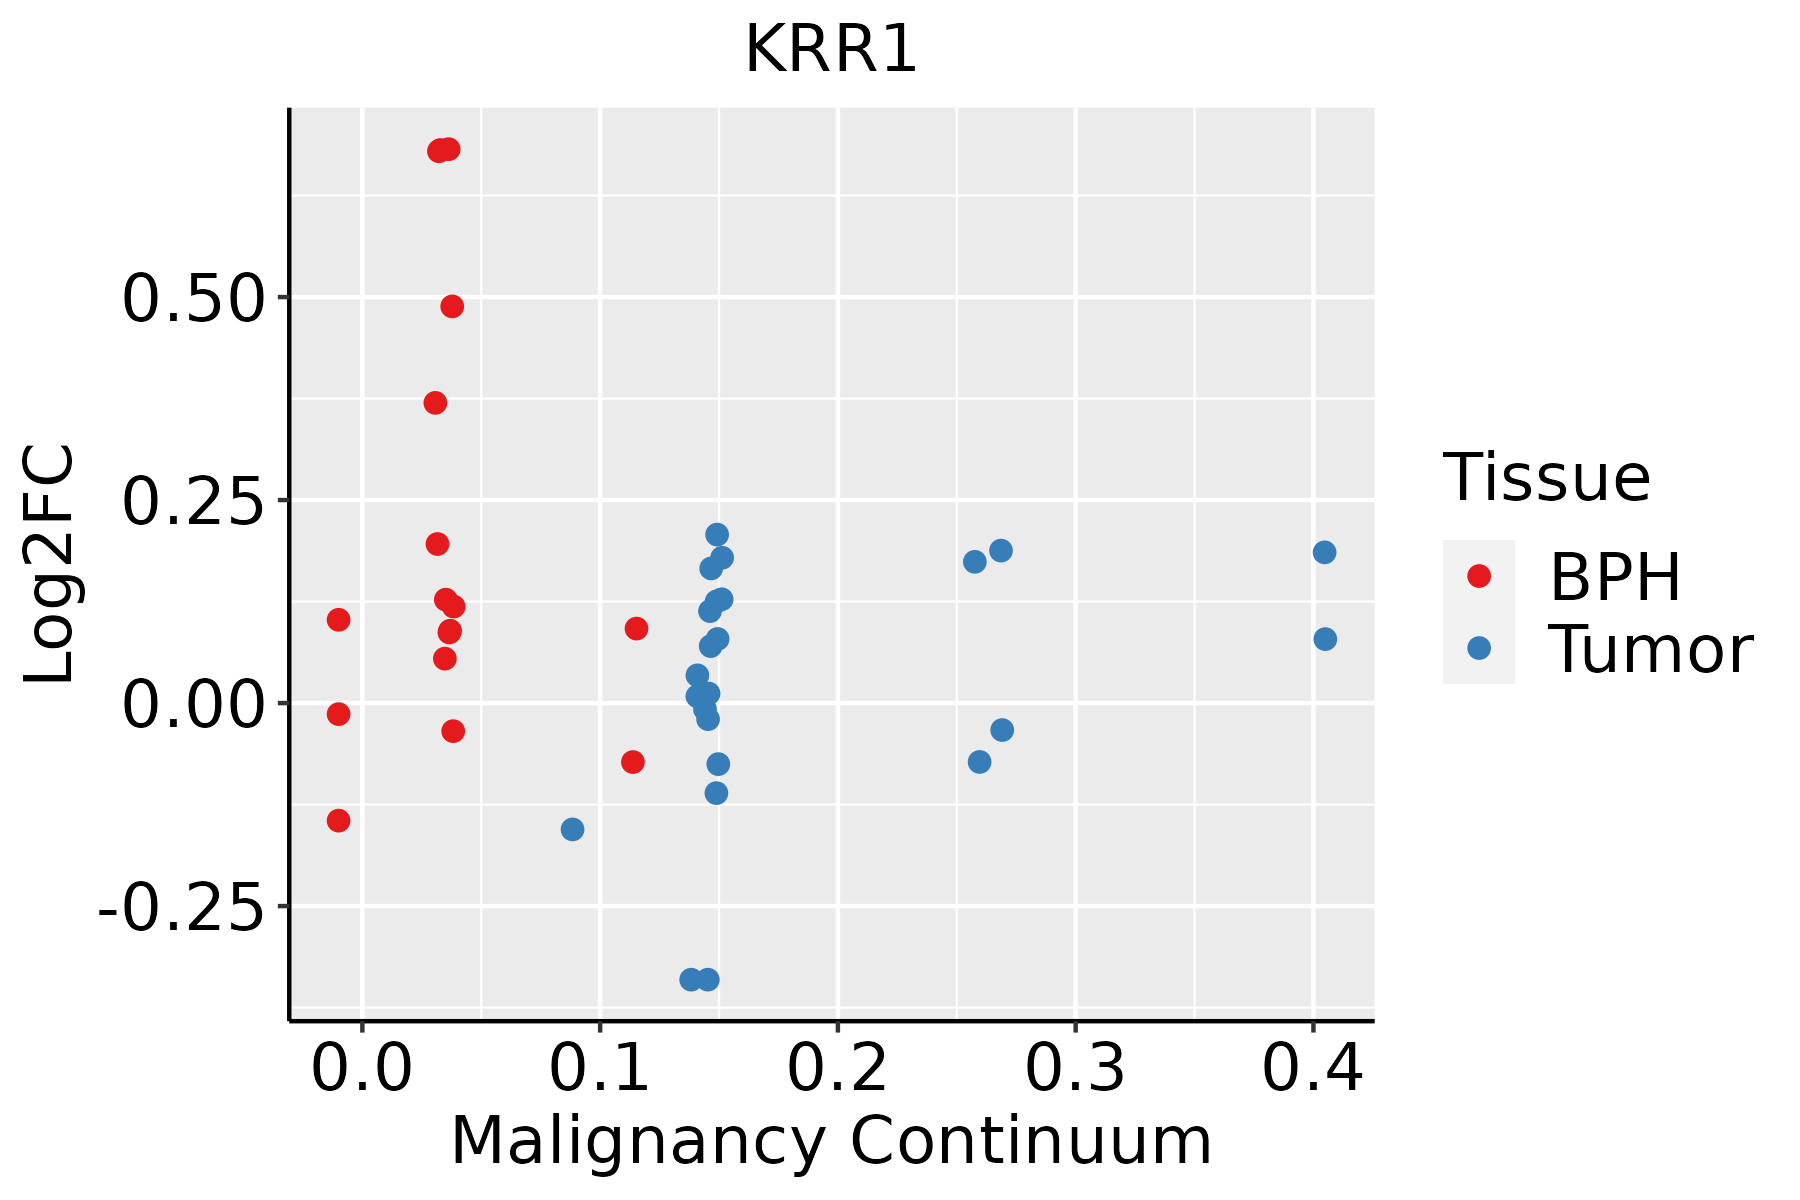 | BPH: Benign Prostatic Hyperplasia |
| Skin | 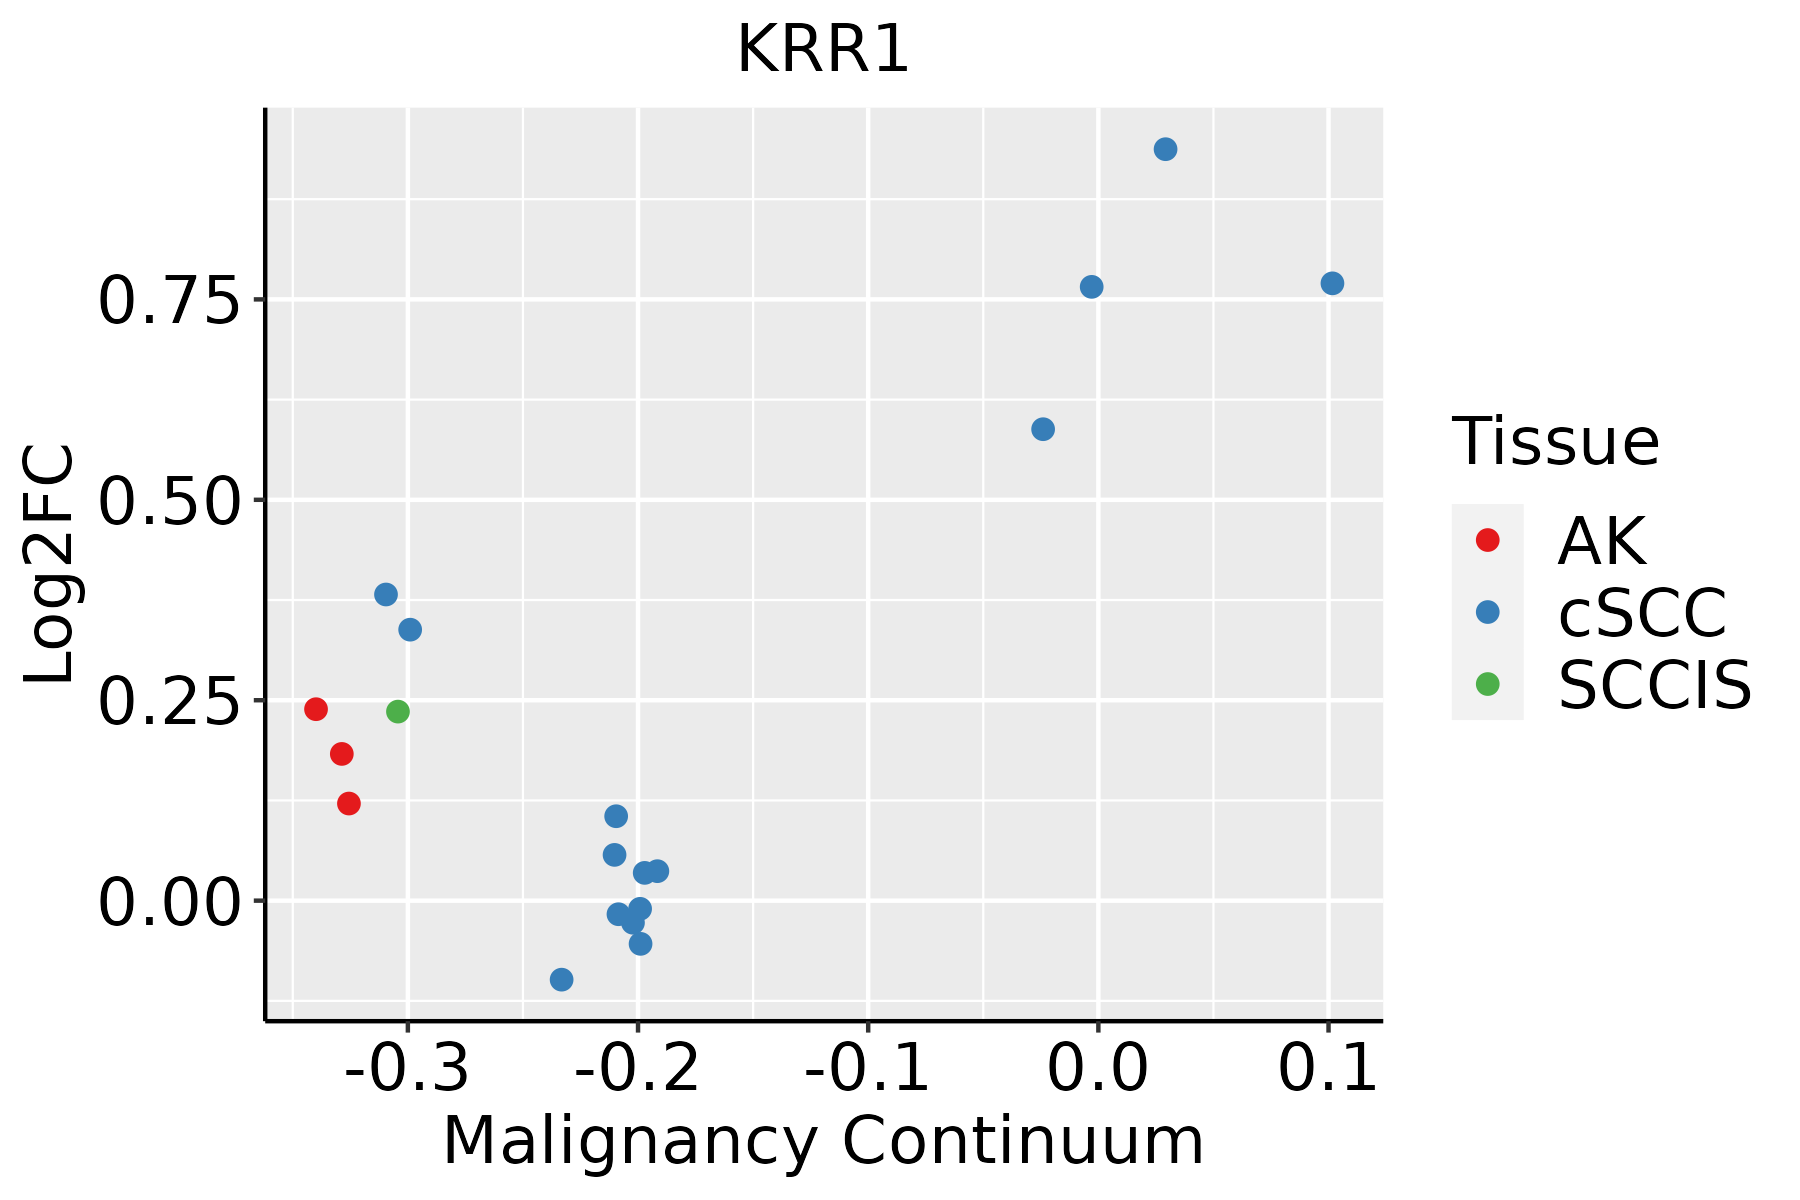 | AK: Actinic keratosis |
| cSCC: Cutaneous squamous cell carcinoma | ||
| SCCIS:squamous cell carcinoma in situ | ||
| Thyroid |  | ATC: Anaplastic thyroid cancer |
| HT: Hashimoto's thyroiditis | ||
| PTC: Papillary thyroid cancer |
| ∗log2FC in expression of this searched gene in stem-like cells from each diseased tissue sample relative to stem-like cells in normal samples in each tissue plotted against the malignancy continuum. Samples are colored based on if they are from different disease stage. |
Top |
Malignant transformation related pathway analysis |
| Find out the enriched GO biological processes and KEGG pathways involved in transition from healthy to precancer to cancer |
| Tissue | Disease Stage | Enriched GO biological Processes |
| Colorectum | AD |  |
| Colorectum | SER |  |
| Colorectum | MSS |  |
| Colorectum | MSI-H |  |
| Colorectum | FAP |  |
| ∗Top 15 enriched GO BP terms are showed in the bar plot of each disease state in each tissue. Each row represents a significant GO biological process which is colored according to the -log10(p.adjust). |
| Page: 1 2 3 4 5 6 7 8 9 |
| GO ID | Tissue | Disease Stage | Description | Gene Ratio | Bg Ratio | pvalue | p.adjust | Count |
| GO:0022613111 | Esophagus | ESCC | ribonucleoprotein complex biogenesis | 365/8552 | 463/18723 | 1.74e-49 | 1.11e-45 | 365 |
| GO:0042254111 | Esophagus | ESCC | ribosome biogenesis | 252/8552 | 299/18723 | 3.27e-44 | 1.04e-40 | 252 |
| GO:003447015 | Esophagus | ESCC | ncRNA processing | 300/8552 | 395/18723 | 3.09e-35 | 3.26e-32 | 300 |
| GO:0016072110 | Esophagus | ESCC | rRNA metabolic process | 197/8552 | 236/18723 | 1.31e-33 | 1.18e-30 | 197 |
| GO:0006364110 | Esophagus | ESCC | rRNA processing | 189/8552 | 225/18723 | 4.88e-33 | 3.87e-30 | 189 |
| GO:003466012 | Esophagus | ESCC | ncRNA metabolic process | 346/8552 | 485/18723 | 4.35e-31 | 2.51e-28 | 346 |
| GO:002261312 | Liver | Cirrhotic | ribonucleoprotein complex biogenesis | 231/4634 | 463/18723 | 3.28e-32 | 6.86e-29 | 231 |
| GO:004225412 | Liver | Cirrhotic | ribosome biogenesis | 154/4634 | 299/18723 | 1.18e-23 | 6.72e-21 | 154 |
| GO:000636412 | Liver | Cirrhotic | rRNA processing | 115/4634 | 225/18723 | 1.12e-17 | 1.64e-15 | 115 |
| GO:00160724 | Liver | Cirrhotic | rRNA metabolic process | 119/4634 | 236/18723 | 1.19e-17 | 1.70e-15 | 119 |
| GO:00344701 | Liver | Cirrhotic | ncRNA processing | 158/4634 | 395/18723 | 1.09e-11 | 6.96e-10 | 158 |
| GO:00346603 | Liver | Cirrhotic | ncRNA metabolic process | 173/4634 | 485/18723 | 3.64e-08 | 1.21e-06 | 173 |
| GO:002261322 | Liver | HCC | ribonucleoprotein complex biogenesis | 355/7958 | 463/18723 | 7.76e-52 | 4.92e-48 | 355 |
| GO:004225422 | Liver | HCC | ribosome biogenesis | 246/7958 | 299/18723 | 4.99e-46 | 1.58e-42 | 246 |
| GO:00344702 | Liver | HCC | ncRNA processing | 293/7958 | 395/18723 | 4.26e-38 | 6.76e-35 | 293 |
| GO:001607212 | Liver | HCC | rRNA metabolic process | 193/7958 | 236/18723 | 1.26e-35 | 1.14e-32 | 193 |
| GO:000636421 | Liver | HCC | rRNA processing | 185/7958 | 225/18723 | 8.14e-35 | 6.45e-32 | 185 |
| GO:00346601 | Liver | HCC | ncRNA metabolic process | 332/7958 | 485/18723 | 1.48e-31 | 7.80e-29 | 332 |
| GO:002261320 | Oral cavity | OSCC | ribonucleoprotein complex biogenesis | 333/7305 | 463/18723 | 8.28e-48 | 5.24e-44 | 333 |
| GO:004225420 | Oral cavity | OSCC | ribosome biogenesis | 230/7305 | 299/18723 | 3.22e-41 | 6.80e-38 | 230 |
| Page: 1 2 3 4 |
| Pathway ID | Tissue | Disease Stage | Description | Gene Ratio | Bg Ratio | pvalue | p.adjust | qvalue | Count |
| Page: 1 |
Top |
Cell-cell communication analysis |
| Identification of potential cell-cell interactions between two cell types and their ligand-receptor pairs for different disease states |
| Ligand | Receptor | LRpair | Pathway | Tissue | Disease Stage |
| Page: 1 |
Top |
Single-cell gene regulatory network inference analysis |
| Find out the significant the regulons (TFs) and the target genes of each regulon across cell types for different disease states |
| TF | Cell Type | Tissue | Disease Stage | Target Gene | RSS | Regulon Activity |
| ∗The dot plots of a searched regulon are shown for all cell subpopulations in each disease state of each tissue based on the regulon specific score inferred using pySCENIC and by calculating the average expression. |
| Page: 1 |
Top |
Somatic mutation of malignant transformation related genes |
| Annotation of somatic variants for genes involved in malignant transformation |
| Hugo Symbol | Variant Class | Variant Classification | dbSNP RS | HGVSc | HGVSp | HGVSp Short | SWISSPROT | BIOTYPE | SIFT | PolyPhen | Tumor Sample Barcode | Tissue | Histology | Sex | Age | Stage | Therapy Types | Drugs | Outcome |
| KRR1 | SNV | Missense_Mutation | rs375387200 | c.104N>T | p.Thr35Met | p.T35M | Q13601 | protein_coding | deleterious(0.02) | possibly_damaging(0.773) | TCGA-A6-6781-01 | Colorectum | colon adenocarcinoma | Male | <65 | III/IV | Chemotherapy | oxaliplatin | SD |
| KRR1 | SNV | Missense_Mutation | rs368830982 | c.760C>T | p.Arg254Cys | p.R254C | Q13601 | protein_coding | deleterious(0) | benign(0.017) | TCGA-CM-5861-01 | Colorectum | colon adenocarcinoma | Female | <65 | I/II | Unknown | Unknown | PD |
| KRR1 | SNV | Missense_Mutation | novel | c.691N>T | p.Asp231Tyr | p.D231Y | Q13601 | protein_coding | deleterious(0) | probably_damaging(0.996) | TCGA-AG-A002-01 | Colorectum | rectum adenocarcinoma | Male | <65 | I/II | Unknown | Unknown | SD |
| KRR1 | SNV | Missense_Mutation | novel | c.691G>T | p.Asp231Tyr | p.D231Y | Q13601 | protein_coding | deleterious(0) | probably_damaging(0.996) | TCGA-EI-6917-01 | Colorectum | rectum adenocarcinoma | Male | <65 | III/IV | Chemotherapy | 5fluorouracil+oxaciplatina+l-folinian | SD |
| KRR1 | insertion | Frame_Shift_Ins | novel | c.781_782insA | p.Thr261AsnfsTer3 | p.T261Nfs*3 | Q13601 | protein_coding | TCGA-AA-A022-01 | Colorectum | colon adenocarcinoma | Female | >=65 | I/II | Unknown | Unknown | SD | ||
| KRR1 | SNV | Missense_Mutation | rs751449948 | c.1062N>T | p.Lys354Asn | p.K354N | Q13601 | protein_coding | deleterious(0.04) | possibly_damaging(0.687) | TCGA-A5-A2K5-01 | Endometrium | uterine corpus endometrioid carcinoma | Female | >=65 | I/II | Unknown | Unknown | SD |
| KRR1 | SNV | Missense_Mutation | novel | c.250N>C | p.Asn84His | p.N84H | Q13601 | protein_coding | tolerated(0.06) | benign(0.003) | TCGA-A5-A2K5-01 | Endometrium | uterine corpus endometrioid carcinoma | Female | >=65 | I/II | Unknown | Unknown | SD |
| KRR1 | SNV | Missense_Mutation | novel | c.1056A>C | p.Lys352Asn | p.K352N | Q13601 | protein_coding | tolerated(0.09) | benign(0.003) | TCGA-AP-A1DV-01 | Endometrium | uterine corpus endometrioid carcinoma | Female | <65 | I/II | Unknown | Unknown | SD |
| KRR1 | SNV | Missense_Mutation | novel | c.352N>T | p.Asp118Tyr | p.D118Y | Q13601 | protein_coding | deleterious(0) | probably_damaging(0.987) | TCGA-AX-A05Z-01 | Endometrium | uterine corpus endometrioid carcinoma | Female | <65 | III/IV | Chemotherapy | adriamycin | SD |
| KRR1 | SNV | Missense_Mutation | rs751449948 | c.1062N>T | p.Lys354Asn | p.K354N | Q13601 | protein_coding | deleterious(0.04) | possibly_damaging(0.687) | TCGA-AX-A0J0-01 | Endometrium | uterine corpus endometrioid carcinoma | Female | <65 | I/II | Unknown | Unknown | SD |
| Page: 1 2 3 4 |
Top |
Related drugs of malignant transformation related genes |
| Identification of chemicals and drugs interact with genes involved in malignant transfromation |
| (DGIdb 4.0) |
| Entrez ID | Symbol | Category | Interaction Types | Drug Claim Name | Drug Name | PMIDs |
| Page: 1 |

Copyright 2023-Present -The University of Texas Health Science Center at Houston |