
|
|||||
|
 | |
| |
| |
| |
| |
| |
|
Gene: KRIT1 |
Gene summary for KRIT1 |
| Gene information | Species | Human | Gene symbol | KRIT1 | Gene ID | 889 |
| Gene name | KRIT1 ankyrin repeat containing | |
| Gene Alias | CAM | |
| Cytomap | 7q21.2 | |
| Gene Type | protein-coding | GO ID | GO:0001525 | UniProtAcc | O00522 |
Top |
Malignant transformation analysis |
| Identification of the aberrant gene expression in precancerous and cancerous lesions by comparing the gene expression of stem-like cells in diseased tissues with normal stem cells |
| Entrez ID | Symbol | Replicates | Species | Organ | Tissue | Adj P-value | Log2FC | Malignancy |
| 889 | KRIT1 | LZE2T | Human | Esophagus | ESCC | 3.08e-05 | 6.55e-01 | 0.082 |
| 889 | KRIT1 | LZE4T | Human | Esophagus | ESCC | 3.10e-12 | 4.17e-01 | 0.0811 |
| 889 | KRIT1 | LZE7T | Human | Esophagus | ESCC | 4.93e-07 | 4.51e-01 | 0.0667 |
| 889 | KRIT1 | LZE8T | Human | Esophagus | ESCC | 2.61e-10 | 3.16e-01 | 0.067 |
| 889 | KRIT1 | LZE20T | Human | Esophagus | ESCC | 1.15e-20 | 5.69e-01 | 0.0662 |
| 889 | KRIT1 | LZE22T | Human | Esophagus | ESCC | 4.11e-07 | 5.21e-01 | 0.068 |
| 889 | KRIT1 | LZE24T | Human | Esophagus | ESCC | 1.64e-18 | 4.66e-01 | 0.0596 |
| 889 | KRIT1 | LZE6T | Human | Esophagus | ESCC | 9.85e-05 | 2.70e-01 | 0.0845 |
| 889 | KRIT1 | P1T-E | Human | Esophagus | ESCC | 5.04e-15 | 6.43e-01 | 0.0875 |
| 889 | KRIT1 | P2T-E | Human | Esophagus | ESCC | 5.09e-60 | 9.26e-01 | 0.1177 |
| 889 | KRIT1 | P4T-E | Human | Esophagus | ESCC | 4.83e-35 | 8.78e-01 | 0.1323 |
| 889 | KRIT1 | P5T-E | Human | Esophagus | ESCC | 9.85e-21 | 3.95e-01 | 0.1327 |
| 889 | KRIT1 | P8T-E | Human | Esophagus | ESCC | 3.21e-39 | 6.47e-01 | 0.0889 |
| 889 | KRIT1 | P9T-E | Human | Esophagus | ESCC | 4.12e-26 | 5.57e-01 | 0.1131 |
| 889 | KRIT1 | P10T-E | Human | Esophagus | ESCC | 2.68e-37 | 7.07e-01 | 0.116 |
| 889 | KRIT1 | P11T-E | Human | Esophagus | ESCC | 6.44e-24 | 6.96e-01 | 0.1426 |
| 889 | KRIT1 | P12T-E | Human | Esophagus | ESCC | 3.26e-48 | 8.62e-01 | 0.1122 |
| 889 | KRIT1 | P15T-E | Human | Esophagus | ESCC | 4.35e-39 | 8.18e-01 | 0.1149 |
| 889 | KRIT1 | P16T-E | Human | Esophagus | ESCC | 5.12e-81 | 1.65e+00 | 0.1153 |
| 889 | KRIT1 | P17T-E | Human | Esophagus | ESCC | 8.78e-08 | 4.29e-01 | 0.1278 |
| Page: 1 2 3 4 5 6 7 |
| Tissue | Expression Dynamics | Abbreviation |
| Esophagus | 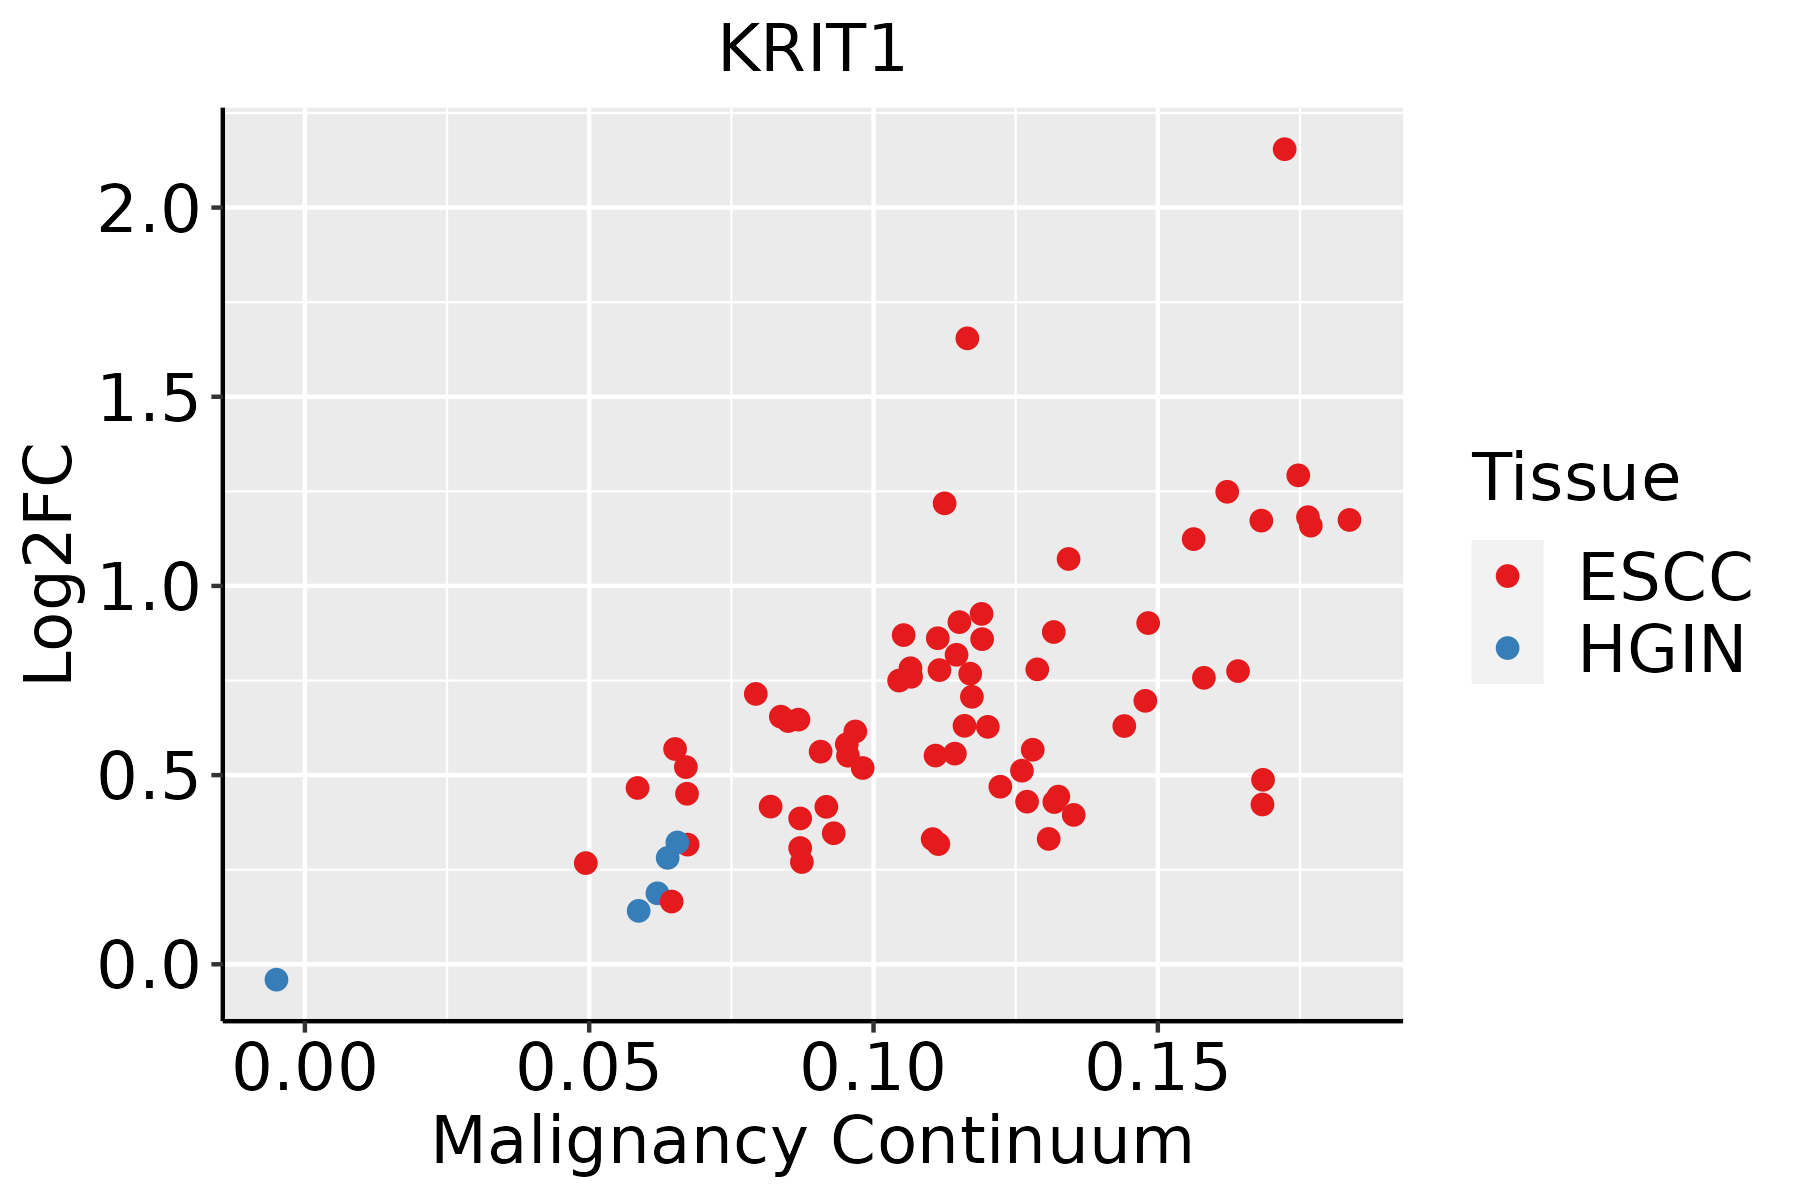 | ESCC: Esophageal squamous cell carcinoma |
| HGIN: High-grade intraepithelial neoplasias | ||
| LGIN: Low-grade intraepithelial neoplasias | ||
| Liver | 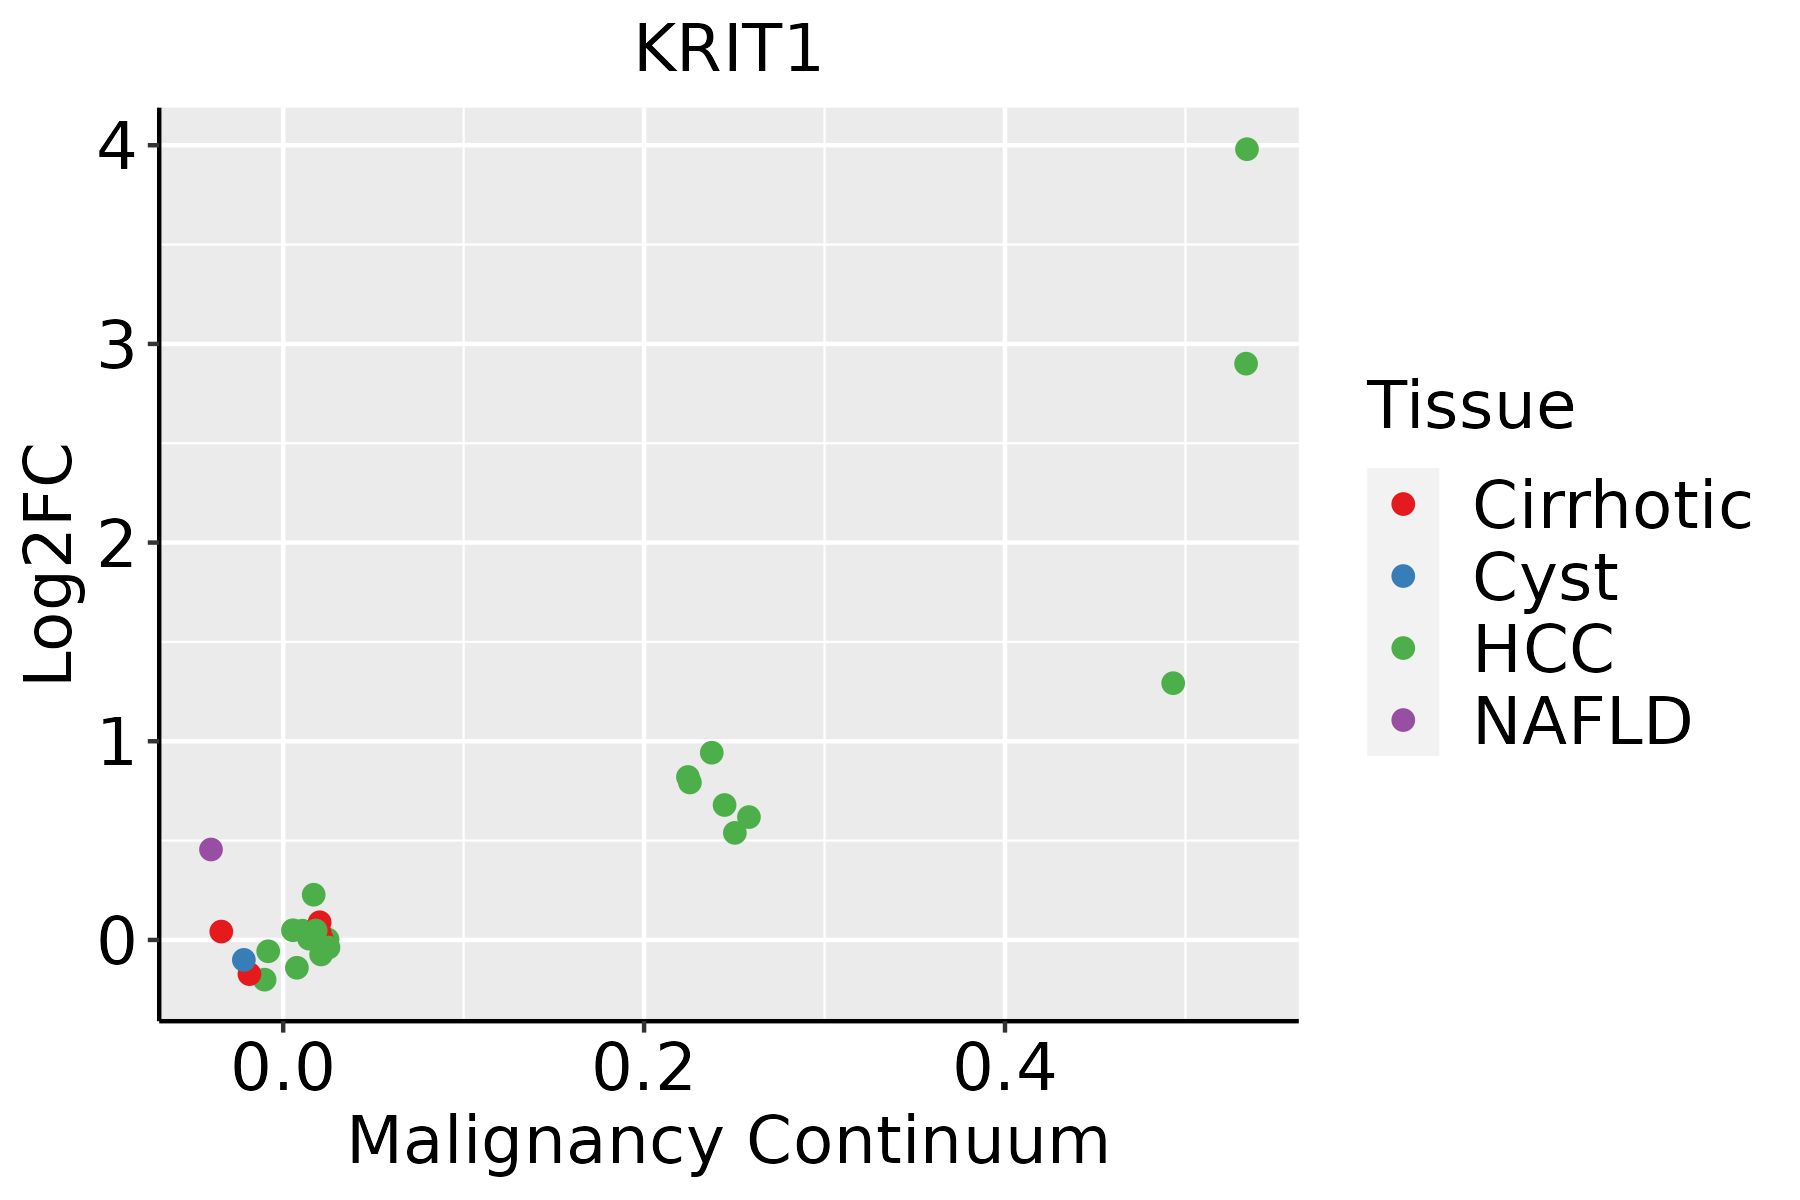 | HCC: Hepatocellular carcinoma |
| NAFLD: Non-alcoholic fatty liver disease | ||
| Lung | 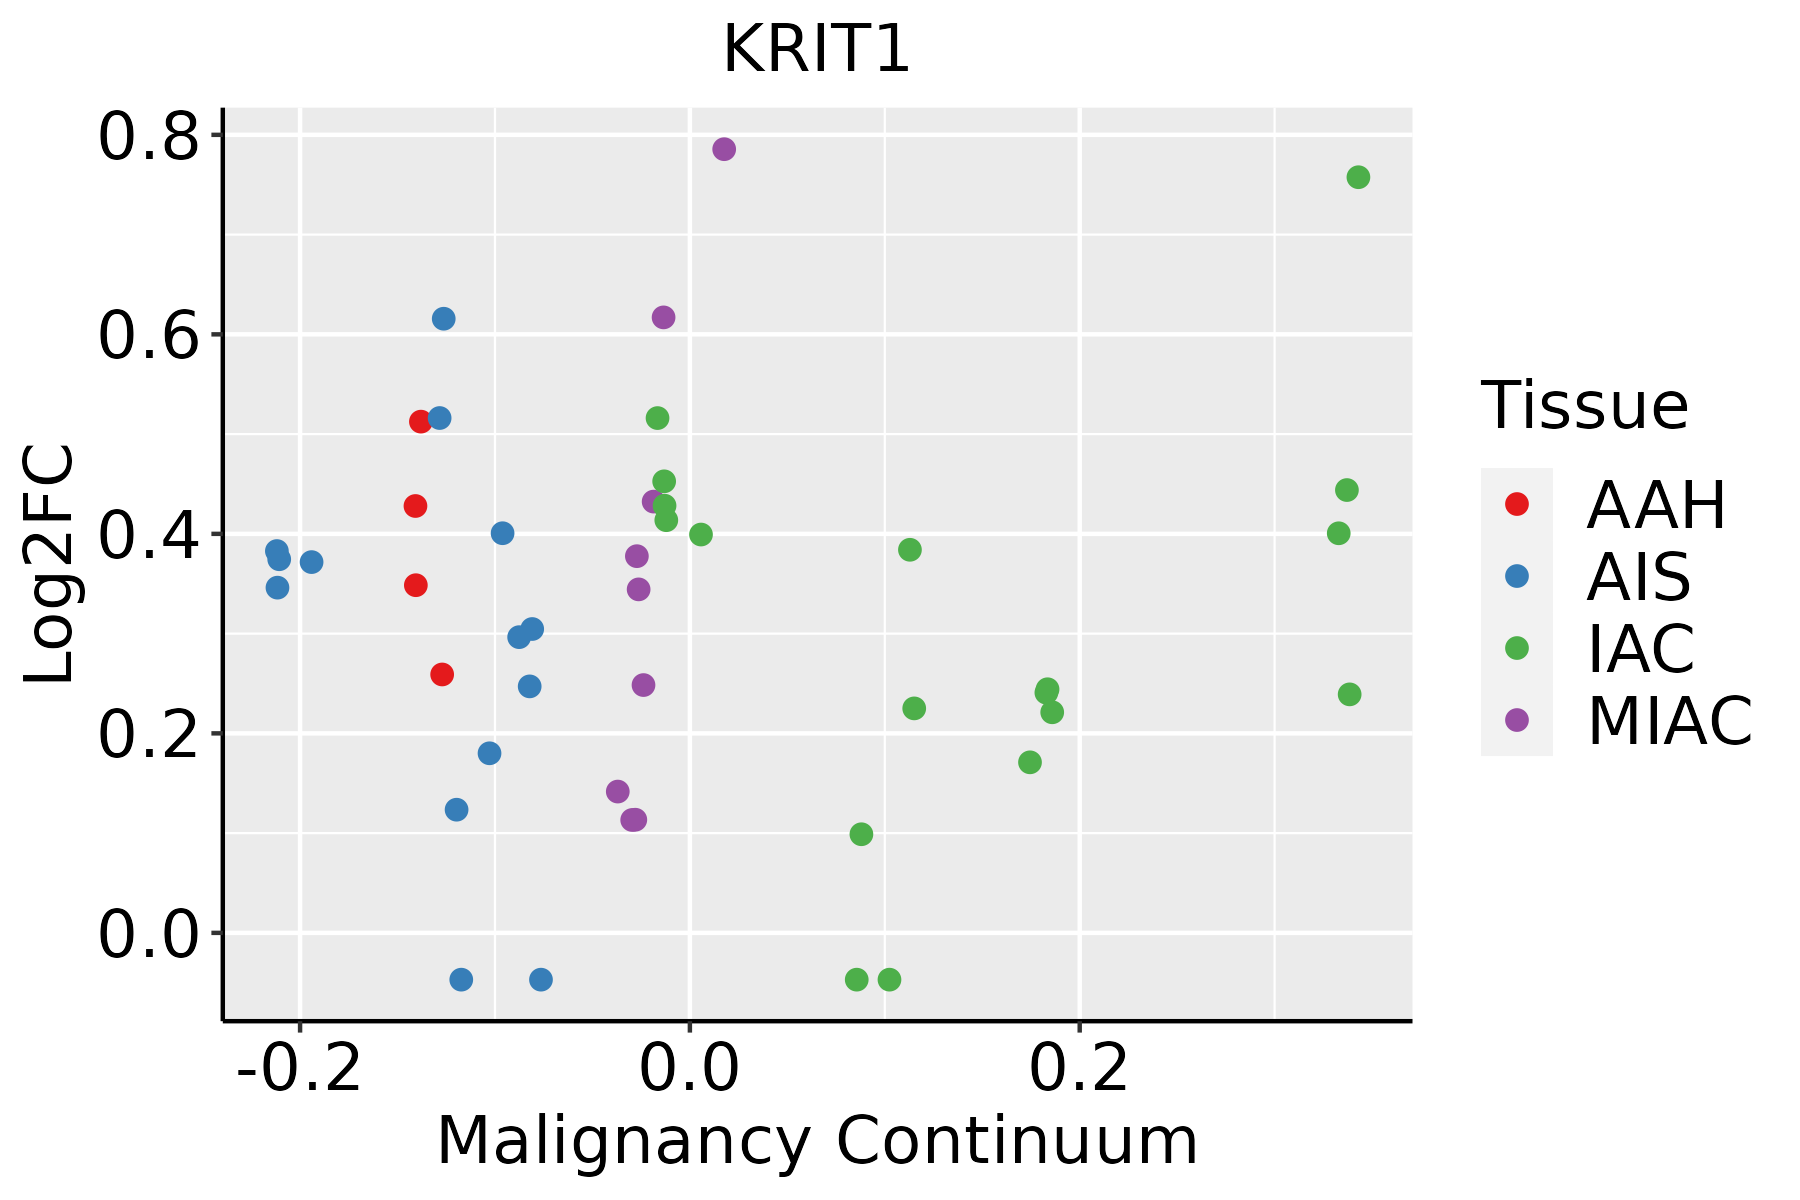 | AAH: Atypical adenomatous hyperplasia |
| AIS: Adenocarcinoma in situ | ||
| IAC: Invasive lung adenocarcinoma | ||
| MIA: Minimally invasive adenocarcinoma | ||
| Oral Cavity |  | EOLP: Erosive Oral lichen planus |
| LP: leukoplakia | ||
| NEOLP: Non-erosive oral lichen planus | ||
| OSCC: Oral squamous cell carcinoma | ||
| Skin | 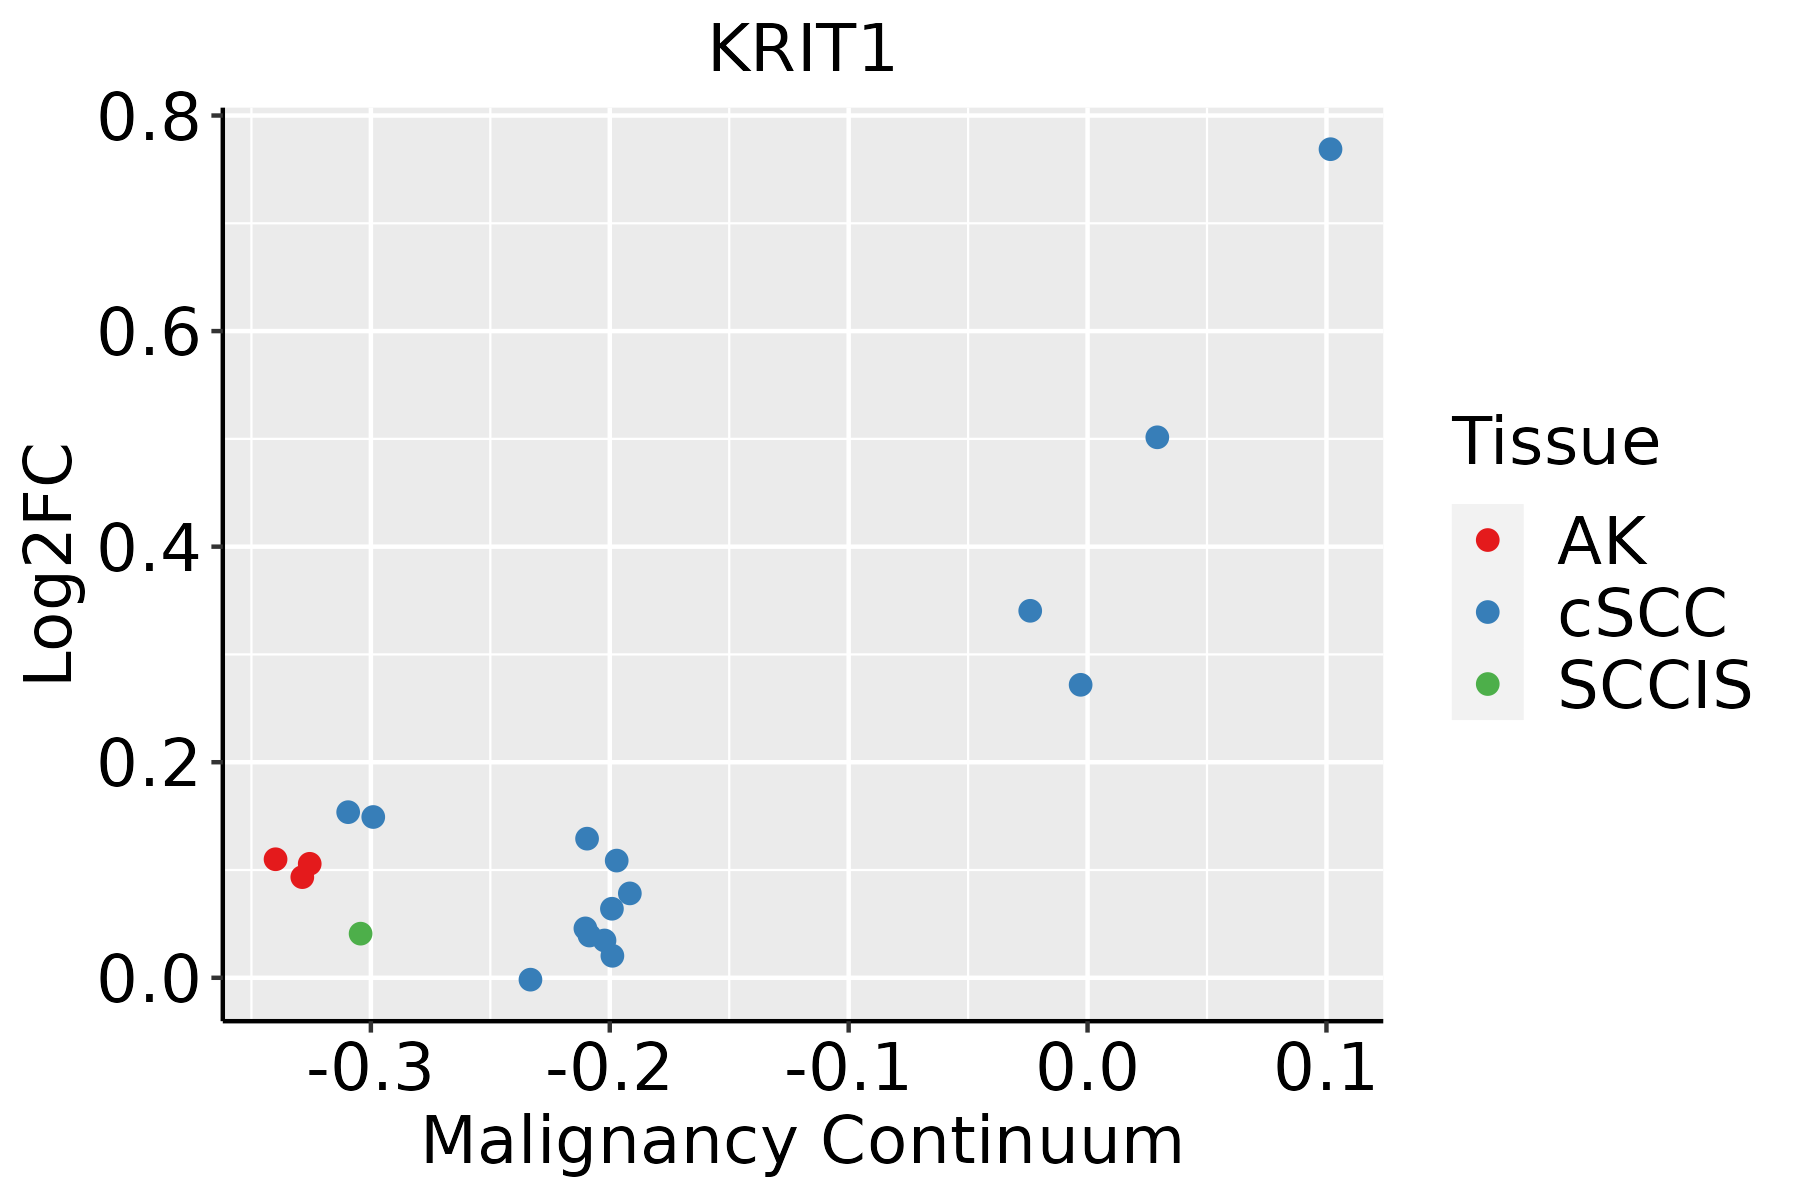 | AK: Actinic keratosis |
| cSCC: Cutaneous squamous cell carcinoma | ||
| SCCIS:squamous cell carcinoma in situ | ||
| Thyroid |  | ATC: Anaplastic thyroid cancer |
| HT: Hashimoto's thyroiditis | ||
| PTC: Papillary thyroid cancer |
| ∗log2FC in expression of this searched gene in stem-like cells from each diseased tissue sample relative to stem-like cells in normal samples in each tissue plotted against the malignancy continuum. Samples are colored based on if they are from different disease stage. |
Top |
Malignant transformation related pathway analysis |
| Find out the enriched GO biological processes and KEGG pathways involved in transition from healthy to precancer to cancer |
| Tissue | Disease Stage | Enriched GO biological Processes |
| Colorectum | AD |  |
| Colorectum | SER |  |
| Colorectum | MSS |  |
| Colorectum | MSI-H |  |
| Colorectum | FAP |  |
| ∗Top 15 enriched GO BP terms are showed in the bar plot of each disease state in each tissue. Each row represents a significant GO biological process which is colored according to the -log10(p.adjust). |
| Page: 1 2 3 4 5 6 7 8 9 |
| GO ID | Tissue | Disease Stage | Description | Gene Ratio | Bg Ratio | pvalue | p.adjust | Count |
| GO:000716320 | Esophagus | ESCC | establishment or maintenance of cell polarity | 143/8552 | 218/18723 | 2.05e-09 | 4.65e-08 | 143 |
| GO:003001018 | Esophagus | ESCC | establishment of cell polarity | 96/8552 | 143/18723 | 1.69e-07 | 2.67e-06 | 96 |
| GO:004545419 | Esophagus | ESCC | cell redox homeostasis | 29/8552 | 35/18723 | 6.61e-06 | 6.75e-05 | 29 |
| GO:005067318 | Esophagus | ESCC | epithelial cell proliferation | 238/8552 | 437/18723 | 1.19e-04 | 8.20e-04 | 238 |
| GO:005067817 | Esophagus | ESCC | regulation of epithelial cell proliferation | 206/8552 | 381/18723 | 5.51e-04 | 3.02e-03 | 206 |
| GO:000166720 | Esophagus | ESCC | ameboidal-type cell migration | 250/8552 | 475/18723 | 1.22e-03 | 5.97e-03 | 250 |
| GO:001063120 | Esophagus | ESCC | epithelial cell migration | 187/8552 | 357/18723 | 6.05e-03 | 2.23e-02 | 187 |
| GO:009013220 | Esophagus | ESCC | epithelium migration | 188/8552 | 360/18723 | 6.96e-03 | 2.54e-02 | 188 |
| GO:009013020 | Esophagus | ESCC | tissue migration | 190/8552 | 365/18723 | 7.91e-03 | 2.82e-02 | 190 |
| GO:19040197 | Esophagus | ESCC | epithelial cell apoptotic process | 68/8552 | 121/18723 | 1.27e-02 | 4.21e-02 | 68 |
| GO:00071636 | Liver | NAFLD | establishment or maintenance of cell polarity | 46/1882 | 218/18723 | 8.80e-07 | 4.60e-05 | 46 |
| GO:00300106 | Liver | NAFLD | establishment of cell polarity | 34/1882 | 143/18723 | 1.41e-06 | 6.56e-05 | 34 |
| GO:20001145 | Liver | NAFLD | regulation of establishment of cell polarity | 11/1882 | 22/18723 | 2.54e-06 | 1.06e-04 | 11 |
| GO:00328784 | Liver | NAFLD | regulation of establishment or maintenance of cell polarity | 11/1882 | 25/18723 | 1.20e-05 | 3.69e-04 | 11 |
| GO:1904019 | Liver | NAFLD | epithelial cell apoptotic process | 24/1882 | 121/18723 | 8.75e-04 | 1.07e-02 | 24 |
| GO:1904036 | Liver | NAFLD | negative regulation of epithelial cell apoptotic process | 12/1882 | 50/18723 | 3.32e-03 | 2.93e-02 | 12 |
| GO:00016676 | Liver | NAFLD | ameboidal-type cell migration | 65/1882 | 475/18723 | 6.32e-03 | 4.69e-02 | 65 |
| GO:000716312 | Liver | Cirrhotic | establishment or maintenance of cell polarity | 82/4634 | 218/18723 | 1.55e-05 | 2.11e-04 | 82 |
| GO:000166712 | Liver | Cirrhotic | ameboidal-type cell migration | 145/4634 | 475/18723 | 2.23e-03 | 1.36e-02 | 145 |
| GO:200011411 | Liver | Cirrhotic | regulation of establishment of cell polarity | 12/4634 | 22/18723 | 2.61e-03 | 1.53e-02 | 12 |
| Page: 1 2 3 4 5 6 |
| Pathway ID | Tissue | Disease Stage | Description | Gene Ratio | Bg Ratio | pvalue | p.adjust | qvalue | Count |
| hsa0452030 | Esophagus | ESCC | Adherens junction | 69/4205 | 93/8465 | 1.08e-06 | 6.83e-06 | 3.50e-06 | 69 |
| hsa04520114 | Esophagus | ESCC | Adherens junction | 69/4205 | 93/8465 | 1.08e-06 | 6.83e-06 | 3.50e-06 | 69 |
| hsa0452014 | Liver | NAFLD | Adherens junction | 37/1043 | 93/8465 | 1.50e-11 | 1.64e-09 | 1.32e-09 | 37 |
| hsa0452015 | Liver | NAFLD | Adherens junction | 37/1043 | 93/8465 | 1.50e-11 | 1.64e-09 | 1.32e-09 | 37 |
| hsa0452022 | Liver | Cirrhotic | Adherens junction | 52/2530 | 93/8465 | 1.36e-07 | 1.97e-06 | 1.21e-06 | 52 |
| hsa0452032 | Liver | Cirrhotic | Adherens junction | 52/2530 | 93/8465 | 1.36e-07 | 1.97e-06 | 1.21e-06 | 52 |
| hsa0452042 | Liver | HCC | Adherens junction | 68/4020 | 93/8465 | 3.99e-07 | 4.46e-06 | 2.48e-06 | 68 |
| hsa0452052 | Liver | HCC | Adherens junction | 68/4020 | 93/8465 | 3.99e-07 | 4.46e-06 | 2.48e-06 | 68 |
| hsa0452016 | Lung | IAC | Adherens junction | 37/1053 | 93/8465 | 1.99e-11 | 2.16e-09 | 1.43e-09 | 37 |
| hsa0401510 | Lung | IAC | Rap1 signaling pathway | 41/1053 | 210/8465 | 2.01e-03 | 1.07e-02 | 7.10e-03 | 41 |
| hsa0452017 | Lung | IAC | Adherens junction | 37/1053 | 93/8465 | 1.99e-11 | 2.16e-09 | 1.43e-09 | 37 |
| hsa0401511 | Lung | IAC | Rap1 signaling pathway | 41/1053 | 210/8465 | 2.01e-03 | 1.07e-02 | 7.10e-03 | 41 |
| hsa0452023 | Lung | AIS | Adherens junction | 34/961 | 93/8465 | 1.59e-10 | 1.29e-08 | 8.26e-09 | 34 |
| hsa0401521 | Lung | AIS | Rap1 signaling pathway | 41/961 | 210/8465 | 3.23e-04 | 3.38e-03 | 2.16e-03 | 41 |
| hsa0452033 | Lung | AIS | Adherens junction | 34/961 | 93/8465 | 1.59e-10 | 1.29e-08 | 8.26e-09 | 34 |
| hsa0401531 | Lung | AIS | Rap1 signaling pathway | 41/961 | 210/8465 | 3.23e-04 | 3.38e-03 | 2.16e-03 | 41 |
| hsa0452029 | Oral cavity | OSCC | Adherens junction | 62/3704 | 93/8465 | 6.34e-06 | 3.12e-05 | 1.59e-05 | 62 |
| hsa0401518 | Oral cavity | OSCC | Rap1 signaling pathway | 107/3704 | 210/8465 | 2.01e-02 | 4.34e-02 | 2.21e-02 | 107 |
| hsa04520113 | Oral cavity | OSCC | Adherens junction | 62/3704 | 93/8465 | 6.34e-06 | 3.12e-05 | 1.59e-05 | 62 |
| hsa0401519 | Oral cavity | OSCC | Rap1 signaling pathway | 107/3704 | 210/8465 | 2.01e-02 | 4.34e-02 | 2.21e-02 | 107 |
| Page: 1 |
Top |
Cell-cell communication analysis |
| Identification of potential cell-cell interactions between two cell types and their ligand-receptor pairs for different disease states |
| Ligand | Receptor | LRpair | Pathway | Tissue | Disease Stage |
| Page: 1 |
Top |
Single-cell gene regulatory network inference analysis |
| Find out the significant the regulons (TFs) and the target genes of each regulon across cell types for different disease states |
| TF | Cell Type | Tissue | Disease Stage | Target Gene | RSS | Regulon Activity |
| ∗The dot plots of a searched regulon are shown for all cell subpopulations in each disease state of each tissue based on the regulon specific score inferred using pySCENIC and by calculating the average expression. |
| Page: 1 |
Top |
Somatic mutation of malignant transformation related genes |
| Annotation of somatic variants for genes involved in malignant transformation |
| Hugo Symbol | Variant Class | Variant Classification | dbSNP RS | HGVSc | HGVSp | HGVSp Short | SWISSPROT | BIOTYPE | SIFT | PolyPhen | Tumor Sample Barcode | Tissue | Histology | Sex | Age | Stage | Therapy Types | Drugs | Outcome |
| KRIT1 | SNV | Missense_Mutation | novel | c.1277N>A | p.Arg426Lys | p.R426K | O00522 | protein_coding | tolerated(0.85) | possibly_damaging(0.867) | TCGA-A2-A0CT-01 | Breast | breast invasive carcinoma | Female | >=65 | I/II | Chemotherapy | cytoxan | SD |
| KRIT1 | SNV | Missense_Mutation | c.816G>C | p.Gln272His | p.Q272H | O00522 | protein_coding | tolerated(0.38) | possibly_damaging(0.804) | TCGA-A2-A0YK-01 | Breast | breast invasive carcinoma | Female | <65 | I/II | Chemotherapy | cytoxan | SD | |
| KRIT1 | SNV | Missense_Mutation | novel | c.1277G>T | p.Arg426Ile | p.R426I | O00522 | protein_coding | tolerated(0.06) | probably_damaging(0.974) | TCGA-AN-A046-01 | Breast | breast invasive carcinoma | Female | >=65 | I/II | Unknown | Unknown | SD |
| KRIT1 | SNV | Missense_Mutation | c.1631N>T | p.Tyr544Phe | p.Y544F | O00522 | protein_coding | tolerated(0.21) | benign(0.007) | TCGA-AN-A0FX-01 | Breast | breast invasive carcinoma | Female | <65 | I/II | Unknown | Unknown | SD | |
| KRIT1 | SNV | Missense_Mutation | c.2051G>A | p.Gly684Asp | p.G684D | O00522 | protein_coding | tolerated(0.26) | possibly_damaging(0.563) | TCGA-BH-A0BP-01 | Breast | breast invasive carcinoma | Female | >=65 | I/II | Unknown | Unknown | SD | |
| KRIT1 | SNV | Missense_Mutation | rs747422648 | c.769G>A | p.Ala257Thr | p.A257T | O00522 | protein_coding | tolerated(0.45) | probably_damaging(0.98) | TCGA-BH-A0HF-01 | Breast | breast invasive carcinoma | Female | >=65 | I/II | Hormone Therapy | arimidex | SD |
| KRIT1 | SNV | Missense_Mutation | c.1145N>C | p.Arg382Thr | p.R382T | O00522 | protein_coding | tolerated(0.15) | probably_damaging(0.942) | TCGA-BH-A0W7-01 | Breast | breast invasive carcinoma | Female | <65 | I/II | Chemotherapy | taxotere | CR | |
| KRIT1 | SNV | Missense_Mutation | c.544N>G | p.Pro182Ala | p.P182A | O00522 | protein_coding | tolerated(0.83) | probably_damaging(0.98) | TCGA-D8-A1JA-01 | Breast | breast invasive carcinoma | Female | <65 | III/IV | Chemotherapy | adriamycin | PD | |
| KRIT1 | SNV | Missense_Mutation | c.629N>G | p.Tyr210Cys | p.Y210C | O00522 | protein_coding | tolerated(0.14) | probably_damaging(0.993) | TCGA-E9-A22E-01 | Breast | breast invasive carcinoma | Female | <65 | III/IV | Chemotherapy | cyclophosphane | SD | |
| KRIT1 | insertion | Nonsense_Mutation | novel | c.6_7insTGAT | p.Asn3Ter | p.N3* | O00522 | protein_coding | TCGA-AC-A3QQ-01 | Breast | breast invasive carcinoma | Female | <65 | I/II | Unknown | Unknown | SD |
| Page: 1 2 3 4 5 6 7 8 |
Top |
Related drugs of malignant transformation related genes |
| Identification of chemicals and drugs interact with genes involved in malignant transfromation |
| (DGIdb 4.0) |
| Entrez ID | Symbol | Category | Interaction Types | Drug Claim Name | Drug Name | PMIDs |
| Page: 1 |

Copyright 2023-Present -The University of Texas Health Science Center at Houston |