
|
|||||
|
 | |
| |
| |
| |
| |
| |
|
Gene: KREMEN1 |
Gene summary for KREMEN1 |
| Gene information | Species | Human | Gene symbol | KREMEN1 | Gene ID | 83999 |
| Gene name | kringle containing transmembrane protein 1 | |
| Gene Alias | ECTD13 | |
| Cytomap | 22q12.1 | |
| Gene Type | protein-coding | GO ID | GO:0001503 | UniProtAcc | Q96MU8 |
Top |
Malignant transformation analysis |
| Identification of the aberrant gene expression in precancerous and cancerous lesions by comparing the gene expression of stem-like cells in diseased tissues with normal stem cells |
| Entrez ID | Symbol | Replicates | Species | Organ | Tissue | Adj P-value | Log2FC | Malignancy |
| 83999 | KREMEN1 | CA_HPV_1 | Human | Cervix | CC | 4.85e-02 | -1.39e-01 | 0.0264 |
| 83999 | KREMEN1 | CCI_2 | Human | Cervix | CC | 2.17e-06 | 6.90e-01 | 0.5249 |
| 83999 | KREMEN1 | CCI_3 | Human | Cervix | CC | 9.51e-24 | 1.39e+00 | 0.516 |
| 83999 | KREMEN1 | HTA11_99999965104_69814 | Human | Colorectum | MSS | 5.02e-03 | 2.80e-01 | 0.281 |
| 83999 | KREMEN1 | A015-C-203 | Human | Colorectum | FAP | 2.17e-08 | -1.44e-01 | -0.1294 |
| 83999 | KREMEN1 | A002-C-203 | Human | Colorectum | FAP | 1.05e-02 | -1.87e-01 | 0.2786 |
| 83999 | KREMEN1 | A001-C-108 | Human | Colorectum | FAP | 4.04e-04 | -1.97e-01 | -0.0272 |
| 83999 | KREMEN1 | A002-C-205 | Human | Colorectum | FAP | 1.64e-02 | -1.29e-01 | -0.1236 |
| 83999 | KREMEN1 | A015-C-006 | Human | Colorectum | FAP | 1.54e-02 | -2.86e-01 | -0.0994 |
| 83999 | KREMEN1 | A002-C-114 | Human | Colorectum | FAP | 4.01e-02 | -2.18e-01 | -0.1561 |
| 83999 | KREMEN1 | A015-C-104 | Human | Colorectum | FAP | 1.17e-06 | -1.05e-01 | -0.1899 |
| 83999 | KREMEN1 | A001-C-014 | Human | Colorectum | FAP | 2.42e-04 | -2.08e-01 | 0.0135 |
| 83999 | KREMEN1 | A002-C-016 | Human | Colorectum | FAP | 5.09e-04 | -1.95e-01 | 0.0521 |
| 83999 | KREMEN1 | A001-C-203 | Human | Colorectum | FAP | 2.60e-02 | -1.08e-01 | -0.0481 |
| 83999 | KREMEN1 | A002-C-116 | Human | Colorectum | FAP | 2.94e-09 | -2.45e-01 | -0.0452 |
| 83999 | KREMEN1 | A014-C-008 | Human | Colorectum | FAP | 1.33e-02 | -3.03e-01 | -0.191 |
| 83999 | KREMEN1 | F034 | Human | Colorectum | FAP | 1.08e-04 | -2.30e-01 | -0.0665 |
| 83999 | KREMEN1 | F072B | Human | Colorectum | FAP | 2.41e-02 | -2.38e-01 | 0.257 |
| 83999 | KREMEN1 | LZE7T | Human | Esophagus | ESCC | 4.35e-08 | 6.88e-01 | 0.0667 |
| 83999 | KREMEN1 | LZE24T | Human | Esophagus | ESCC | 1.78e-04 | 1.53e-01 | 0.0596 |
| Page: 1 2 3 4 5 |
| Tissue | Expression Dynamics | Abbreviation |
| Cervix | 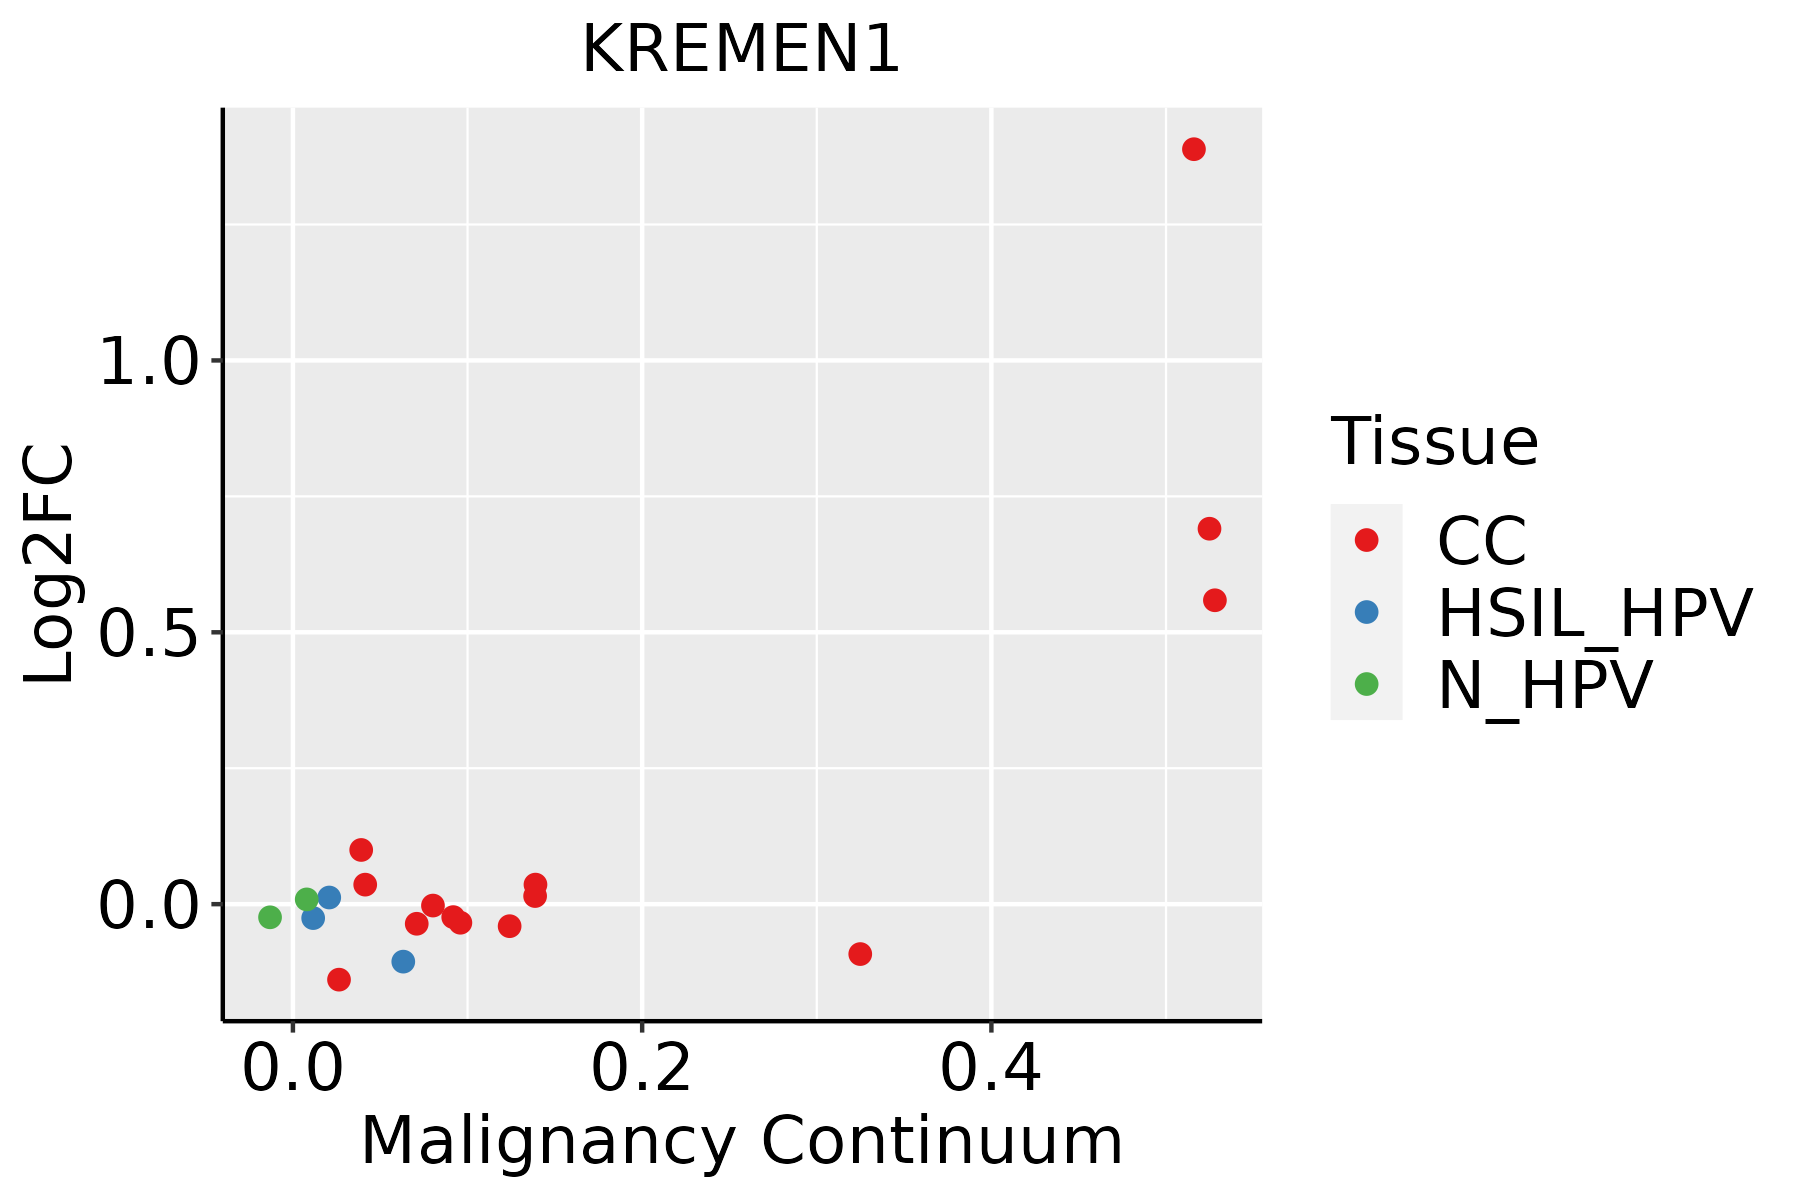 | CC: Cervix cancer |
| HSIL_HPV: HPV-infected high-grade squamous intraepithelial lesions | ||
| N_HPV: HPV-infected normal cervix | ||
| Colorectum (GSE201348) |  | FAP: Familial adenomatous polyposis |
| CRC: Colorectal cancer | ||
| Colorectum (HTA11) | 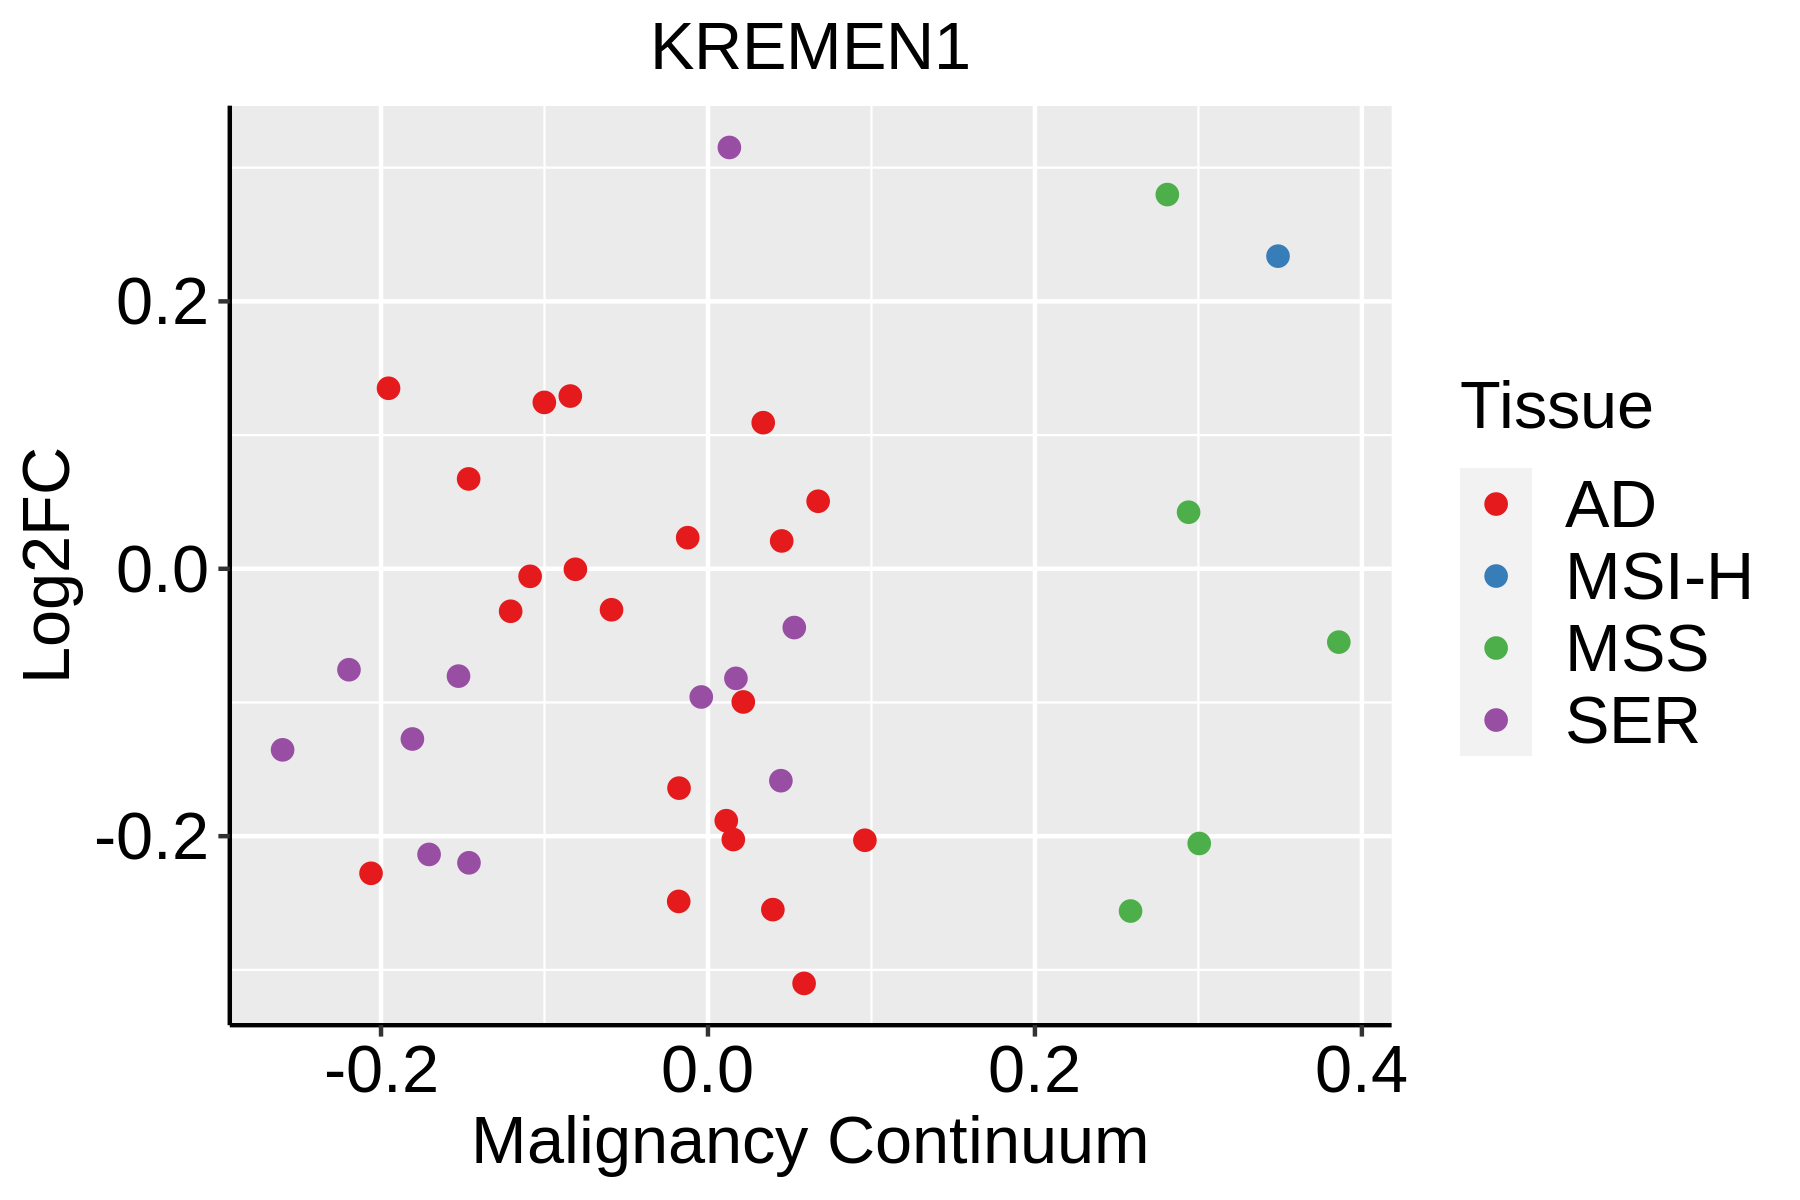 | AD: Adenomas |
| SER: Sessile serrated lesions | ||
| MSI-H: Microsatellite-high colorectal cancer | ||
| MSS: Microsatellite stable colorectal cancer | ||
| Esophagus |  | ESCC: Esophageal squamous cell carcinoma |
| HGIN: High-grade intraepithelial neoplasias | ||
| LGIN: Low-grade intraepithelial neoplasias | ||
| Liver |  | HCC: Hepatocellular carcinoma |
| NAFLD: Non-alcoholic fatty liver disease | ||
| Oral Cavity |  | EOLP: Erosive Oral lichen planus |
| LP: leukoplakia | ||
| NEOLP: Non-erosive oral lichen planus | ||
| OSCC: Oral squamous cell carcinoma |
| ∗log2FC in expression of this searched gene in stem-like cells from each diseased tissue sample relative to stem-like cells in normal samples in each tissue plotted against the malignancy continuum. Samples are colored based on if they are from different disease stage. |
Top |
Malignant transformation related pathway analysis |
| Find out the enriched GO biological processes and KEGG pathways involved in transition from healthy to precancer to cancer |
| Tissue | Disease Stage | Enriched GO biological Processes |
| Colorectum | AD |  |
| Colorectum | SER |  |
| Colorectum | MSS |  |
| Colorectum | MSI-H |  |
| Colorectum | FAP |  |
| ∗Top 15 enriched GO BP terms are showed in the bar plot of each disease state in each tissue. Each row represents a significant GO biological process which is colored according to the -log10(p.adjust). |
| Page: 1 2 3 4 5 6 7 8 9 |
| GO ID | Tissue | Disease Stage | Description | Gene Ratio | Bg Ratio | pvalue | p.adjust | Count |
| GO:00160557 | Cervix | CC | Wnt signaling pathway | 98/2311 | 444/18723 | 4.82e-09 | 4.65e-07 | 98 |
| GO:01987387 | Cervix | CC | cell-cell signaling by wnt | 98/2311 | 446/18723 | 6.16e-09 | 5.58e-07 | 98 |
| GO:00301117 | Cervix | CC | regulation of Wnt signaling pathway | 76/2311 | 328/18723 | 3.05e-08 | 2.08e-06 | 76 |
| GO:19030349 | Cervix | CC | regulation of response to wounding | 44/2311 | 167/18723 | 6.33e-07 | 2.31e-05 | 44 |
| GO:00608287 | Cervix | CC | regulation of canonical Wnt signaling pathway | 58/2311 | 253/18723 | 1.83e-06 | 5.89e-05 | 58 |
| GO:00600707 | Cervix | CC | canonical Wnt signaling pathway | 66/2311 | 303/18723 | 2.47e-06 | 7.35e-05 | 66 |
| GO:00109757 | Cervix | CC | regulation of neuron projection development | 88/2311 | 445/18723 | 4.26e-06 | 1.09e-04 | 88 |
| GO:00310996 | Cervix | CC | regeneration | 46/2311 | 198/18723 | 1.43e-05 | 2.84e-04 | 46 |
| GO:00615647 | Cervix | CC | axon development | 89/2311 | 467/18723 | 1.71e-05 | 3.27e-04 | 89 |
| GO:00313456 | Cervix | CC | negative regulation of cell projection organization | 39/2311 | 186/18723 | 5.86e-04 | 5.57e-03 | 39 |
| GO:00321022 | Cervix | CC | negative regulation of response to external stimulus | 75/2311 | 420/18723 | 5.96e-04 | 5.61e-03 | 75 |
| GO:00301784 | Cervix | CC | negative regulation of Wnt signaling pathway | 35/2311 | 170/18723 | 1.52e-03 | 1.17e-02 | 35 |
| GO:00015037 | Cervix | CC | ossification | 71/2311 | 408/18723 | 1.67e-03 | 1.28e-02 | 71 |
| GO:00487365 | Cervix | CC | appendage development | 35/2311 | 172/18723 | 1.88e-03 | 1.39e-02 | 35 |
| GO:00601735 | Cervix | CC | limb development | 35/2311 | 172/18723 | 1.88e-03 | 1.39e-02 | 35 |
| GO:00900901 | Cervix | CC | negative regulation of canonical Wnt signaling pathway | 29/2311 | 137/18723 | 2.40e-03 | 1.70e-02 | 29 |
| GO:00109775 | Cervix | CC | negative regulation of neuron projection development | 28/2311 | 137/18723 | 4.74e-03 | 2.83e-02 | 28 |
| GO:00486782 | Cervix | CC | response to axon injury | 19/2311 | 83/18723 | 5.25e-03 | 3.08e-02 | 19 |
| GO:0048679 | Cervix | CC | regulation of axon regeneration | 9/2311 | 29/18723 | 6.49e-03 | 3.61e-02 | 9 |
| GO:00302781 | Cervix | CC | regulation of ossification | 24/2311 | 115/18723 | 6.51e-03 | 3.61e-02 | 24 |
| Page: 1 2 3 4 5 |
| Pathway ID | Tissue | Disease Stage | Description | Gene Ratio | Bg Ratio | pvalue | p.adjust | qvalue | Count |
| Page: 1 |
Top |
Cell-cell communication analysis |
| Identification of potential cell-cell interactions between two cell types and their ligand-receptor pairs for different disease states |
| Ligand | Receptor | LRpair | Pathway | Tissue | Disease Stage |
| Page: 1 |
Top |
Single-cell gene regulatory network inference analysis |
| Find out the significant the regulons (TFs) and the target genes of each regulon across cell types for different disease states |
| TF | Cell Type | Tissue | Disease Stage | Target Gene | RSS | Regulon Activity |
| ∗The dot plots of a searched regulon are shown for all cell subpopulations in each disease state of each tissue based on the regulon specific score inferred using pySCENIC and by calculating the average expression. |
| Page: 1 |
Top |
Somatic mutation of malignant transformation related genes |
| Annotation of somatic variants for genes involved in malignant transformation |
| Hugo Symbol | Variant Class | Variant Classification | dbSNP RS | HGVSc | HGVSp | HGVSp Short | SWISSPROT | BIOTYPE | SIFT | PolyPhen | Tumor Sample Barcode | Tissue | Histology | Sex | Age | Stage | Therapy Types | Drugs | Outcome |
| KREMEN1 | SNV | Missense_Mutation | rs775424604 | c.479N>G | p.Phe160Cys | p.F160C | Q96MU8 | protein_coding | deleterious(0) | probably_damaging(0.935) | TCGA-AN-A0AT-01 | Breast | breast invasive carcinoma | Female | <65 | I/II | Unknown | Unknown | SD |
| KREMEN1 | SNV | Missense_Mutation | c.1015G>T | p.Ala339Ser | p.A339S | Q96MU8 | protein_coding | tolerated(0.38) | benign(0.019) | TCGA-E2-A14W-01 | Breast | breast invasive carcinoma | Male | >=65 | I/II | Chemotherapy | cytoxan | SD | |
| KREMEN1 | SNV | Missense_Mutation | rs749155972 | c.1148N>G | p.Met383Arg | p.M383R | Q96MU8 | protein_coding | tolerated_low_confidence(0.7) | benign(0.003) | TCGA-EW-A1J3-01 | Breast | breast invasive carcinoma | Female | <65 | I/II | Chemotherapy | carboplatin | SD |
| KREMEN1 | SNV | Missense_Mutation | novel | c.1444C>T | p.Leu482Phe | p.L482F | Q96MU8 | protein_coding | benign(0.045) | TCGA-C5-A8XH-01 | Cervix | cervical & endocervical cancer | Female | <65 | I/II | Unknown | Unknown | SD | |
| KREMEN1 | SNV | Missense_Mutation | novel | c.148N>T | p.Ala50Ser | p.A50S | Q96MU8 | protein_coding | tolerated(1) | benign(0.013) | TCGA-EA-A3HU-01 | Cervix | cervical & endocervical cancer | Female | <65 | I/II | Unknown | Unknown | SD |
| KREMEN1 | SNV | Missense_Mutation | novel | c.1129N>C | p.Asn377His | p.N377H | Q96MU8 | protein_coding | tolerated_low_confidence(0.33) | benign(0) | TCGA-AA-A01D-01 | Colorectum | colon adenocarcinoma | Female | <65 | III/IV | Chemotherapy | capecitabine | PD |
| KREMEN1 | SNV | Missense_Mutation | novel | c.1130N>C | p.Asn377Thr | p.N377T | Q96MU8 | protein_coding | tolerated_low_confidence(0.61) | benign(0) | TCGA-AA-A01D-01 | Colorectum | colon adenocarcinoma | Female | <65 | III/IV | Chemotherapy | capecitabine | PD |
| KREMEN1 | SNV | Missense_Mutation | rs751542642 | c.856N>A | p.Gly286Arg | p.G286R | Q96MU8 | protein_coding | deleterious(0) | probably_damaging(0.984) | TCGA-AA-A01P-01 | Colorectum | colon adenocarcinoma | Female | >=65 | III/IV | Unknown | Unknown | PD |
| KREMEN1 | SNV | Missense_Mutation | rs774077658 | c.500N>G | p.Tyr167Cys | p.Y167C | Q96MU8 | protein_coding | deleterious(0.05) | probably_damaging(0.964) | TCGA-AD-6895-01 | Colorectum | colon adenocarcinoma | Male | >=65 | III/IV | Unknown | Unknown | SD |
| KREMEN1 | SNV | Missense_Mutation | novel | c.377N>C | p.Lys126Thr | p.K126T | Q96MU8 | protein_coding | tolerated(0.23) | possibly_damaging(0.544) | TCGA-CA-6717-01 | Colorectum | colon adenocarcinoma | Male | <65 | I/II | Chemotherapy | oxaliplatin | CR |
| Page: 1 2 3 4 5 6 |
Top |
Related drugs of malignant transformation related genes |
| Identification of chemicals and drugs interact with genes involved in malignant transfromation |
| (DGIdb 4.0) |
| Entrez ID | Symbol | Category | Interaction Types | Drug Claim Name | Drug Name | PMIDs |
| Page: 1 |

Copyright 2023-Present -The University of Texas Health Science Center at Houston |