| Tissue | Expression Dynamics | Abbreviation |
| Esophagus |  | ESCC: Esophageal squamous cell carcinoma |
| HGIN: High-grade intraepithelial neoplasias |
| LGIN: Low-grade intraepithelial neoplasias |
| Liver | 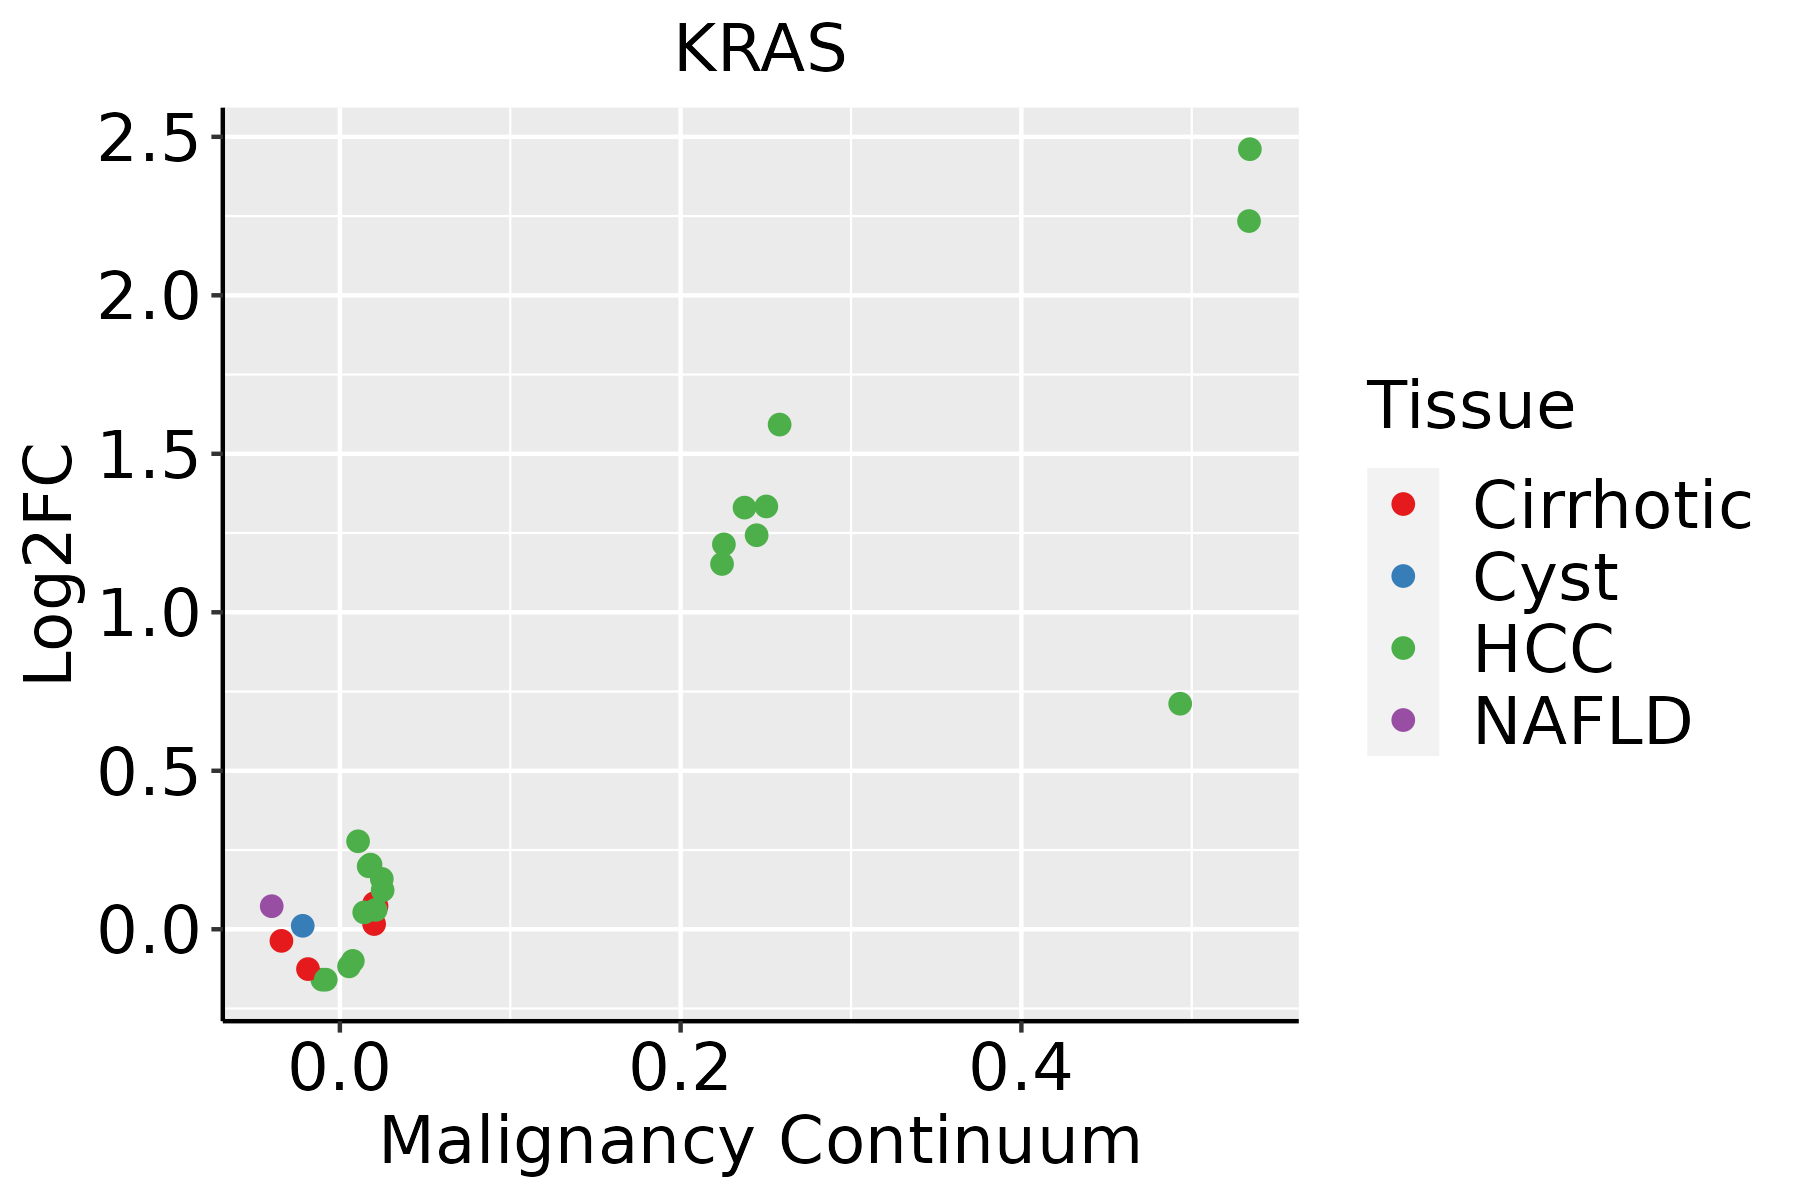 | HCC: Hepatocellular carcinoma |
| NAFLD: Non-alcoholic fatty liver disease |
| Oral Cavity | 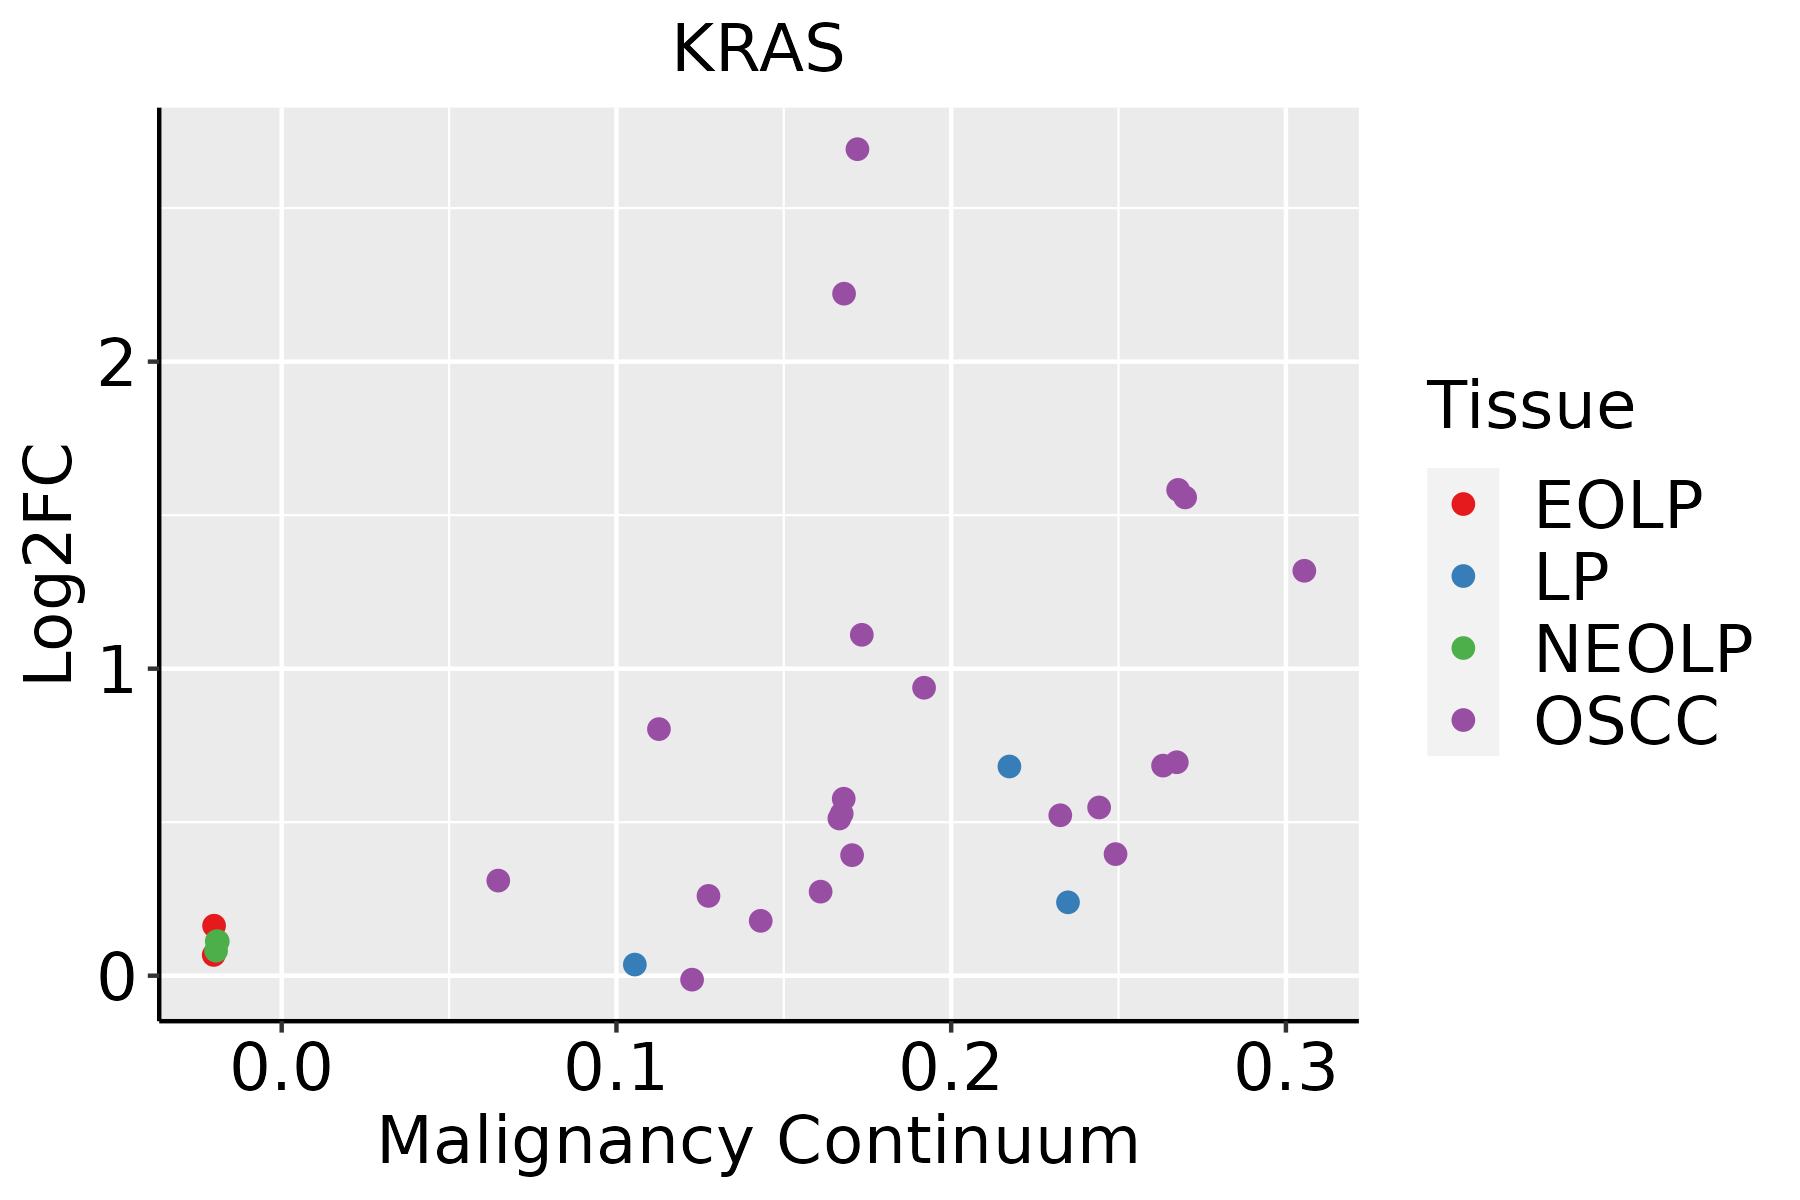 | EOLP: Erosive Oral lichen planus |
| LP: leukoplakia |
| NEOLP: Non-erosive oral lichen planus |
| OSCC: Oral squamous cell carcinoma |
| Skin |  | AK: Actinic keratosis |
| cSCC: Cutaneous squamous cell carcinoma |
| SCCIS:squamous cell carcinoma in situ |
| Thyroid | 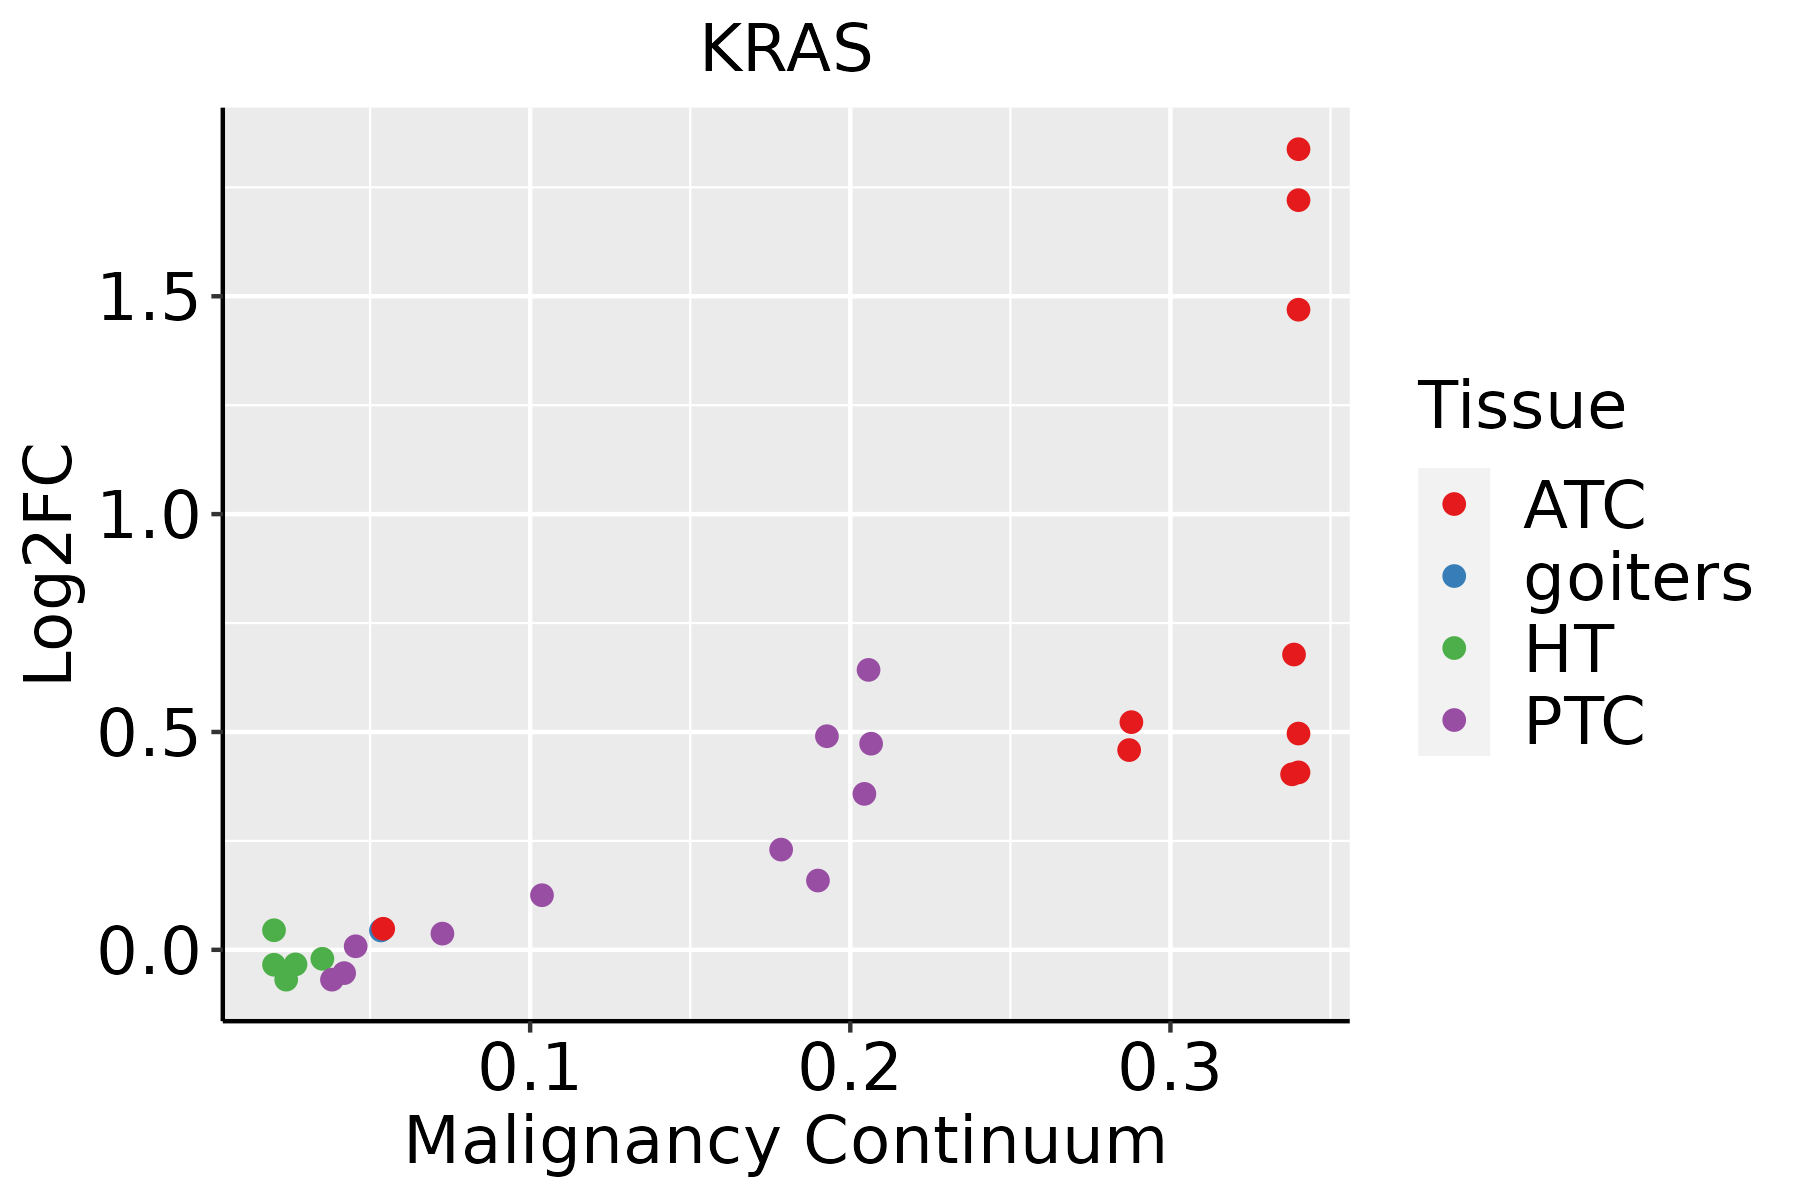 | ATC: Anaplastic thyroid cancer |
| HT: Hashimoto's thyroiditis |
| PTC: Papillary thyroid cancer |
| GO ID | Tissue | Disease Stage | Description | Gene Ratio | Bg Ratio | pvalue | p.adjust | Count |
| GO:003164727 | Esophagus | HGIN | regulation of protein stability | 96/2587 | 298/18723 | 2.21e-16 | 5.76e-14 | 96 |
| GO:007099727 | Esophagus | HGIN | neuron death | 81/2587 | 361/18723 | 5.01e-06 | 1.61e-04 | 81 |
| GO:004854527 | Esophagus | HGIN | response to steroid hormone | 73/2587 | 339/18723 | 6.06e-05 | 1.40e-03 | 73 |
| GO:004873225 | Esophagus | HGIN | gland development | 88/2587 | 436/18723 | 1.34e-04 | 2.71e-03 | 88 |
| GO:190121424 | Esophagus | HGIN | regulation of neuron death | 68/2587 | 319/18723 | 1.46e-04 | 2.91e-03 | 68 |
| GO:006100820 | Esophagus | HGIN | hepaticobiliary system development | 37/2587 | 150/18723 | 2.58e-04 | 4.53e-03 | 37 |
| GO:000188920 | Esophagus | HGIN | liver development | 36/2587 | 147/18723 | 3.61e-04 | 5.68e-03 | 36 |
| GO:000931418 | Esophagus | HGIN | response to radiation | 88/2587 | 456/18723 | 6.26e-04 | 8.65e-03 | 88 |
| GO:005140219 | Esophagus | HGIN | neuron apoptotic process | 52/2587 | 246/18723 | 1.01e-03 | 1.26e-02 | 52 |
| GO:004887227 | Esophagus | HGIN | homeostasis of number of cells | 54/2587 | 272/18723 | 3.50e-03 | 3.23e-02 | 54 |
| GO:190121510 | Esophagus | HGIN | negative regulation of neuron death | 43/2587 | 208/18723 | 4.04e-03 | 3.64e-02 | 43 |
| GO:00094165 | Esophagus | HGIN | response to light stimulus | 61/2587 | 320/18723 | 5.20e-03 | 4.30e-02 | 61 |
| GO:0031647111 | Esophagus | ESCC | regulation of protein stability | 223/8552 | 298/18723 | 5.76e-25 | 1.52e-22 | 223 |
| GO:0048732111 | Esophagus | ESCC | gland development | 269/8552 | 436/18723 | 7.81e-12 | 2.95e-10 | 269 |
| GO:007190016 | Esophagus | ESCC | regulation of protein serine/threonine kinase activity | 227/8552 | 359/18723 | 1.12e-11 | 4.10e-10 | 227 |
| GO:000931419 | Esophagus | ESCC | response to radiation | 277/8552 | 456/18723 | 4.42e-11 | 1.43e-09 | 277 |
| GO:0070997111 | Esophagus | ESCC | neuron death | 216/8552 | 361/18723 | 3.49e-08 | 6.45e-07 | 216 |
| GO:0048545111 | Esophagus | ESCC | response to steroid hormone | 204/8552 | 339/18723 | 4.47e-08 | 8.11e-07 | 204 |
| GO:000726510 | Esophagus | ESCC | Ras protein signal transduction | 201/8552 | 337/18723 | 1.44e-07 | 2.30e-06 | 201 |
| GO:000756820 | Esophagus | ESCC | aging | 201/8552 | 339/18723 | 2.64e-07 | 3.94e-06 | 201 |
| Pathway ID | Tissue | Disease Stage | Description | Gene Ratio | Bg Ratio | pvalue | p.adjust | qvalue | Count |
| hsa0520839 | Esophagus | HGIN | Chemical carcinogenesis - reactive oxygen species | 92/1383 | 223/8465 | 2.41e-19 | 9.83e-18 | 7.80e-18 | 92 |
| hsa0502230 | Esophagus | HGIN | Pathways of neurodegeneration - multiple diseases | 153/1383 | 476/8465 | 1.22e-18 | 4.41e-17 | 3.50e-17 | 153 |
| hsa0501030 | Esophagus | HGIN | Alzheimer disease | 130/1383 | 384/8465 | 5.26e-18 | 1.71e-16 | 1.36e-16 | 130 |
| hsa0471439 | Esophagus | HGIN | Thermogenesis | 91/1383 | 232/8465 | 1.97e-17 | 5.36e-16 | 4.25e-16 | 91 |
| hsa0516730 | Esophagus | HGIN | Kaposi sarcoma-associated herpesvirus infection | 51/1383 | 194/8465 | 2.46e-04 | 2.69e-03 | 2.14e-03 | 51 |
| hsa052039 | Esophagus | HGIN | Viral carcinogenesis | 53/1383 | 204/8465 | 2.58e-04 | 2.71e-03 | 2.15e-03 | 53 |
| hsa0421828 | Esophagus | HGIN | Cellular senescence | 42/1383 | 156/8465 | 4.94e-04 | 5.03e-03 | 4.00e-03 | 42 |
| hsa0413730 | Esophagus | HGIN | Mitophagy - animal | 23/1383 | 72/8465 | 7.69e-04 | 7.59e-03 | 6.03e-03 | 23 |
| hsa0421020 | Esophagus | HGIN | Apoptosis | 36/1383 | 136/8465 | 1.67e-03 | 1.52e-02 | 1.20e-02 | 36 |
| hsa0517029 | Esophagus | HGIN | Human immunodeficiency virus 1 infection | 51/1383 | 212/8465 | 2.16e-03 | 1.90e-02 | 1.51e-02 | 51 |
| hsa0541739 | Esophagus | HGIN | Lipid and atherosclerosis | 51/1383 | 215/8465 | 2.95e-03 | 2.41e-02 | 1.91e-02 | 51 |
| hsa0521620 | Esophagus | HGIN | Thyroid cancer | 13/1383 | 37/8465 | 4.20e-03 | 3.04e-02 | 2.41e-02 | 13 |
| hsa0516639 | Esophagus | HGIN | Human T-cell leukemia virus 1 infection | 51/1383 | 222/8465 | 5.84e-03 | 4.05e-02 | 3.22e-02 | 51 |
| hsa0516330 | Esophagus | HGIN | Human cytomegalovirus infection | 51/1383 | 225/8465 | 7.67e-03 | 4.63e-02 | 3.68e-02 | 51 |
| hsa0520528 | Esophagus | HGIN | Proteoglycans in cancer | 47/1383 | 205/8465 | 8.23e-03 | 4.71e-02 | 3.74e-02 | 47 |
| hsa05208115 | Esophagus | HGIN | Chemical carcinogenesis - reactive oxygen species | 92/1383 | 223/8465 | 2.41e-19 | 9.83e-18 | 7.80e-18 | 92 |
| hsa05022113 | Esophagus | HGIN | Pathways of neurodegeneration - multiple diseases | 153/1383 | 476/8465 | 1.22e-18 | 4.41e-17 | 3.50e-17 | 153 |
| hsa05010113 | Esophagus | HGIN | Alzheimer disease | 130/1383 | 384/8465 | 5.26e-18 | 1.71e-16 | 1.36e-16 | 130 |
| hsa04714114 | Esophagus | HGIN | Thermogenesis | 91/1383 | 232/8465 | 1.97e-17 | 5.36e-16 | 4.25e-16 | 91 |
| hsa05167114 | Esophagus | HGIN | Kaposi sarcoma-associated herpesvirus infection | 51/1383 | 194/8465 | 2.46e-04 | 2.69e-03 | 2.14e-03 | 51 |
| Hugo Symbol | Variant Class | Variant Classification | dbSNP RS | HGVSc | HGVSp | HGVSp Short | SWISSPROT | BIOTYPE | SIFT | PolyPhen | Tumor Sample Barcode | Tissue | Histology | Sex | Age | Stage | Therapy Types | Drugs | Outcome |
| KRAS | SNV | Missense_Mutation | | c.274N>T | p.Asp92Tyr | p.D92Y | P01116 | protein_coding | deleterious(0) | probably_damaging(0.963) | TCGA-AN-A046-01 | Breast | breast invasive carcinoma | Female | >=65 | I/II | Unknown | Unknown | SD |
| KRAS | SNV | Missense_Mutation | rs121913530 | c.34N>T | p.Gly12Cys | p.G12C | P01116 | protein_coding | deleterious(0.04) | probably_damaging(0.991) | TCGA-AR-A1AL-01 | Breast | breast invasive carcinoma | Female | <65 | III/IV | Hormone Therapy | anastrozole | SD |
| KRAS | SNV | Missense_Mutation | rs121913529 | c.35N>T | p.Gly12Val | p.G12V | P01116 | protein_coding | deleterious(0) | probably_damaging(0.972) | TCGA-AR-A1AS-01 | Breast | breast invasive carcinoma | Female | <65 | I/II | Chemotherapy | doxorubicin | SD |
| KRAS | SNV | Missense_Mutation | rs121913529 | c.35N>T | p.Gly12Val | p.G12V | P01116 | protein_coding | deleterious(0) | probably_damaging(0.972) | TCGA-C8-A131-01 | Breast | breast invasive carcinoma | Female | >=65 | III/IV | Chemotherapy | 5-fluorouracil | CR |
| KRAS | SNV | Missense_Mutation | rs121913529 | c.35N>A | p.Gly12Asp | p.G12D | P01116 | protein_coding | deleterious(0) | benign(0.303) | TCGA-E2-A1IF-01 | Breast | breast invasive carcinoma | Female | >=65 | I/II | Hormone Therapy | arimidex | SD |
| KRAS | SNV | Missense_Mutation | rs121913529 | c.35N>T | p.Gly12Val | p.G12V | P01116 | protein_coding | deleterious(0) | probably_damaging(0.972) | TCGA-E9-A1NG-01 | Breast | breast invasive carcinoma | Female | <65 | I/II | Hormone Therapy | letrozole | SD |
| KRAS | SNV | Missense_Mutation | rs121913529 | c.35N>A | p.Gly12Asp | p.G12D | P01116 | protein_coding | deleterious(0) | benign(0.303) | TCGA-C5-A1ME-01 | Cervix | cervical & endocervical cancer | Female | <65 | I/II | Unknown | Unknown | SD |
| KRAS | SNV | Missense_Mutation | rs121913527 | c.436N>A | p.Ala146Thr | p.A146T | P01116 | protein_coding | deleterious(0.03) | possibly_damaging(0.844) | TCGA-C5-A2M1-01 | Cervix | cervical & endocervical cancer | Female | <65 | I/II | Unknown | Unknown | SD |
| KRAS | SNV | Missense_Mutation | rs112445441 | c.38N>A | p.Gly13Asp | p.G13D | P01116 | protein_coding | deleterious(0.04) | benign(0.44) | TCGA-C5-A3HF-01 | Cervix | cervical & endocervical cancer | Female | <65 | I/II | Unknown | Unknown | PD |
| KRAS | SNV | Missense_Mutation | rs104894365 | c.40N>A | p.Val14Ile | p.V14I | P01116 | protein_coding | deleterious(0) | probably_damaging(0.959) | TCGA-C5-A905-01 | Cervix | cervical & endocervical cancer | Female | <65 | I/II | Unknown | Unknown | SD |
| Entrez ID | Symbol | Category | Interaction Types | Drug Claim Name | Drug Name | PMIDs |
| 3845 | KRAS | CLINICALLY ACTIONABLE, DRUG RESISTANCE, ENZYME | | lenalidomide | LENALIDOMIDE | 27458141 |
| 3845 | KRAS | CLINICALLY ACTIONABLE, DRUG RESISTANCE, ENZYME | | GA201 | IMGATUZUMAB | 23209031 |
| 3845 | KRAS | CLINICALLY ACTIONABLE, DRUG RESISTANCE, ENZYME | | 3144 | | 28235199 |
| 3845 | KRAS | CLINICALLY ACTIONABLE, DRUG RESISTANCE, ENZYME | | Cobimetinib | COBIMETINIB | |
| 3845 | KRAS | CLINICALLY ACTIONABLE, DRUG RESISTANCE, ENZYME | | BKM120 | BUPARLISIB | 26715098,22159814,26098748,24576621 |
| 3845 | KRAS | CLINICALLY ACTIONABLE, DRUG RESISTANCE, ENZYME | | AZD4785 | AZD-4785 | |
| 3845 | KRAS | CLINICALLY ACTIONABLE, DRUG RESISTANCE, ENZYME | | Gefitinib | GEFITINIB | 15696205,27338794,25870145 |
| 3845 | KRAS | CLINICALLY ACTIONABLE, DRUG RESISTANCE, ENZYME | | CGM097 | CGM-097 | 27659046 |
| 3845 | KRAS | CLINICALLY ACTIONABLE, DRUG RESISTANCE, ENZYME | | IRX4204 | | |
| 3845 | KRAS | CLINICALLY ACTIONABLE, DRUG RESISTANCE, ENZYME | | MK2206 | MK-2206 | 26676756,25931518,26725216,22025163,27480147 |


