
|
|||||
|
 | |
| |
| |
| |
| |
| |
|
Gene: KPTN |
Gene summary for KPTN |
| Gene information | Species | Human | Gene symbol | KPTN | Gene ID | 11133 |
| Gene name | kaptin, actin binding protein | |
| Gene Alias | 2E4 | |
| Cytomap | 19q13.32 | |
| Gene Type | protein-coding | GO ID | GO:0006950 | UniProtAcc | Q9Y664 |
Top |
Malignant transformation analysis |
| Identification of the aberrant gene expression in precancerous and cancerous lesions by comparing the gene expression of stem-like cells in diseased tissues with normal stem cells |
| Entrez ID | Symbol | Replicates | Species | Organ | Tissue | Adj P-value | Log2FC | Malignancy |
| 11133 | KPTN | LZE4T | Human | Esophagus | ESCC | 7.82e-03 | 7.69e-02 | 0.0811 |
| 11133 | KPTN | LZE24T | Human | Esophagus | ESCC | 6.33e-10 | 1.83e-01 | 0.0596 |
| 11133 | KPTN | P2T-E | Human | Esophagus | ESCC | 8.71e-08 | 1.36e-01 | 0.1177 |
| 11133 | KPTN | P4T-E | Human | Esophagus | ESCC | 2.63e-16 | 1.47e-01 | 0.1323 |
| 11133 | KPTN | P5T-E | Human | Esophagus | ESCC | 2.42e-07 | 1.59e-01 | 0.1327 |
| 11133 | KPTN | P8T-E | Human | Esophagus | ESCC | 4.65e-15 | 2.26e-01 | 0.0889 |
| 11133 | KPTN | P9T-E | Human | Esophagus | ESCC | 1.89e-05 | 6.44e-02 | 0.1131 |
| 11133 | KPTN | P10T-E | Human | Esophagus | ESCC | 7.79e-13 | 2.42e-01 | 0.116 |
| 11133 | KPTN | P11T-E | Human | Esophagus | ESCC | 7.48e-04 | 1.55e-01 | 0.1426 |
| 11133 | KPTN | P12T-E | Human | Esophagus | ESCC | 5.36e-14 | 3.16e-01 | 0.1122 |
| 11133 | KPTN | P15T-E | Human | Esophagus | ESCC | 4.96e-10 | 2.30e-01 | 0.1149 |
| 11133 | KPTN | P16T-E | Human | Esophagus | ESCC | 4.31e-06 | 1.53e-01 | 0.1153 |
| 11133 | KPTN | P19T-E | Human | Esophagus | ESCC | 7.13e-03 | 1.94e-01 | 0.1662 |
| 11133 | KPTN | P20T-E | Human | Esophagus | ESCC | 5.20e-14 | 1.86e-01 | 0.1124 |
| 11133 | KPTN | P21T-E | Human | Esophagus | ESCC | 1.69e-08 | 1.53e-01 | 0.1617 |
| 11133 | KPTN | P22T-E | Human | Esophagus | ESCC | 2.05e-13 | 1.59e-01 | 0.1236 |
| 11133 | KPTN | P23T-E | Human | Esophagus | ESCC | 5.42e-06 | 7.31e-02 | 0.108 |
| 11133 | KPTN | P24T-E | Human | Esophagus | ESCC | 2.93e-03 | 9.34e-02 | 0.1287 |
| 11133 | KPTN | P26T-E | Human | Esophagus | ESCC | 1.01e-12 | 3.01e-01 | 0.1276 |
| 11133 | KPTN | P27T-E | Human | Esophagus | ESCC | 6.31e-12 | 1.95e-01 | 0.1055 |
| Page: 1 2 3 |
| Tissue | Expression Dynamics | Abbreviation |
| Esophagus | 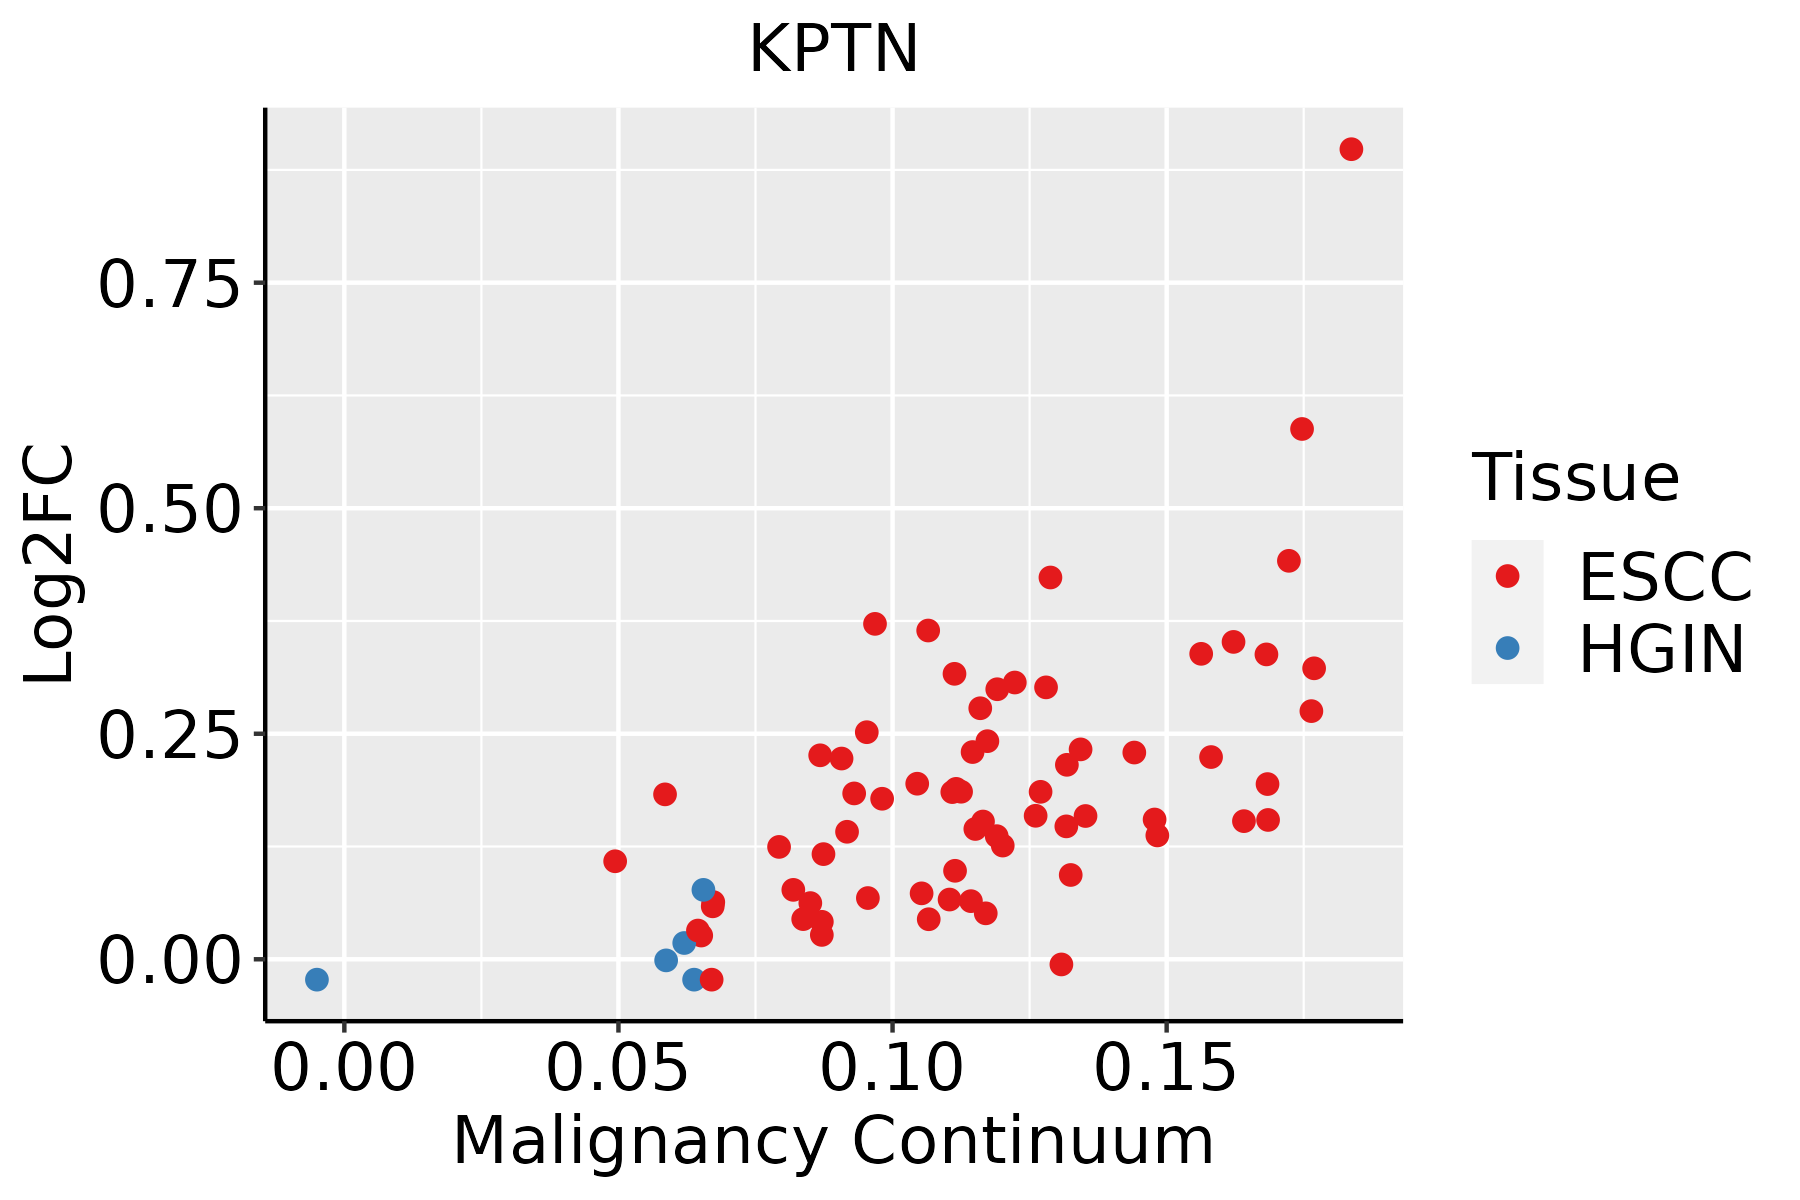 | ESCC: Esophageal squamous cell carcinoma |
| HGIN: High-grade intraepithelial neoplasias | ||
| LGIN: Low-grade intraepithelial neoplasias |
| ∗log2FC in expression of this searched gene in stem-like cells from each diseased tissue sample relative to stem-like cells in normal samples in each tissue plotted against the malignancy continuum. Samples are colored based on if they are from different disease stage. |
Top |
Malignant transformation related pathway analysis |
| Find out the enriched GO biological processes and KEGG pathways involved in transition from healthy to precancer to cancer |
| Tissue | Disease Stage | Enriched GO biological Processes |
| Colorectum | AD |  |
| Colorectum | SER |  |
| Colorectum | MSS |  |
| Colorectum | MSI-H |  |
| Colorectum | FAP |  |
| ∗Top 15 enriched GO BP terms are showed in the bar plot of each disease state in each tissue. Each row represents a significant GO biological process which is colored according to the -log10(p.adjust). |
| Page: 1 2 3 4 5 6 7 8 9 |
| GO ID | Tissue | Disease Stage | Description | Gene Ratio | Bg Ratio | pvalue | p.adjust | Count |
| GO:0071496111 | Esophagus | ESCC | cellular response to external stimulus | 215/8552 | 320/18723 | 4.29e-15 | 2.43e-13 | 215 |
| GO:0031668111 | Esophagus | ESCC | cellular response to extracellular stimulus | 168/8552 | 246/18723 | 4.93e-13 | 2.23e-11 | 168 |
| GO:0031669110 | Esophagus | ESCC | cellular response to nutrient levels | 148/8552 | 215/18723 | 4.58e-12 | 1.76e-10 | 148 |
| GO:0031667111 | Esophagus | ESCC | response to nutrient levels | 289/8552 | 474/18723 | 9.25e-12 | 3.47e-10 | 289 |
| GO:0009267110 | Esophagus | ESCC | cellular response to starvation | 110/8552 | 156/18723 | 2.63e-10 | 7.37e-09 | 110 |
| GO:004259419 | Esophagus | ESCC | response to starvation | 133/8552 | 197/18723 | 4.31e-10 | 1.14e-08 | 133 |
| GO:000701527 | Esophagus | ESCC | actin filament organization | 259/8552 | 442/18723 | 2.37e-08 | 4.50e-07 | 259 |
| GO:00726659 | Esophagus | ESCC | protein localization to vacuole | 52/8552 | 67/18723 | 9.14e-08 | 1.52e-06 | 52 |
| GO:19909284 | Esophagus | ESCC | response to amino acid starvation | 37/8552 | 49/18723 | 2.05e-05 | 1.78e-04 | 37 |
| GO:00421492 | Esophagus | ESCC | cellular response to glucose starvation | 36/8552 | 48/18723 | 3.43e-05 | 2.80e-04 | 36 |
| GO:00319294 | Esophagus | ESCC | TOR signaling | 79/8552 | 126/18723 | 8.57e-05 | 6.21e-04 | 79 |
| GO:00341984 | Esophagus | ESCC | cellular response to amino acid starvation | 34/8552 | 46/18723 | 9.39e-05 | 6.70e-04 | 34 |
| GO:00614626 | Esophagus | ESCC | protein localization to lysosome | 34/8552 | 46/18723 | 9.39e-05 | 6.70e-04 | 34 |
| GO:00320061 | Esophagus | ESCC | regulation of TOR signaling | 63/8552 | 104/18723 | 1.55e-03 | 7.29e-03 | 63 |
| Page: 1 |
| Pathway ID | Tissue | Disease Stage | Description | Gene Ratio | Bg Ratio | pvalue | p.adjust | qvalue | Count |
| Page: 1 |
Top |
Cell-cell communication analysis |
| Identification of potential cell-cell interactions between two cell types and their ligand-receptor pairs for different disease states |
| Ligand | Receptor | LRpair | Pathway | Tissue | Disease Stage |
| Page: 1 |
Top |
Single-cell gene regulatory network inference analysis |
| Find out the significant the regulons (TFs) and the target genes of each regulon across cell types for different disease states |
| TF | Cell Type | Tissue | Disease Stage | Target Gene | RSS | Regulon Activity |
| ∗The dot plots of a searched regulon are shown for all cell subpopulations in each disease state of each tissue based on the regulon specific score inferred using pySCENIC and by calculating the average expression. |
| Page: 1 |
Top |
Somatic mutation of malignant transformation related genes |
| Annotation of somatic variants for genes involved in malignant transformation |
| Hugo Symbol | Variant Class | Variant Classification | dbSNP RS | HGVSc | HGVSp | HGVSp Short | SWISSPROT | BIOTYPE | SIFT | PolyPhen | Tumor Sample Barcode | Tissue | Histology | Sex | Age | Stage | Therapy Types | Drugs | Outcome |
| KPTN | SNV | Missense_Mutation | novel | c.412N>A | p.Glu138Lys | p.E138K | Q9Y664 | protein_coding | deleterious(0.01) | benign(0.074) | TCGA-A2-A0CX-01 | Breast | breast invasive carcinoma | Female | <65 | I/II | Chemotherapy | adriamycin | SD |
| KPTN | SNV | Missense_Mutation | c.370N>A | p.Glu124Lys | p.E124K | Q9Y664 | protein_coding | deleterious(0) | probably_damaging(0.988) | TCGA-A2-A0CX-01 | Breast | breast invasive carcinoma | Female | <65 | I/II | Chemotherapy | adriamycin | SD | |
| KPTN | SNV | Missense_Mutation | rs370453813 | c.1078N>T | p.Arg360Trp | p.R360W | Q9Y664 | protein_coding | deleterious(0.03) | benign(0.067) | TCGA-F4-6570-01 | Colorectum | colon adenocarcinoma | Female | >=65 | I/II | Unknown | Unknown | SD |
| KPTN | SNV | Missense_Mutation | rs373073023 | c.823N>A | p.Val275Met | p.V275M | Q9Y664 | protein_coding | deleterious(0.03) | benign(0.241) | TCGA-F4-6570-01 | Colorectum | colon adenocarcinoma | Female | >=65 | I/II | Unknown | Unknown | SD |
| KPTN | SNV | Missense_Mutation | rs776547634 | c.584N>T | p.Thr195Met | p.T195M | Q9Y664 | protein_coding | tolerated(0.1) | possibly_damaging(0.454) | TCGA-A5-A0GP-01 | Endometrium | uterine corpus endometrioid carcinoma | Female | <65 | I/II | Unknown | Unknown | SD |
| KPTN | SNV | Missense_Mutation | novel | c.141N>C | p.Lys47Asn | p.K47N | Q9Y664 | protein_coding | tolerated(0.06) | benign(0.02) | TCGA-AP-A1DV-01 | Endometrium | uterine corpus endometrioid carcinoma | Female | <65 | I/II | Unknown | Unknown | SD |
| KPTN | SNV | Missense_Mutation | novel | c.656N>A | p.Leu219Gln | p.L219Q | Q9Y664 | protein_coding | deleterious(0.02) | possibly_damaging(0.584) | TCGA-AX-A2HC-01 | Endometrium | uterine corpus endometrioid carcinoma | Female | <65 | III/IV | Chemotherapy | paclitaxel | PD |
| KPTN | SNV | Missense_Mutation | rs369136620 | c.967C>T | p.Arg323Trp | p.R323W | Q9Y664 | protein_coding | deleterious(0) | benign(0.292) | TCGA-B5-A11E-01 | Endometrium | uterine corpus endometrioid carcinoma | Female | <65 | I/II | Unknown | Unknown | SD |
| KPTN | SNV | Missense_Mutation | rs370974946 | c.529N>A | p.Glu177Lys | p.E177K | Q9Y664 | protein_coding | tolerated(0.38) | benign(0.057) | TCGA-B5-A11Y-01 | Endometrium | uterine corpus endometrioid carcinoma | Female | <65 | I/II | Unknown | Unknown | SD |
| KPTN | SNV | Missense_Mutation | novel | c.223N>A | p.Pro75Thr | p.P75T | Q9Y664 | protein_coding | deleterious(0) | probably_damaging(1) | TCGA-B5-A1MR-01 | Endometrium | uterine corpus endometrioid carcinoma | Female | >=65 | III/IV | Unknown | Unknown | SD |
| Page: 1 2 3 4 |
Top |
Related drugs of malignant transformation related genes |
| Identification of chemicals and drugs interact with genes involved in malignant transfromation |
| (DGIdb 4.0) |
| Entrez ID | Symbol | Category | Interaction Types | Drug Claim Name | Drug Name | PMIDs |
| Page: 1 |

Copyright 2023-Present -The University of Texas Health Science Center at Houston |