
|
|||||
|
 | |
| |
| |
| |
| |
| |
|
Gene: KPNA3 |
Gene summary for KPNA3 |
| Gene information | Species | Human | Gene symbol | KPNA3 | Gene ID | 3839 |
| Gene name | karyopherin subunit alpha 3 | |
| Gene Alias | IPOA4 | |
| Cytomap | 13q14.2 | |
| Gene Type | protein-coding | GO ID | GO:0006606 | UniProtAcc | A0A024RDV7 |
Top |
Malignant transformation analysis |
| Identification of the aberrant gene expression in precancerous and cancerous lesions by comparing the gene expression of stem-like cells in diseased tissues with normal stem cells |
| Entrez ID | Symbol | Replicates | Species | Organ | Tissue | Adj P-value | Log2FC | Malignancy |
| 3839 | KPNA3 | CCI_2 | Human | Cervix | CC | 7.55e-07 | 9.86e-01 | 0.5249 |
| 3839 | KPNA3 | CCI_3 | Human | Cervix | CC | 1.99e-08 | 6.58e-01 | 0.516 |
| 3839 | KPNA3 | HTA11_3410_2000001011 | Human | Colorectum | AD | 2.58e-12 | -5.11e-01 | 0.0155 |
| 3839 | KPNA3 | HTA11_3361_2000001011 | Human | Colorectum | AD | 1.99e-06 | -5.73e-01 | -0.1207 |
| 3839 | KPNA3 | HTA11_866_2000001011 | Human | Colorectum | AD | 6.27e-04 | -3.08e-01 | -0.1001 |
| 3839 | KPNA3 | HTA11_866_3004761011 | Human | Colorectum | AD | 8.40e-07 | -4.60e-01 | 0.096 |
| 3839 | KPNA3 | HTA11_7696_3000711011 | Human | Colorectum | AD | 2.11e-07 | -3.91e-01 | 0.0674 |
| 3839 | KPNA3 | HTA11_6818_2000001021 | Human | Colorectum | AD | 7.67e-04 | -5.02e-01 | 0.0588 |
| 3839 | KPNA3 | HTA11_99999970781_79442 | Human | Colorectum | MSS | 1.34e-04 | -3.19e-01 | 0.294 |
| 3839 | KPNA3 | HTA11_99999965104_69814 | Human | Colorectum | MSS | 1.31e-03 | 6.07e-01 | 0.281 |
| 3839 | KPNA3 | A001-C-207 | Human | Colorectum | FAP | 5.05e-04 | -2.90e-01 | 0.1278 |
| 3839 | KPNA3 | A015-C-203 | Human | Colorectum | FAP | 5.22e-25 | -4.47e-01 | -0.1294 |
| 3839 | KPNA3 | A015-C-204 | Human | Colorectum | FAP | 3.97e-08 | -4.35e-01 | -0.0228 |
| 3839 | KPNA3 | A014-C-040 | Human | Colorectum | FAP | 2.26e-06 | -6.06e-01 | -0.1184 |
| 3839 | KPNA3 | A002-C-201 | Human | Colorectum | FAP | 2.27e-12 | -3.81e-01 | 0.0324 |
| 3839 | KPNA3 | A002-C-203 | Human | Colorectum | FAP | 3.67e-09 | -3.94e-01 | 0.2786 |
| 3839 | KPNA3 | A001-C-119 | Human | Colorectum | FAP | 1.65e-13 | -5.75e-01 | -0.1557 |
| 3839 | KPNA3 | A001-C-108 | Human | Colorectum | FAP | 7.86e-23 | -4.97e-01 | -0.0272 |
| 3839 | KPNA3 | A002-C-205 | Human | Colorectum | FAP | 5.08e-19 | -4.98e-01 | -0.1236 |
| 3839 | KPNA3 | A001-C-104 | Human | Colorectum | FAP | 1.87e-11 | -4.36e-01 | 0.0184 |
| Page: 1 2 3 4 5 6 7 8 |
| Tissue | Expression Dynamics | Abbreviation |
| Cervix |  | CC: Cervix cancer |
| HSIL_HPV: HPV-infected high-grade squamous intraepithelial lesions | ||
| N_HPV: HPV-infected normal cervix | ||
| Colorectum (GSE201348) |  | FAP: Familial adenomatous polyposis |
| CRC: Colorectal cancer | ||
| Colorectum (HTA11) |  | AD: Adenomas |
| SER: Sessile serrated lesions | ||
| MSI-H: Microsatellite-high colorectal cancer | ||
| MSS: Microsatellite stable colorectal cancer | ||
| Esophagus |  | ESCC: Esophageal squamous cell carcinoma |
| HGIN: High-grade intraepithelial neoplasias | ||
| LGIN: Low-grade intraepithelial neoplasias | ||
| Liver | 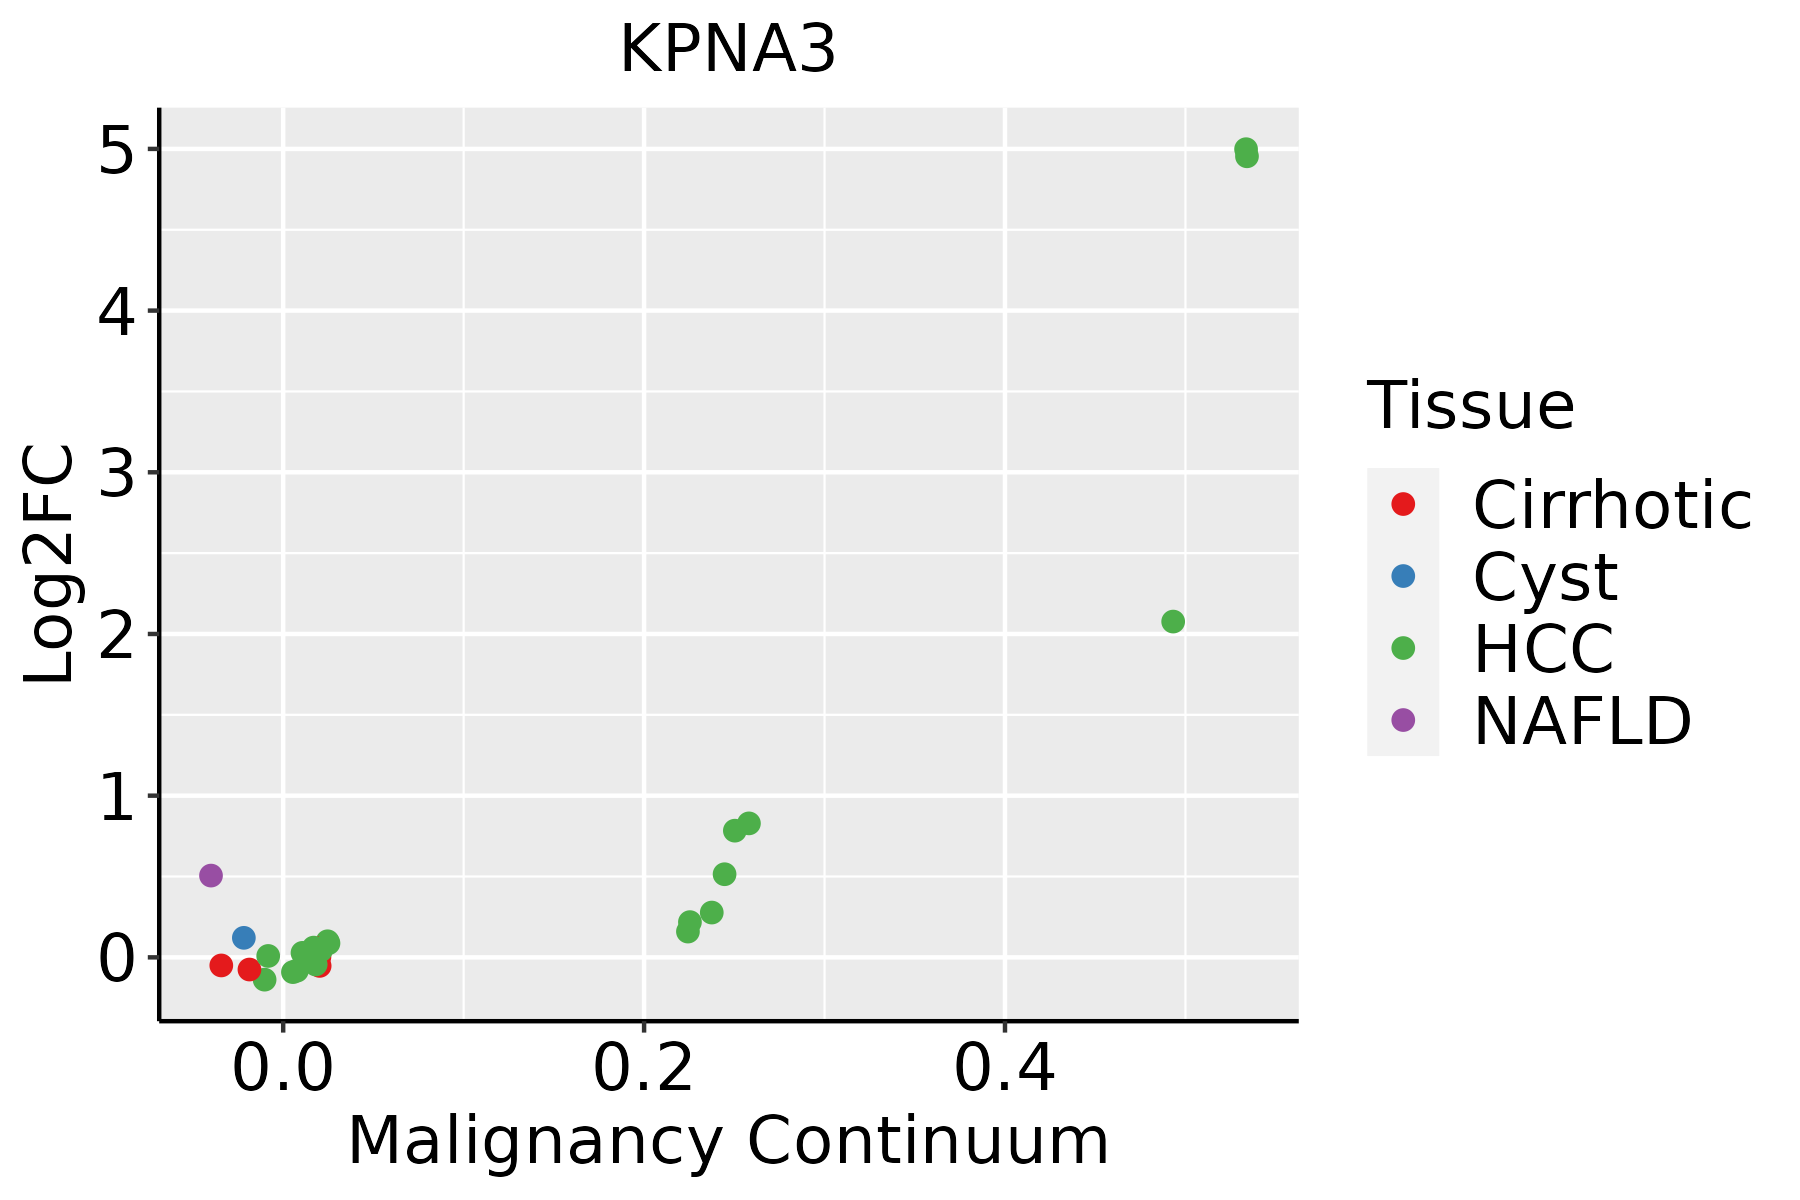 | HCC: Hepatocellular carcinoma |
| NAFLD: Non-alcoholic fatty liver disease | ||
| Lung | 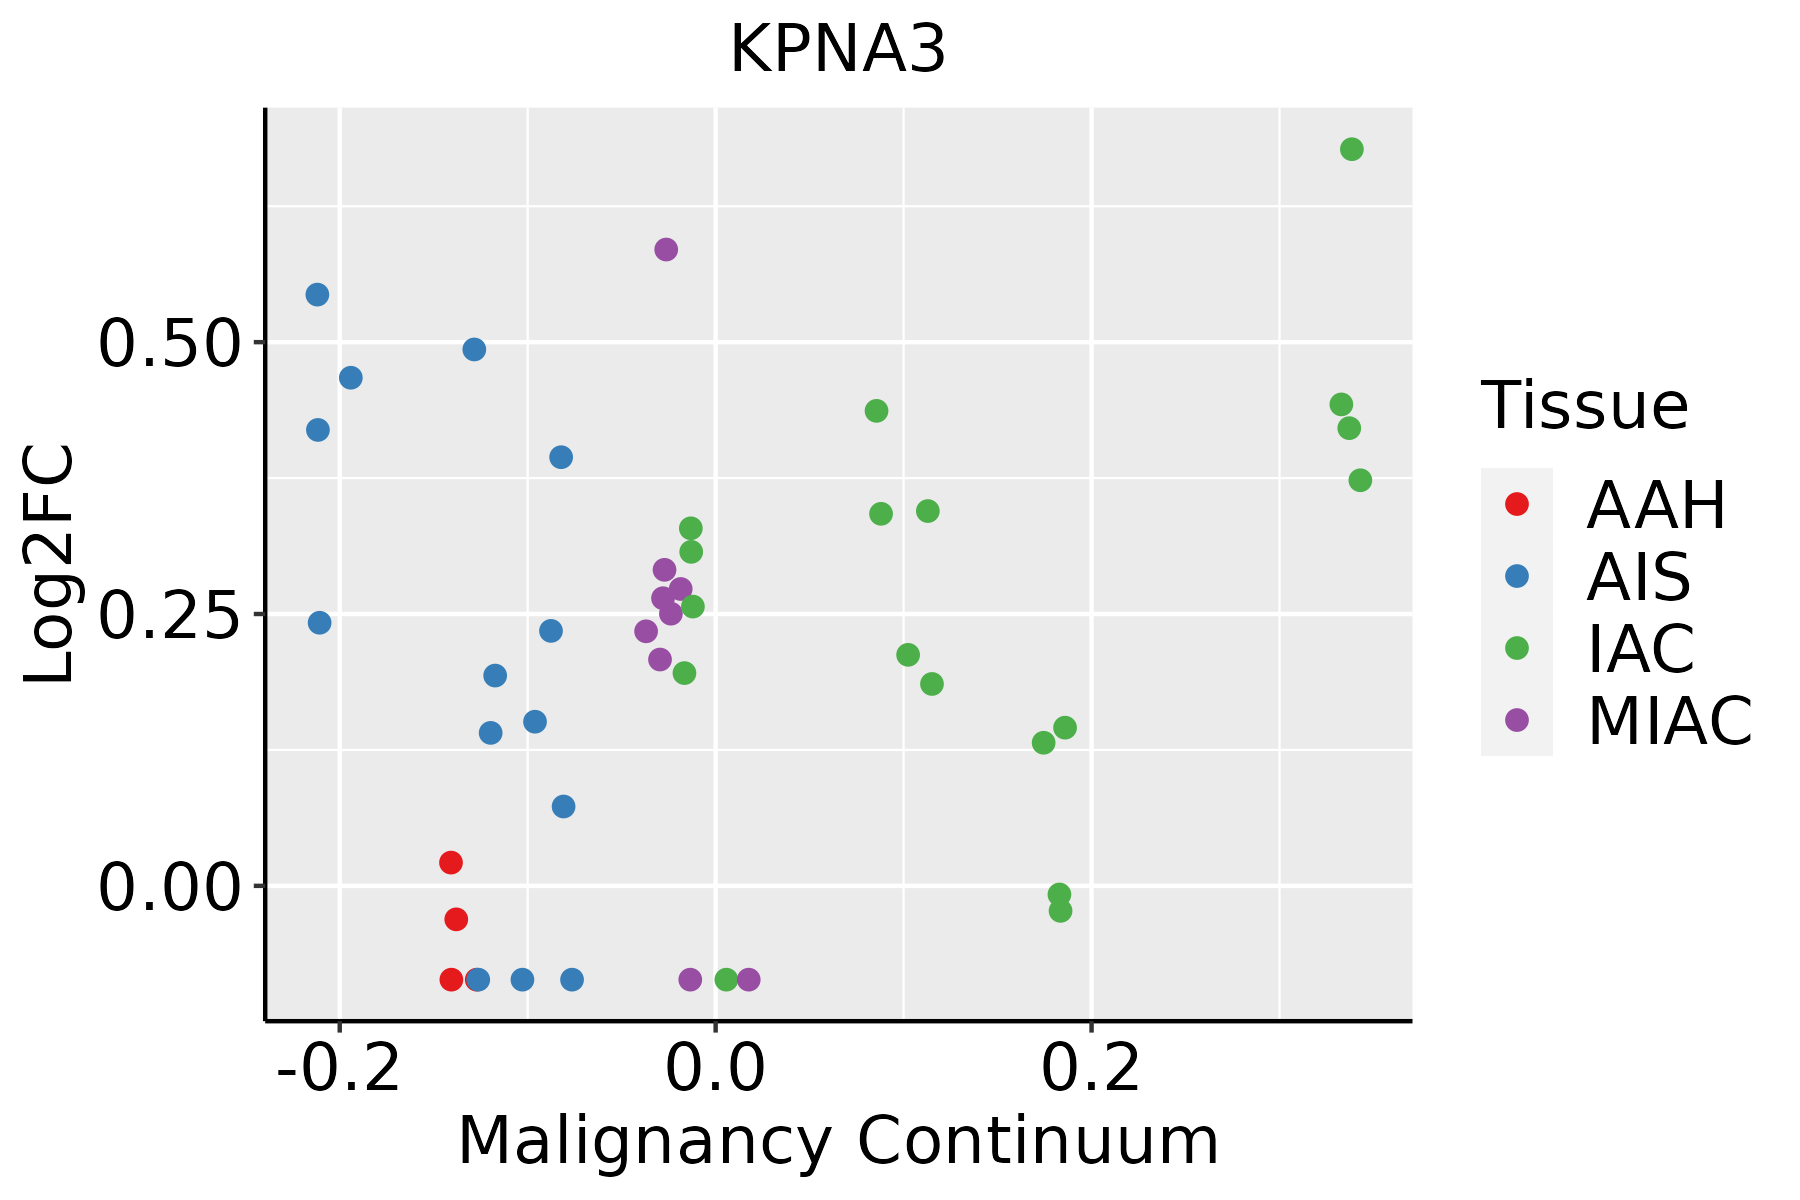 | AAH: Atypical adenomatous hyperplasia |
| AIS: Adenocarcinoma in situ | ||
| IAC: Invasive lung adenocarcinoma | ||
| MIA: Minimally invasive adenocarcinoma | ||
| Oral Cavity |  | EOLP: Erosive Oral lichen planus |
| LP: leukoplakia | ||
| NEOLP: Non-erosive oral lichen planus | ||
| OSCC: Oral squamous cell carcinoma | ||
| Skin |  | AK: Actinic keratosis |
| cSCC: Cutaneous squamous cell carcinoma | ||
| SCCIS:squamous cell carcinoma in situ | ||
| Thyroid | 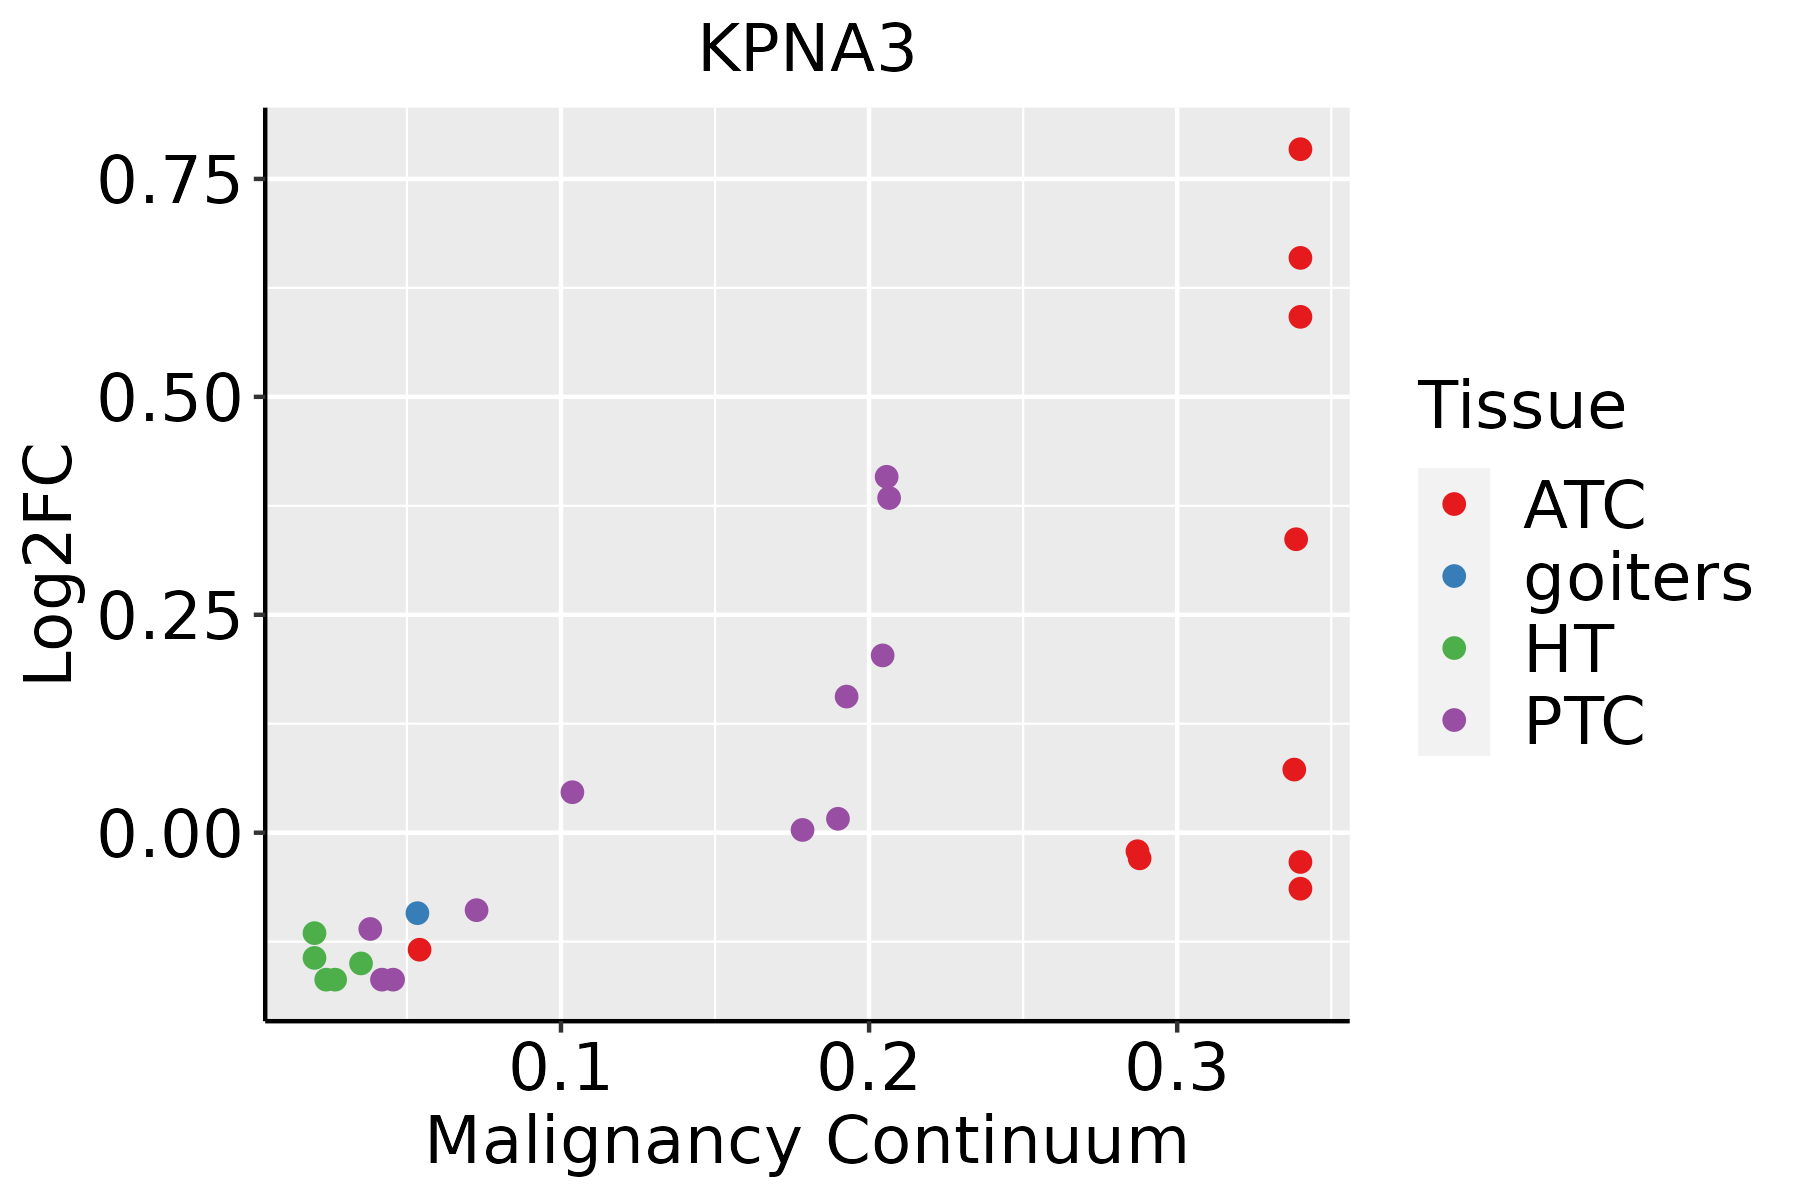 | ATC: Anaplastic thyroid cancer |
| HT: Hashimoto's thyroiditis | ||
| PTC: Papillary thyroid cancer |
| ∗log2FC in expression of this searched gene in stem-like cells from each diseased tissue sample relative to stem-like cells in normal samples in each tissue plotted against the malignancy continuum. Samples are colored based on if they are from different disease stage. |
Top |
Malignant transformation related pathway analysis |
| Find out the enriched GO biological processes and KEGG pathways involved in transition from healthy to precancer to cancer |
| Tissue | Disease Stage | Enriched GO biological Processes |
| Colorectum | AD |  |
| Colorectum | SER |  |
| Colorectum | MSS |  |
| Colorectum | MSI-H |  |
| Colorectum | FAP |  |
| ∗Top 15 enriched GO BP terms are showed in the bar plot of each disease state in each tissue. Each row represents a significant GO biological process which is colored according to the -log10(p.adjust). |
| Page: 1 2 3 4 5 6 7 8 9 |
| GO ID | Tissue | Disease Stage | Description | Gene Ratio | Bg Ratio | pvalue | p.adjust | Count |
| GO:001603210 | Cervix | CC | viral process | 109/2311 | 415/18723 | 5.40e-15 | 6.46e-12 | 109 |
| GO:001905810 | Cervix | CC | viral life cycle | 87/2311 | 317/18723 | 2.20e-13 | 1.20e-10 | 87 |
| GO:00725949 | Cervix | CC | establishment of protein localization to organelle | 99/2311 | 422/18723 | 1.23e-10 | 2.11e-08 | 99 |
| GO:005212610 | Cervix | CC | movement in host environment | 52/2311 | 175/18723 | 7.03e-10 | 8.76e-08 | 52 |
| GO:004440910 | Cervix | CC | entry into host | 47/2311 | 151/18723 | 8.45e-10 | 1.03e-07 | 47 |
| GO:005170110 | Cervix | CC | biological process involved in interaction with host | 57/2311 | 203/18723 | 1.18e-09 | 1.41e-07 | 57 |
| GO:004671810 | Cervix | CC | viral entry into host cell | 44/2311 | 144/18723 | 5.47e-09 | 5.03e-07 | 44 |
| GO:004440310 | Cervix | CC | biological process involved in symbiotic interaction | 71/2311 | 290/18723 | 7.94e-09 | 6.98e-07 | 71 |
| GO:00069139 | Cervix | CC | nucleocytoplasmic transport | 71/2311 | 301/18723 | 4.04e-08 | 2.54e-06 | 71 |
| GO:00511699 | Cervix | CC | nuclear transport | 71/2311 | 301/18723 | 4.04e-08 | 2.54e-06 | 71 |
| GO:00345048 | Cervix | CC | protein localization to nucleus | 68/2311 | 290/18723 | 9.91e-08 | 5.25e-06 | 68 |
| GO:00170388 | Cervix | CC | protein import | 48/2311 | 206/18723 | 8.62e-06 | 1.98e-04 | 48 |
| GO:00511707 | Cervix | CC | import into nucleus | 38/2311 | 159/18723 | 3.98e-05 | 6.18e-04 | 38 |
| GO:00066067 | Cervix | CC | protein import into nucleus | 37/2311 | 155/18723 | 5.13e-05 | 7.71e-04 | 37 |
| GO:00447662 | Cervix | CC | multi-organism transport | 7/2311 | 21/18723 | 1.04e-02 | 4.97e-02 | 7 |
| GO:19025792 | Cervix | CC | multi-organism localization | 7/2311 | 21/18723 | 1.04e-02 | 4.97e-02 | 7 |
| GO:0016032 | Colorectum | AD | viral process | 168/3918 | 415/18723 | 4.67e-20 | 3.66e-17 | 168 |
| GO:0019058 | Colorectum | AD | viral life cycle | 119/3918 | 317/18723 | 6.18e-12 | 8.23e-10 | 119 |
| GO:0072594 | Colorectum | AD | establishment of protein localization to organelle | 148/3918 | 422/18723 | 7.95e-12 | 1.04e-09 | 148 |
| GO:0006913 | Colorectum | AD | nucleocytoplasmic transport | 102/3918 | 301/18723 | 1.00e-07 | 4.85e-06 | 102 |
| Page: 1 2 3 4 5 6 7 8 9 10 11 |
| Pathway ID | Tissue | Disease Stage | Description | Gene Ratio | Bg Ratio | pvalue | p.adjust | qvalue | Count |
| hsa0513220 | Cervix | CC | Salmonella infection | 74/1267 | 249/8465 | 1.33e-09 | 2.54e-08 | 1.50e-08 | 74 |
| hsa05132110 | Cervix | CC | Salmonella infection | 74/1267 | 249/8465 | 1.33e-09 | 2.54e-08 | 1.50e-08 | 74 |
| hsa05132 | Colorectum | AD | Salmonella infection | 102/2092 | 249/8465 | 7.65e-09 | 1.28e-07 | 8.17e-08 | 102 |
| hsa051321 | Colorectum | AD | Salmonella infection | 102/2092 | 249/8465 | 7.65e-09 | 1.28e-07 | 8.17e-08 | 102 |
| hsa051324 | Colorectum | MSS | Salmonella infection | 92/1875 | 249/8465 | 5.23e-08 | 9.74e-07 | 5.97e-07 | 92 |
| hsa051325 | Colorectum | MSS | Salmonella infection | 92/1875 | 249/8465 | 5.23e-08 | 9.74e-07 | 5.97e-07 | 92 |
| hsa051328 | Colorectum | FAP | Salmonella infection | 67/1404 | 249/8465 | 2.04e-05 | 2.52e-04 | 1.53e-04 | 67 |
| hsa051329 | Colorectum | FAP | Salmonella infection | 67/1404 | 249/8465 | 2.04e-05 | 2.52e-04 | 1.53e-04 | 67 |
| hsa0513210 | Colorectum | CRC | Salmonella infection | 48/1091 | 249/8465 | 2.43e-03 | 1.69e-02 | 1.15e-02 | 48 |
| hsa05207 | Colorectum | CRC | Chemical carcinogenesis - receptor activation | 42/1091 | 212/8465 | 2.62e-03 | 1.75e-02 | 1.19e-02 | 42 |
| hsa0513211 | Colorectum | CRC | Salmonella infection | 48/1091 | 249/8465 | 2.43e-03 | 1.69e-02 | 1.15e-02 | 48 |
| hsa052071 | Colorectum | CRC | Chemical carcinogenesis - receptor activation | 42/1091 | 212/8465 | 2.62e-03 | 1.75e-02 | 1.19e-02 | 42 |
| hsa05132211 | Esophagus | ESCC | Salmonella infection | 191/4205 | 249/8465 | 6.51e-19 | 5.45e-17 | 2.79e-17 | 191 |
| hsa0301321 | Esophagus | ESCC | Nucleocytoplasmic transport | 89/4205 | 108/8465 | 1.20e-12 | 2.37e-11 | 1.21e-11 | 89 |
| hsa05132310 | Esophagus | ESCC | Salmonella infection | 191/4205 | 249/8465 | 6.51e-19 | 5.45e-17 | 2.79e-17 | 191 |
| hsa0301331 | Esophagus | ESCC | Nucleocytoplasmic transport | 89/4205 | 108/8465 | 1.20e-12 | 2.37e-11 | 1.21e-11 | 89 |
| hsa0513214 | Liver | NAFLD | Salmonella infection | 55/1043 | 249/8465 | 8.48e-06 | 3.09e-04 | 2.49e-04 | 55 |
| hsa0513215 | Liver | NAFLD | Salmonella infection | 55/1043 | 249/8465 | 8.48e-06 | 3.09e-04 | 2.49e-04 | 55 |
| hsa0513242 | Liver | HCC | Salmonella infection | 178/4020 | 249/8465 | 5.90e-15 | 1.98e-13 | 1.10e-13 | 178 |
| hsa03013 | Liver | HCC | Nucleocytoplasmic transport | 81/4020 | 108/8465 | 4.28e-09 | 6.83e-08 | 3.80e-08 | 81 |
| Page: 1 2 |
Top |
Cell-cell communication analysis |
| Identification of potential cell-cell interactions between two cell types and their ligand-receptor pairs for different disease states |
| Ligand | Receptor | LRpair | Pathway | Tissue | Disease Stage |
| Page: 1 |
Top |
Single-cell gene regulatory network inference analysis |
| Find out the significant the regulons (TFs) and the target genes of each regulon across cell types for different disease states |
| TF | Cell Type | Tissue | Disease Stage | Target Gene | RSS | Regulon Activity |
| ∗The dot plots of a searched regulon are shown for all cell subpopulations in each disease state of each tissue based on the regulon specific score inferred using pySCENIC and by calculating the average expression. |
| Page: 1 |
Top |
Somatic mutation of malignant transformation related genes |
| Annotation of somatic variants for genes involved in malignant transformation |
| Hugo Symbol | Variant Class | Variant Classification | dbSNP RS | HGVSc | HGVSp | HGVSp Short | SWISSPROT | BIOTYPE | SIFT | PolyPhen | Tumor Sample Barcode | Tissue | Histology | Sex | Age | Stage | Therapy Types | Drugs | Outcome |
| KPNA3 | SNV | Missense_Mutation | novel | c.496N>G | p.Leu166Val | p.L166V | O00505 | protein_coding | tolerated(0.05) | probably_damaging(1) | TCGA-5L-AAT0-01 | Breast | breast invasive carcinoma | Female | <65 | I/II | Hormone Therapy | tamoxiphen | SD |
| KPNA3 | SNV | Missense_Mutation | c.1347A>G | p.Ile449Met | p.I449M | O00505 | protein_coding | tolerated(0.08) | possibly_damaging(0.646) | TCGA-AN-A0AK-01 | Breast | breast invasive carcinoma | Female | >=65 | I/II | Unknown | Unknown | SD | |
| KPNA3 | SNV | Missense_Mutation | novel | c.1471G>A | p.Asp491Asn | p.D491N | O00505 | protein_coding | deleterious(0.04) | benign(0.013) | TCGA-BH-A18P-01 | Breast | breast invasive carcinoma | Female | <65 | I/II | Unknown | Unknown | PD |
| KPNA3 | SNV | Missense_Mutation | novel | c.413N>T | p.Ala138Val | p.A138V | O00505 | protein_coding | deleterious(0.03) | probably_damaging(1) | TCGA-BH-A1FC-01 | Breast | breast invasive carcinoma | Female | >=65 | I/II | Unknown | Unknown | SD |
| KPNA3 | SNV | Missense_Mutation | c.7N>A | p.Glu3Lys | p.E3K | O00505 | protein_coding | deleterious(0.04) | benign(0.054) | TCGA-DR-A0ZM-01 | Cervix | cervical & endocervical cancer | Female | <65 | III/IV | Unspecific | Cisplatin | SD | |
| KPNA3 | SNV | Missense_Mutation | c.807N>C | p.Leu269Phe | p.L269F | O00505 | protein_coding | deleterious(0.01) | probably_damaging(0.995) | TCGA-EK-A3GK-01 | Cervix | cervical & endocervical cancer | Female | <65 | I/II | Unknown | Unknown | SD | |
| KPNA3 | SNV | Missense_Mutation | c.11N>C | p.Asn4Thr | p.N4T | O00505 | protein_coding | tolerated(0.18) | benign(0.084) | TCGA-FU-A3HZ-01 | Cervix | cervical & endocervical cancer | Female | <65 | I/II | Chemotherapy | cisplatin | CR | |
| KPNA3 | SNV | Missense_Mutation | c.1525G>C | p.Asp509His | p.D509H | O00505 | protein_coding | tolerated(0.06) | possibly_damaging(0.548) | TCGA-IR-A3LA-01 | Cervix | cervical & endocervical cancer | Female | <65 | I/II | Chemotherapy | cisplatin | CR | |
| KPNA3 | SNV | Missense_Mutation | c.755A>G | p.Tyr252Cys | p.Y252C | O00505 | protein_coding | deleterious(0.02) | possibly_damaging(0.84) | TCGA-CM-5348-01 | Colorectum | colon adenocarcinoma | Male | >=65 | III/IV | Unknown | Unknown | SD | |
| KPNA3 | SNV | Missense_Mutation | c.1324N>A | p.Ala442Thr | p.A442T | O00505 | protein_coding | deleterious(0.01) | probably_damaging(0.993) | TCGA-QG-A5Z2-01 | Colorectum | colon adenocarcinoma | Male | <65 | I/II | Unknown | Unknown | SD |
| Page: 1 2 3 4 5 6 |
Top |
Related drugs of malignant transformation related genes |
| Identification of chemicals and drugs interact with genes involved in malignant transfromation |
| (DGIdb 4.0) |
| Entrez ID | Symbol | Category | Interaction Types | Drug Claim Name | Drug Name | PMIDs |
| Page: 1 |

Copyright 2023-Present -The University of Texas Health Science Center at Houston |