
|
|||||
|
 | |
| |
| |
| |
| |
| |
|
Gene: KPNA1 |
Gene summary for KPNA1 |
| Gene information | Species | Human | Gene symbol | KPNA1 | Gene ID | 3836 |
| Gene name | karyopherin subunit alpha 1 | |
| Gene Alias | IPOA5 | |
| Cytomap | 3q21.1 | |
| Gene Type | protein-coding | GO ID | GO:0000018 | UniProtAcc | P52294 |
Top |
Malignant transformation analysis |
| Identification of the aberrant gene expression in precancerous and cancerous lesions by comparing the gene expression of stem-like cells in diseased tissues with normal stem cells |
| Entrez ID | Symbol | Replicates | Species | Organ | Tissue | Adj P-value | Log2FC | Malignancy |
| 3836 | KPNA1 | CCI_1 | Human | Cervix | CC | 8.15e-08 | 9.72e-01 | 0.528 |
| 3836 | KPNA1 | CCI_2 | Human | Cervix | CC | 9.86e-10 | 1.08e+00 | 0.5249 |
| 3836 | KPNA1 | CCI_3 | Human | Cervix | CC | 2.46e-18 | 1.17e+00 | 0.516 |
| 3836 | KPNA1 | sample3 | Human | Cervix | CC | 8.01e-05 | 1.31e-01 | 0.1387 |
| 3836 | KPNA1 | HTA11_3410_2000001011 | Human | Colorectum | AD | 1.13e-05 | -3.86e-01 | 0.0155 |
| 3836 | KPNA1 | HTA11_3361_2000001011 | Human | Colorectum | AD | 3.29e-03 | -4.53e-01 | -0.1207 |
| 3836 | KPNA1 | HTA11_696_2000001011 | Human | Colorectum | AD | 7.07e-05 | -3.42e-01 | -0.1464 |
| 3836 | KPNA1 | HTA11_866_3004761011 | Human | Colorectum | AD | 3.13e-03 | -3.68e-01 | 0.096 |
| 3836 | KPNA1 | HTA11_10711_2000001011 | Human | Colorectum | AD | 1.18e-02 | -4.05e-01 | 0.0338 |
| 3836 | KPNA1 | HTA11_7696_3000711011 | Human | Colorectum | AD | 1.95e-09 | -3.77e-01 | 0.0674 |
| 3836 | KPNA1 | HTA11_99999970781_79442 | Human | Colorectum | MSS | 6.97e-05 | -2.89e-01 | 0.294 |
| 3836 | KPNA1 | HTA11_99999971662_82457 | Human | Colorectum | MSS | 1.18e-02 | -2.74e-01 | 0.3859 |
| 3836 | KPNA1 | HTA11_99999974143_84620 | Human | Colorectum | MSS | 4.13e-10 | -4.19e-01 | 0.3005 |
| 3836 | KPNA1 | A002-C-010 | Human | Colorectum | FAP | 2.75e-02 | -1.77e-01 | 0.242 |
| 3836 | KPNA1 | A001-C-207 | Human | Colorectum | FAP | 8.46e-05 | -3.47e-01 | 0.1278 |
| 3836 | KPNA1 | A015-C-203 | Human | Colorectum | FAP | 1.98e-19 | -3.86e-01 | -0.1294 |
| 3836 | KPNA1 | A015-C-204 | Human | Colorectum | FAP | 5.18e-05 | -2.69e-01 | -0.0228 |
| 3836 | KPNA1 | A014-C-040 | Human | Colorectum | FAP | 1.22e-02 | -3.93e-01 | -0.1184 |
| 3836 | KPNA1 | A002-C-201 | Human | Colorectum | FAP | 3.55e-08 | -2.66e-01 | 0.0324 |
| 3836 | KPNA1 | A002-C-203 | Human | Colorectum | FAP | 1.34e-08 | -2.61e-01 | 0.2786 |
| Page: 1 2 3 4 5 6 7 8 9 |
| Tissue | Expression Dynamics | Abbreviation |
| Cervix |  | CC: Cervix cancer |
| HSIL_HPV: HPV-infected high-grade squamous intraepithelial lesions | ||
| N_HPV: HPV-infected normal cervix | ||
| Colorectum (GSE201348) |  | FAP: Familial adenomatous polyposis |
| CRC: Colorectal cancer | ||
| Colorectum (HTA11) |  | AD: Adenomas |
| SER: Sessile serrated lesions | ||
| MSI-H: Microsatellite-high colorectal cancer | ||
| MSS: Microsatellite stable colorectal cancer | ||
| Esophagus |  | ESCC: Esophageal squamous cell carcinoma |
| HGIN: High-grade intraepithelial neoplasias | ||
| LGIN: Low-grade intraepithelial neoplasias | ||
| Liver |  | HCC: Hepatocellular carcinoma |
| NAFLD: Non-alcoholic fatty liver disease | ||
| Lung |  | AAH: Atypical adenomatous hyperplasia |
| AIS: Adenocarcinoma in situ | ||
| IAC: Invasive lung adenocarcinoma | ||
| MIA: Minimally invasive adenocarcinoma | ||
| Oral Cavity |  | EOLP: Erosive Oral lichen planus |
| LP: leukoplakia | ||
| NEOLP: Non-erosive oral lichen planus | ||
| OSCC: Oral squamous cell carcinoma | ||
| Prostate |  | BPH: Benign Prostatic Hyperplasia |
| Skin |  | AK: Actinic keratosis |
| cSCC: Cutaneous squamous cell carcinoma | ||
| SCCIS:squamous cell carcinoma in situ | ||
| Thyroid | 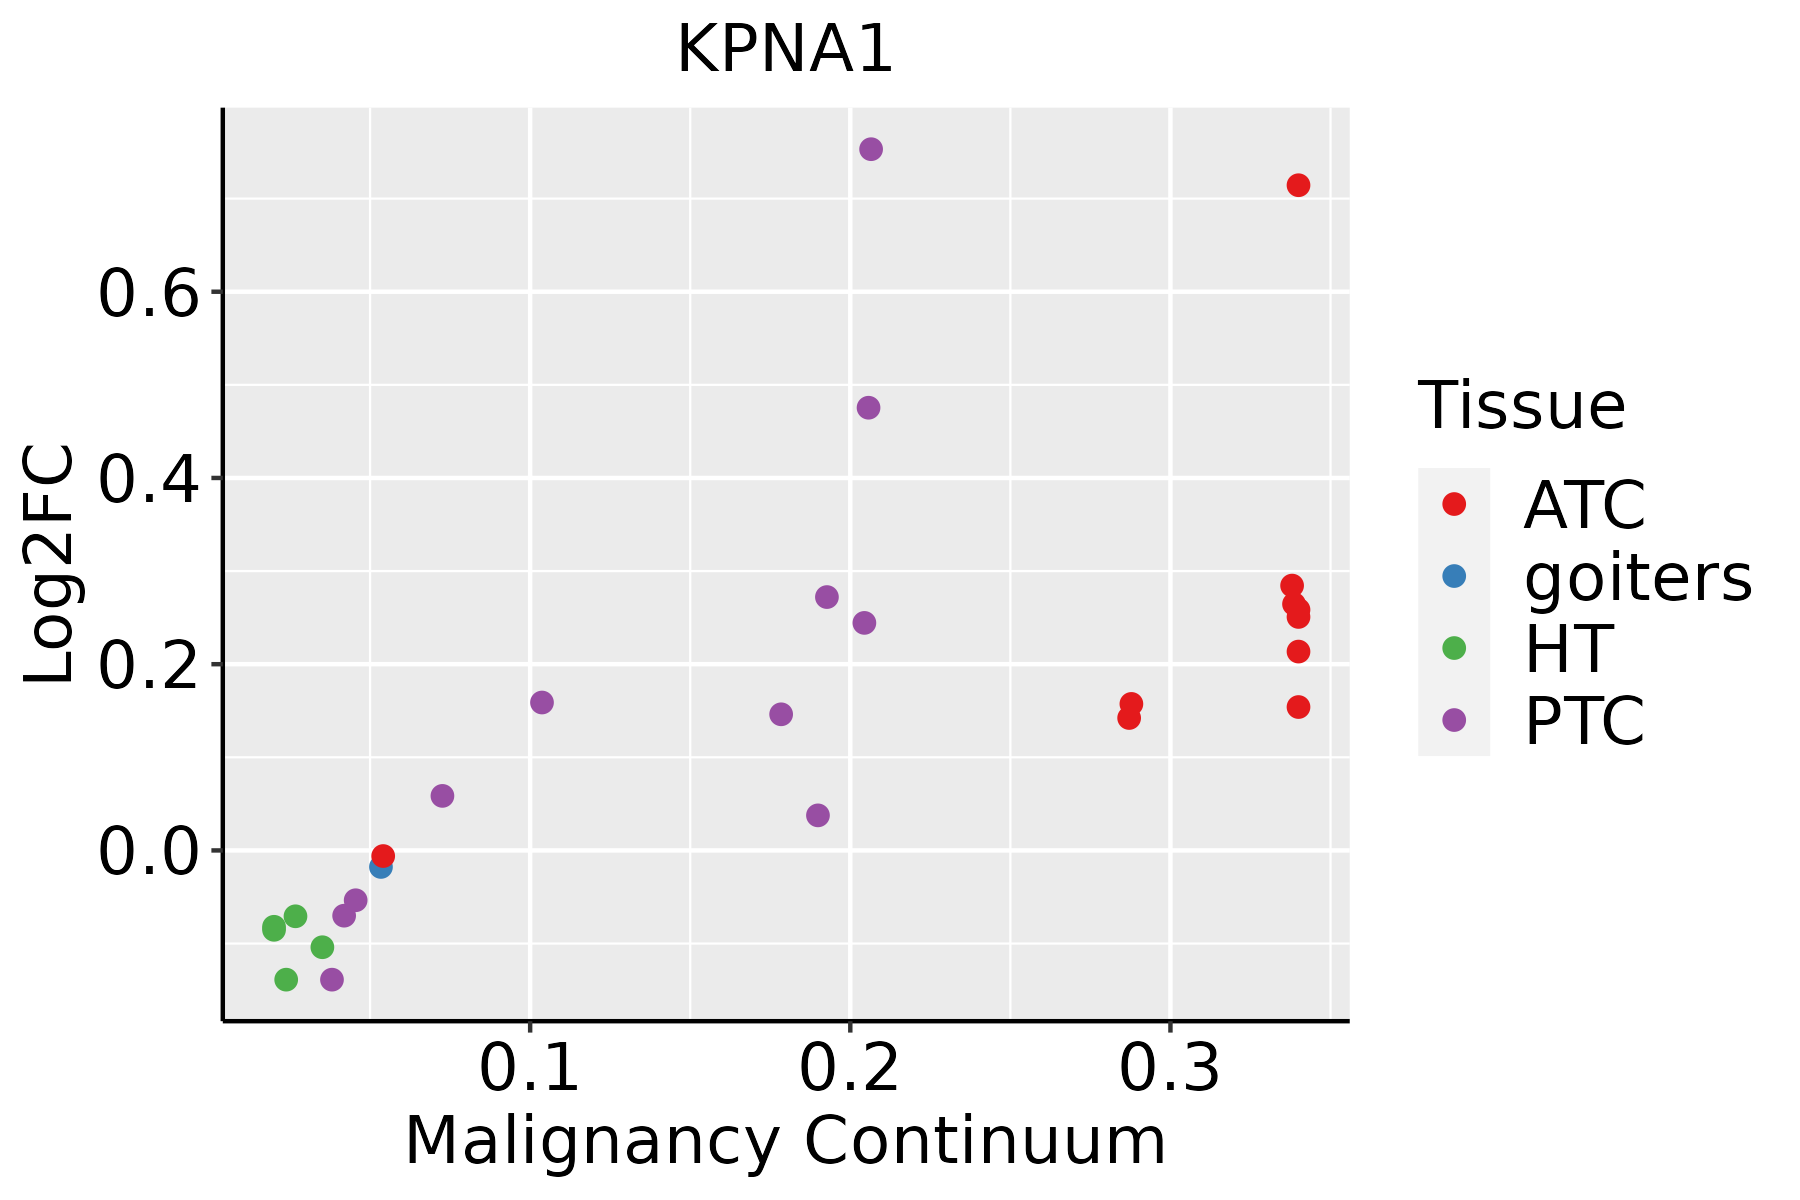 | ATC: Anaplastic thyroid cancer |
| HT: Hashimoto's thyroiditis | ||
| PTC: Papillary thyroid cancer |
| ∗log2FC in expression of this searched gene in stem-like cells from each diseased tissue sample relative to stem-like cells in normal samples in each tissue plotted against the malignancy continuum. Samples are colored based on if they are from different disease stage. |
Top |
Malignant transformation related pathway analysis |
| Find out the enriched GO biological processes and KEGG pathways involved in transition from healthy to precancer to cancer |
| Tissue | Disease Stage | Enriched GO biological Processes |
| Colorectum | AD |  |
| Colorectum | SER |  |
| Colorectum | MSS |  |
| Colorectum | MSI-H |  |
| Colorectum | FAP |  |
| ∗Top 15 enriched GO BP terms are showed in the bar plot of each disease state in each tissue. Each row represents a significant GO biological process which is colored according to the -log10(p.adjust). |
| Page: 1 2 3 4 5 6 7 8 9 |
| GO ID | Tissue | Disease Stage | Description | Gene Ratio | Bg Ratio | pvalue | p.adjust | Count |
| GO:00725949 | Cervix | CC | establishment of protein localization to organelle | 99/2311 | 422/18723 | 1.23e-10 | 2.11e-08 | 99 |
| GO:00160557 | Cervix | CC | Wnt signaling pathway | 98/2311 | 444/18723 | 4.82e-09 | 4.65e-07 | 98 |
| GO:01987387 | Cervix | CC | cell-cell signaling by wnt | 98/2311 | 446/18723 | 6.16e-09 | 5.58e-07 | 98 |
| GO:00301117 | Cervix | CC | regulation of Wnt signaling pathway | 76/2311 | 328/18723 | 3.05e-08 | 2.08e-06 | 76 |
| GO:00069139 | Cervix | CC | nucleocytoplasmic transport | 71/2311 | 301/18723 | 4.04e-08 | 2.54e-06 | 71 |
| GO:00511699 | Cervix | CC | nuclear transport | 71/2311 | 301/18723 | 4.04e-08 | 2.54e-06 | 71 |
| GO:00345048 | Cervix | CC | protein localization to nucleus | 68/2311 | 290/18723 | 9.91e-08 | 5.25e-06 | 68 |
| GO:00608287 | Cervix | CC | regulation of canonical Wnt signaling pathway | 58/2311 | 253/18723 | 1.83e-06 | 5.89e-05 | 58 |
| GO:00600707 | Cervix | CC | canonical Wnt signaling pathway | 66/2311 | 303/18723 | 2.47e-06 | 7.35e-05 | 66 |
| GO:00170388 | Cervix | CC | protein import | 48/2311 | 206/18723 | 8.62e-06 | 1.98e-04 | 48 |
| GO:00310996 | Cervix | CC | regeneration | 46/2311 | 198/18723 | 1.43e-05 | 2.84e-04 | 46 |
| GO:00511707 | Cervix | CC | import into nucleus | 38/2311 | 159/18723 | 3.98e-05 | 6.18e-04 | 38 |
| GO:00066067 | Cervix | CC | protein import into nucleus | 37/2311 | 155/18723 | 5.13e-05 | 7.71e-04 | 37 |
| GO:0033002 | Cervix | CC | muscle cell proliferation | 49/2311 | 248/18723 | 5.43e-04 | 5.24e-03 | 49 |
| GO:0042246 | Cervix | CC | tissue regeneration | 19/2311 | 72/18723 | 9.11e-04 | 7.81e-03 | 19 |
| GO:00510528 | Cervix | CC | regulation of DNA metabolic process | 65/2311 | 359/18723 | 9.25e-04 | 7.84e-03 | 65 |
| GO:00434032 | Cervix | CC | skeletal muscle tissue regeneration | 12/2311 | 37/18723 | 1.15e-03 | 9.39e-03 | 12 |
| GO:0014855 | Cervix | CC | striated muscle cell proliferation | 18/2311 | 76/18723 | 4.45e-03 | 2.71e-02 | 18 |
| GO:0072594 | Colorectum | AD | establishment of protein localization to organelle | 148/3918 | 422/18723 | 7.95e-12 | 1.04e-09 | 148 |
| GO:0006913 | Colorectum | AD | nucleocytoplasmic transport | 102/3918 | 301/18723 | 1.00e-07 | 4.85e-06 | 102 |
| Page: 1 2 3 4 5 6 7 8 9 10 11 12 13 14 15 16 |
| Pathway ID | Tissue | Disease Stage | Description | Gene Ratio | Bg Ratio | pvalue | p.adjust | qvalue | Count |
| hsa0513220 | Cervix | CC | Salmonella infection | 74/1267 | 249/8465 | 1.33e-09 | 2.54e-08 | 1.50e-08 | 74 |
| hsa0516414 | Cervix | CC | Influenza A | 43/1267 | 171/8465 | 3.03e-04 | 1.64e-03 | 9.68e-04 | 43 |
| hsa05132110 | Cervix | CC | Salmonella infection | 74/1267 | 249/8465 | 1.33e-09 | 2.54e-08 | 1.50e-08 | 74 |
| hsa0516415 | Cervix | CC | Influenza A | 43/1267 | 171/8465 | 3.03e-04 | 1.64e-03 | 9.68e-04 | 43 |
| hsa05132 | Colorectum | AD | Salmonella infection | 102/2092 | 249/8465 | 7.65e-09 | 1.28e-07 | 8.17e-08 | 102 |
| hsa051321 | Colorectum | AD | Salmonella infection | 102/2092 | 249/8465 | 7.65e-09 | 1.28e-07 | 8.17e-08 | 102 |
| hsa051324 | Colorectum | MSS | Salmonella infection | 92/1875 | 249/8465 | 5.23e-08 | 9.74e-07 | 5.97e-07 | 92 |
| hsa051325 | Colorectum | MSS | Salmonella infection | 92/1875 | 249/8465 | 5.23e-08 | 9.74e-07 | 5.97e-07 | 92 |
| hsa051328 | Colorectum | FAP | Salmonella infection | 67/1404 | 249/8465 | 2.04e-05 | 2.52e-04 | 1.53e-04 | 67 |
| hsa051329 | Colorectum | FAP | Salmonella infection | 67/1404 | 249/8465 | 2.04e-05 | 2.52e-04 | 1.53e-04 | 67 |
| hsa0513210 | Colorectum | CRC | Salmonella infection | 48/1091 | 249/8465 | 2.43e-03 | 1.69e-02 | 1.15e-02 | 48 |
| hsa05207 | Colorectum | CRC | Chemical carcinogenesis - receptor activation | 42/1091 | 212/8465 | 2.62e-03 | 1.75e-02 | 1.19e-02 | 42 |
| hsa0513211 | Colorectum | CRC | Salmonella infection | 48/1091 | 249/8465 | 2.43e-03 | 1.69e-02 | 1.15e-02 | 48 |
| hsa052071 | Colorectum | CRC | Chemical carcinogenesis - receptor activation | 42/1091 | 212/8465 | 2.62e-03 | 1.75e-02 | 1.19e-02 | 42 |
| hsa05132211 | Esophagus | ESCC | Salmonella infection | 191/4205 | 249/8465 | 6.51e-19 | 5.45e-17 | 2.79e-17 | 191 |
| hsa0301321 | Esophagus | ESCC | Nucleocytoplasmic transport | 89/4205 | 108/8465 | 1.20e-12 | 2.37e-11 | 1.21e-11 | 89 |
| hsa0516425 | Esophagus | ESCC | Influenza A | 122/4205 | 171/8465 | 5.01e-09 | 4.79e-08 | 2.45e-08 | 122 |
| hsa05132310 | Esophagus | ESCC | Salmonella infection | 191/4205 | 249/8465 | 6.51e-19 | 5.45e-17 | 2.79e-17 | 191 |
| hsa0301331 | Esophagus | ESCC | Nucleocytoplasmic transport | 89/4205 | 108/8465 | 1.20e-12 | 2.37e-11 | 1.21e-11 | 89 |
| hsa0516435 | Esophagus | ESCC | Influenza A | 122/4205 | 171/8465 | 5.01e-09 | 4.79e-08 | 2.45e-08 | 122 |
| Page: 1 2 3 4 |
Top |
Cell-cell communication analysis |
| Identification of potential cell-cell interactions between two cell types and their ligand-receptor pairs for different disease states |
| Ligand | Receptor | LRpair | Pathway | Tissue | Disease Stage |
| Page: 1 |
Top |
Single-cell gene regulatory network inference analysis |
| Find out the significant the regulons (TFs) and the target genes of each regulon across cell types for different disease states |
| TF | Cell Type | Tissue | Disease Stage | Target Gene | RSS | Regulon Activity |
| ∗The dot plots of a searched regulon are shown for all cell subpopulations in each disease state of each tissue based on the regulon specific score inferred using pySCENIC and by calculating the average expression. |
| Page: 1 |
Top |
Somatic mutation of malignant transformation related genes |
| Annotation of somatic variants for genes involved in malignant transformation |
| Hugo Symbol | Variant Class | Variant Classification | dbSNP RS | HGVSc | HGVSp | HGVSp Short | SWISSPROT | BIOTYPE | SIFT | PolyPhen | Tumor Sample Barcode | Tissue | Histology | Sex | Age | Stage | Therapy Types | Drugs | Outcome |
| KPNA1 | SNV | Missense_Mutation | c.349N>A | p.Pro117Thr | p.P117T | P52294 | protein_coding | deleterious(0) | probably_damaging(0.956) | TCGA-A2-A25A-01 | Breast | breast invasive carcinoma | Female | <65 | I/II | Unspecific | Cytoxan | SD | |
| KPNA1 | insertion | Frame_Shift_Ins | novel | c.1311_1312insTA | p.Lys438Ter | p.K438* | P52294 | protein_coding | TCGA-E2-A1LE-01 | Breast | breast invasive carcinoma | Female | >=65 | III/IV | Chemotherapy | herceptin | PD | ||
| KPNA1 | SNV | Missense_Mutation | rs192240632 | c.1082C>T | p.Thr361Met | p.T361M | P52294 | protein_coding | deleterious(0.01) | probably_damaging(0.997) | TCGA-2W-A8YY-01 | Cervix | cervical & endocervical cancer | Female | <65 | I/II | Chemotherapy | cisplatin | CR |
| KPNA1 | SNV | Missense_Mutation | novel | c.1069N>A | p.Glu357Lys | p.E357K | P52294 | protein_coding | deleterious(0) | probably_damaging(0.996) | TCGA-C5-A1MH-01 | Cervix | cervical & endocervical cancer | Female | >=65 | III/IV | Chemotherapy | cisplatin | PD |
| KPNA1 | SNV | Missense_Mutation | c.1183C>T | p.Arg395Trp | p.R395W | P52294 | protein_coding | deleterious(0) | probably_damaging(0.954) | TCGA-DG-A2KH-01 | Cervix | cervical & endocervical cancer | Female | <65 | I/II | Unknown | Unknown | SD | |
| KPNA1 | SNV | Missense_Mutation | c.172N>C | p.Glu58Gln | p.E58Q | P52294 | protein_coding | tolerated(0.37) | benign(0.175) | TCGA-JW-A5VL-01 | Cervix | cervical & endocervical cancer | Female | <65 | I/II | Unknown | Unknown | SD | |
| KPNA1 | SNV | Missense_Mutation | c.564N>T | p.Gln188His | p.Q188H | P52294 | protein_coding | deleterious(0) | probably_damaging(1) | TCGA-AA-3715-01 | Colorectum | colon adenocarcinoma | Male | >=65 | I/II | Unknown | Unknown | PD | |
| KPNA1 | SNV | Missense_Mutation | c.410N>A | p.Arg137Gln | p.R137Q | P52294 | protein_coding | tolerated(0.09) | benign(0.018) | TCGA-AA-3984-01 | Colorectum | colon adenocarcinoma | Female | <65 | I/II | Unknown | Unknown | SD | |
| KPNA1 | SNV | Missense_Mutation | rs764619803 | c.884N>T | p.Ala295Val | p.A295V | P52294 | protein_coding | tolerated(0.05) | benign(0.068) | TCGA-AA-A01R-01 | Colorectum | colon adenocarcinoma | Male | <65 | III/IV | Chemotherapy | 5-fluorouracil | PD |
| KPNA1 | SNV | Missense_Mutation | c.98N>G | p.Leu33Arg | p.L33R | P52294 | protein_coding | deleterious(0) | possibly_damaging(0.866) | TCGA-F4-6703-01 | Colorectum | colon adenocarcinoma | Male | <65 | I/II | Unknown | Unknown | SD |
| Page: 1 2 3 4 5 6 7 |
Top |
Related drugs of malignant transformation related genes |
| Identification of chemicals and drugs interact with genes involved in malignant transfromation |
| (DGIdb 4.0) |
| Entrez ID | Symbol | Category | Interaction Types | Drug Claim Name | Drug Name | PMIDs |
| Page: 1 |

Copyright 2023-Present -The University of Texas Health Science Center at Houston |