
|
|||||
|
 | |
| |
| |
| |
| |
| |
|
Gene: KNSTRN |
Gene summary for KNSTRN |
| Gene information | Species | Human | Gene symbol | KNSTRN | Gene ID | 90417 |
| Gene name | kinetochore localized astrin (SPAG5) binding protein | |
| Gene Alias | C15orf23 | |
| Cytomap | 15q15.1 | |
| Gene Type | protein-coding | GO ID | GO:0000070 | UniProtAcc | Q9Y448 |
Top |
Malignant transformation analysis |
| Identification of the aberrant gene expression in precancerous and cancerous lesions by comparing the gene expression of stem-like cells in diseased tissues with normal stem cells |
| Entrez ID | Symbol | Replicates | Species | Organ | Tissue | Adj P-value | Log2FC | Malignancy |
| 90417 | KNSTRN | LZE2T | Human | Esophagus | ESCC | 3.67e-03 | 8.41e-01 | 0.082 |
| 90417 | KNSTRN | P2T-E | Human | Esophagus | ESCC | 7.53e-06 | 2.07e-01 | 0.1177 |
| 90417 | KNSTRN | P4T-E | Human | Esophagus | ESCC | 1.25e-09 | 3.83e-01 | 0.1323 |
| 90417 | KNSTRN | P5T-E | Human | Esophagus | ESCC | 3.52e-19 | 3.81e-01 | 0.1327 |
| 90417 | KNSTRN | P8T-E | Human | Esophagus | ESCC | 9.44e-07 | 1.43e-01 | 0.0889 |
| 90417 | KNSTRN | P9T-E | Human | Esophagus | ESCC | 3.83e-03 | 2.51e-01 | 0.1131 |
| 90417 | KNSTRN | P10T-E | Human | Esophagus | ESCC | 1.28e-10 | 2.93e-01 | 0.116 |
| 90417 | KNSTRN | P12T-E | Human | Esophagus | ESCC | 1.88e-04 | 1.44e-01 | 0.1122 |
| 90417 | KNSTRN | P15T-E | Human | Esophagus | ESCC | 3.08e-05 | 2.00e-01 | 0.1149 |
| 90417 | KNSTRN | P16T-E | Human | Esophagus | ESCC | 3.75e-03 | 1.26e-01 | 0.1153 |
| 90417 | KNSTRN | P20T-E | Human | Esophagus | ESCC | 2.72e-03 | 1.75e-01 | 0.1124 |
| 90417 | KNSTRN | P21T-E | Human | Esophagus | ESCC | 4.12e-11 | 2.85e-01 | 0.1617 |
| 90417 | KNSTRN | P22T-E | Human | Esophagus | ESCC | 1.76e-12 | 2.92e-01 | 0.1236 |
| 90417 | KNSTRN | P23T-E | Human | Esophagus | ESCC | 1.82e-04 | 1.64e-01 | 0.108 |
| 90417 | KNSTRN | P24T-E | Human | Esophagus | ESCC | 8.56e-12 | 2.88e-01 | 0.1287 |
| 90417 | KNSTRN | P26T-E | Human | Esophagus | ESCC | 2.05e-07 | 2.17e-01 | 0.1276 |
| 90417 | KNSTRN | P27T-E | Human | Esophagus | ESCC | 4.17e-05 | 1.16e-01 | 0.1055 |
| 90417 | KNSTRN | P28T-E | Human | Esophagus | ESCC | 2.20e-17 | 2.92e-01 | 0.1149 |
| 90417 | KNSTRN | P30T-E | Human | Esophagus | ESCC | 4.15e-07 | 4.12e-01 | 0.137 |
| 90417 | KNSTRN | P31T-E | Human | Esophagus | ESCC | 4.30e-10 | 2.60e-01 | 0.1251 |
| Page: 1 2 3 4 |
| Tissue | Expression Dynamics | Abbreviation |
| Esophagus | 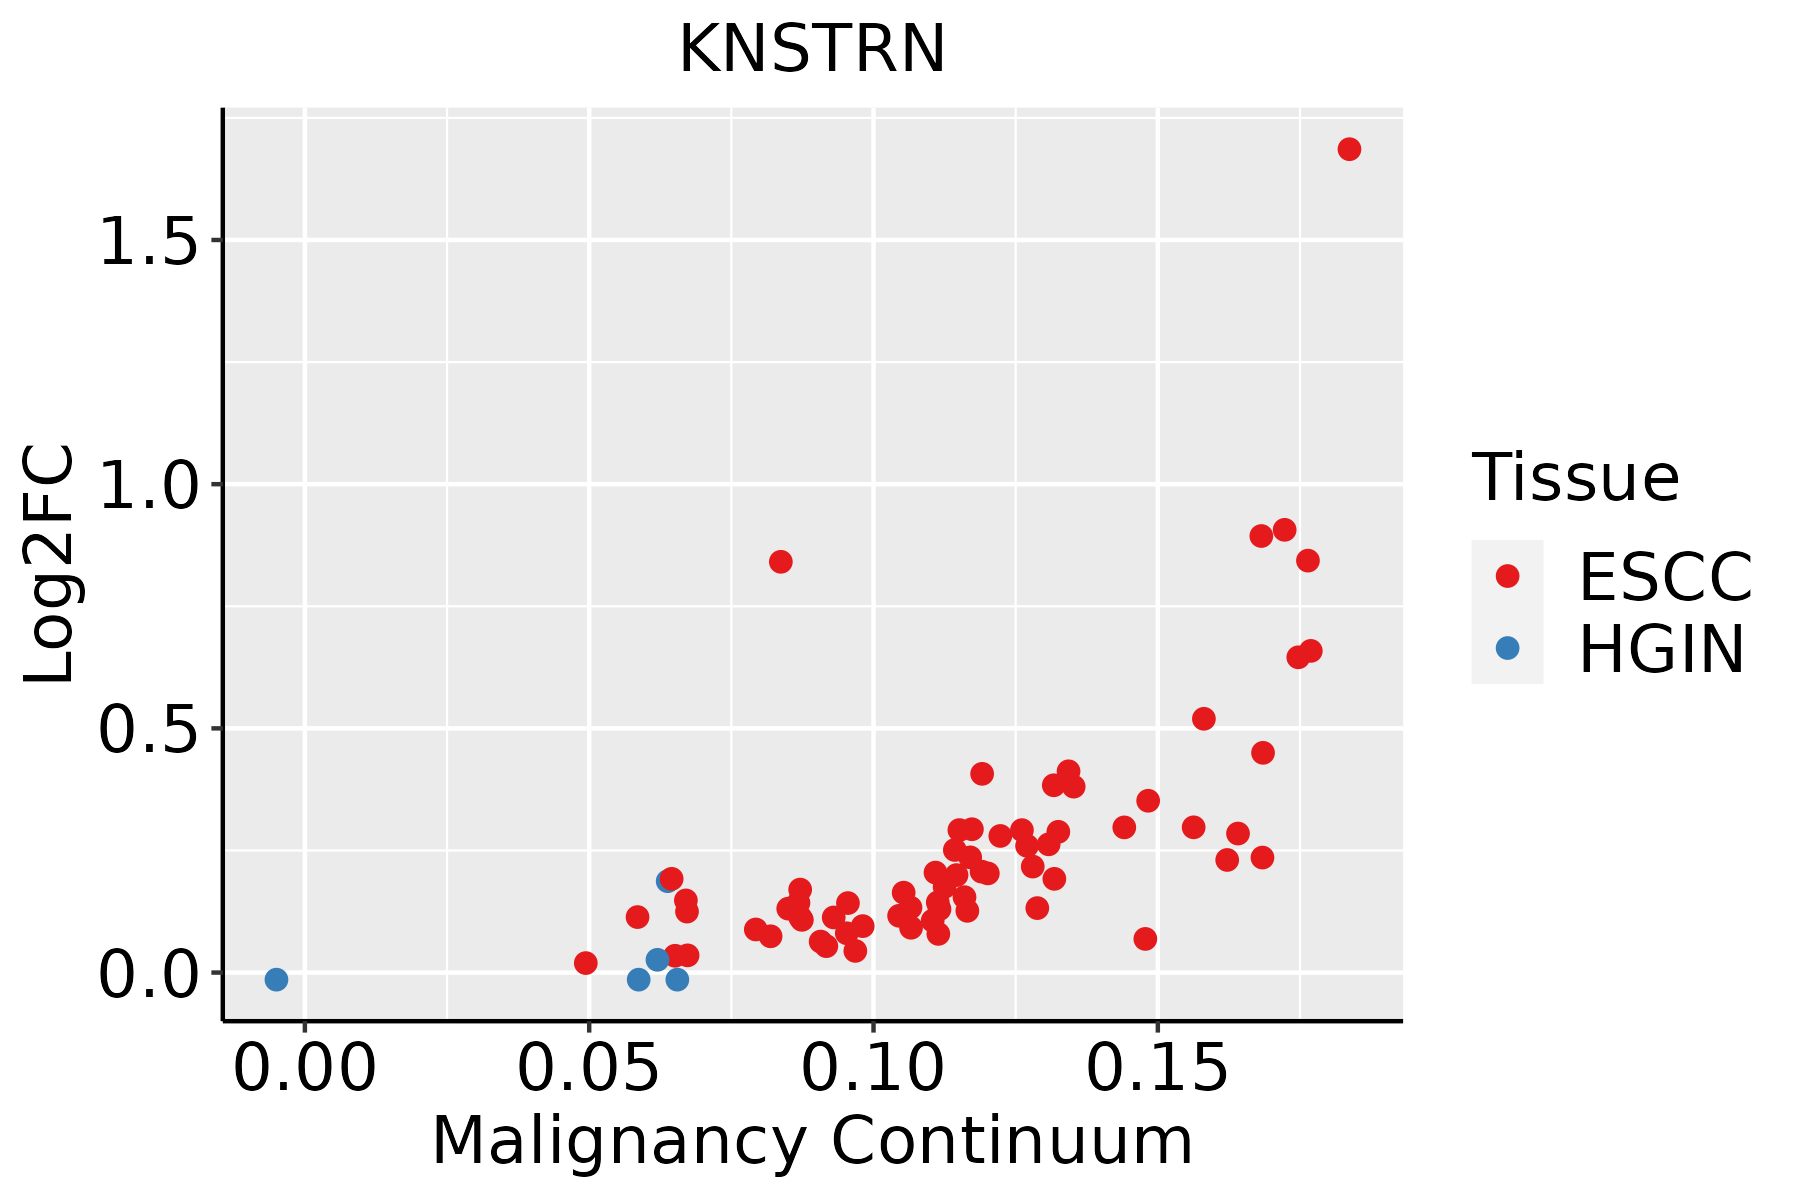 | ESCC: Esophageal squamous cell carcinoma |
| HGIN: High-grade intraepithelial neoplasias | ||
| LGIN: Low-grade intraepithelial neoplasias | ||
| Oral Cavity | 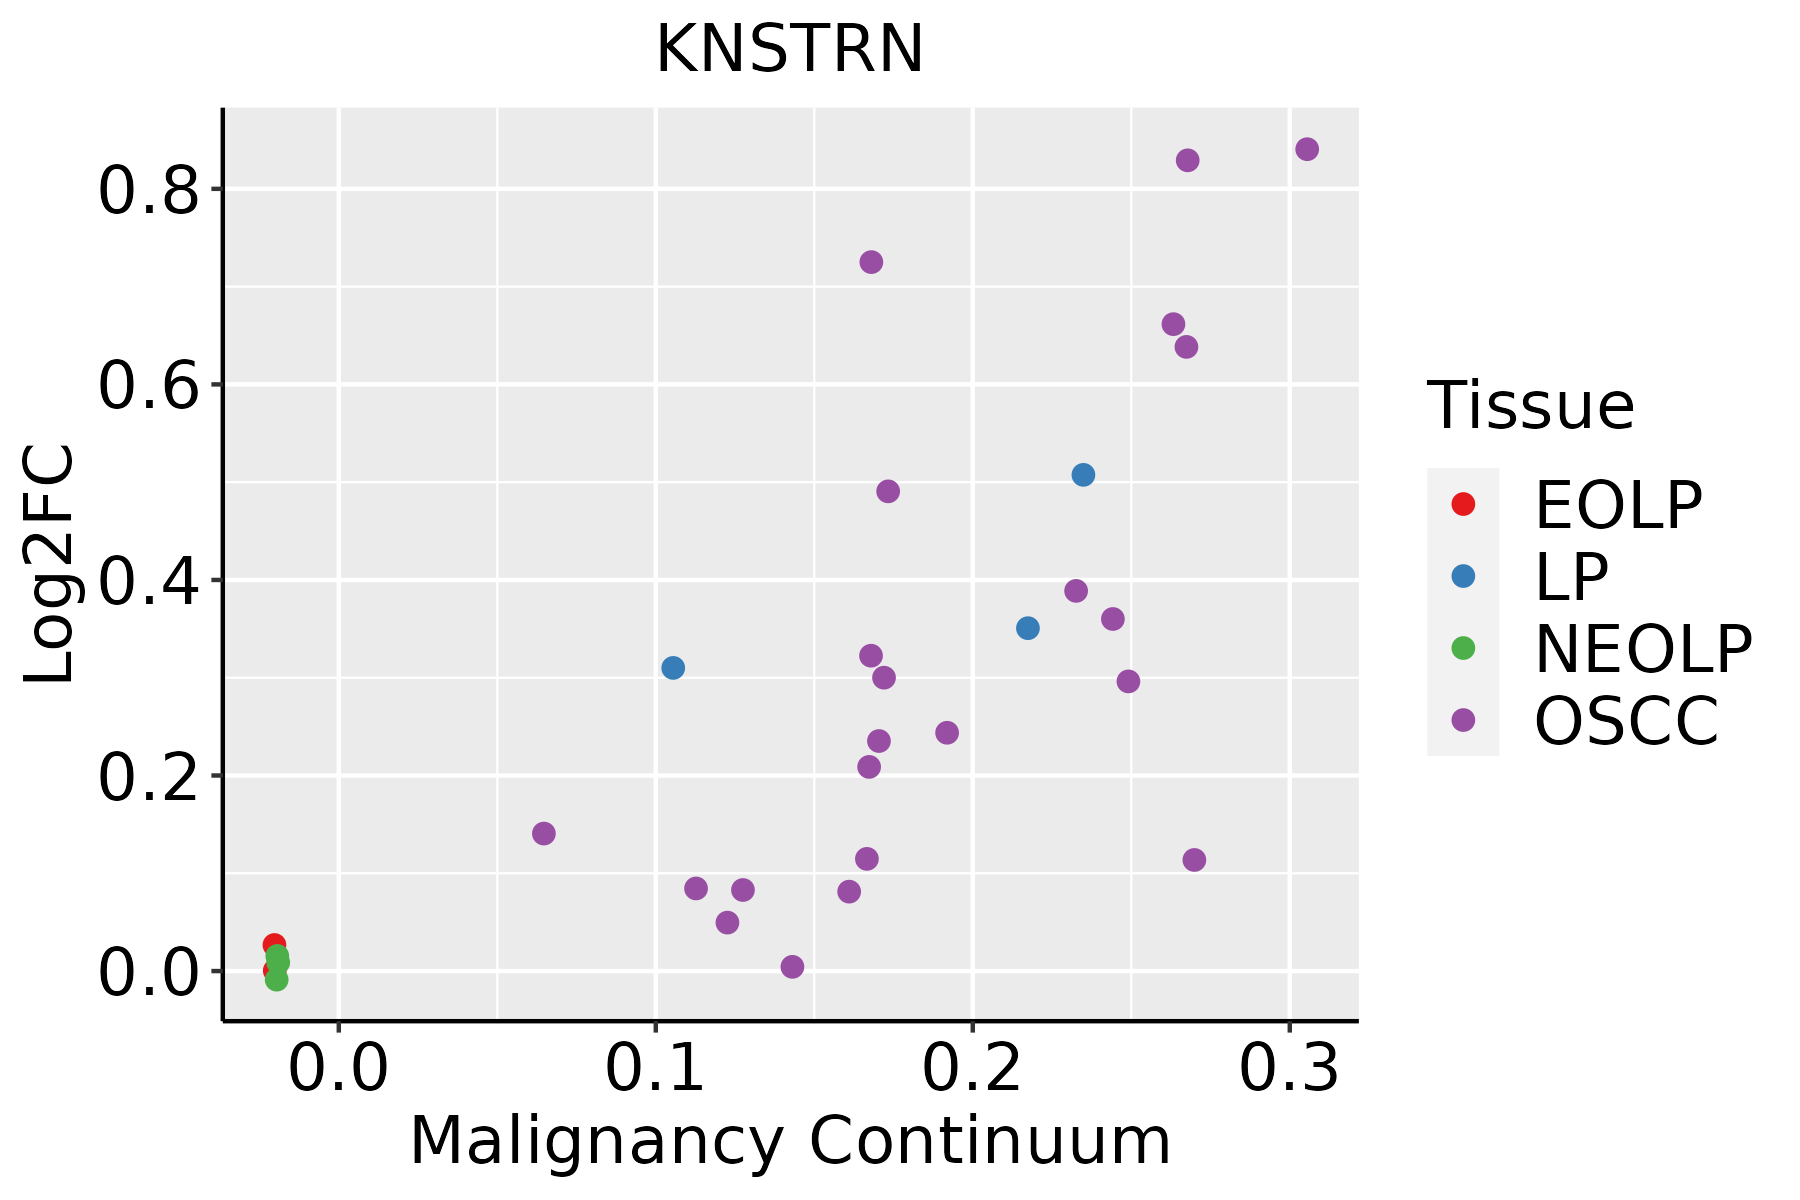 | EOLP: Erosive Oral lichen planus |
| LP: leukoplakia | ||
| NEOLP: Non-erosive oral lichen planus | ||
| OSCC: Oral squamous cell carcinoma | ||
| Skin | 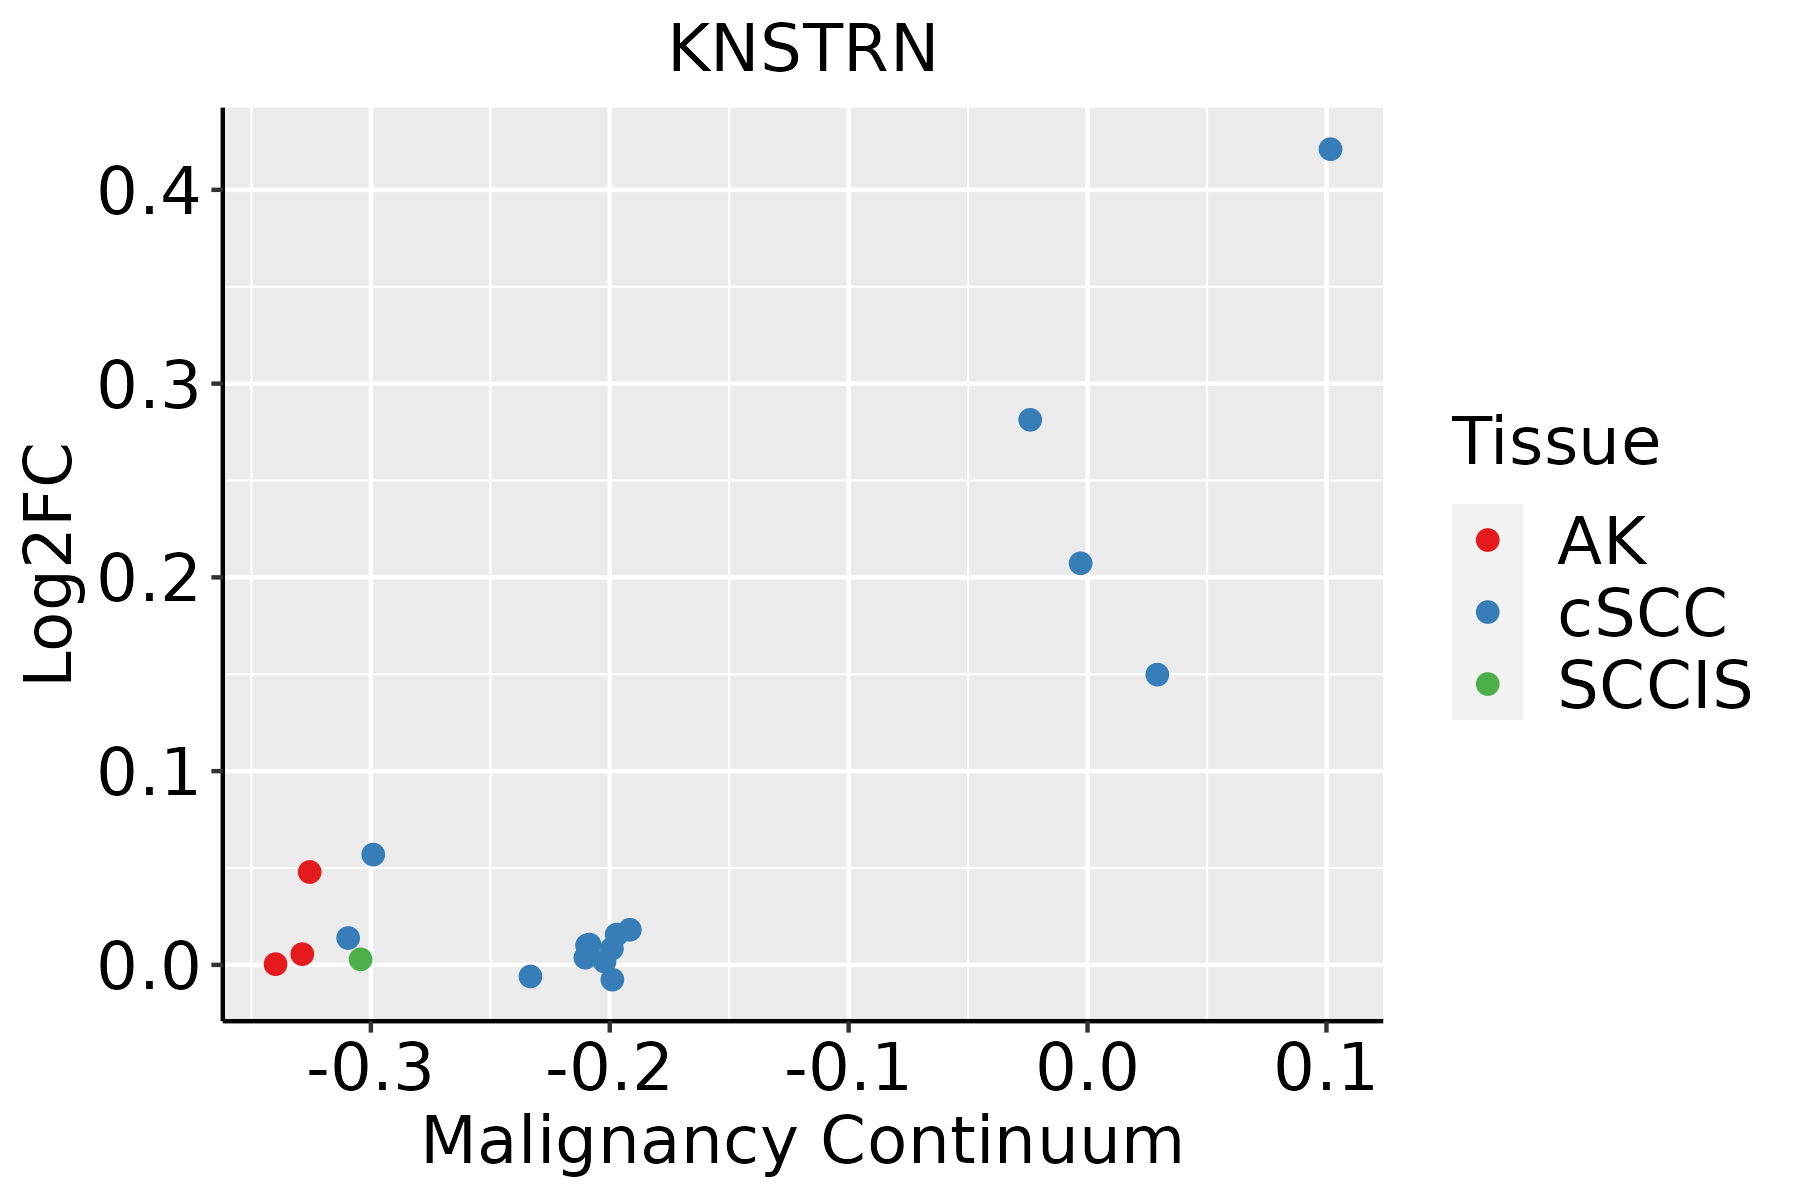 | AK: Actinic keratosis |
| cSCC: Cutaneous squamous cell carcinoma | ||
| SCCIS:squamous cell carcinoma in situ | ||
| Thyroid | 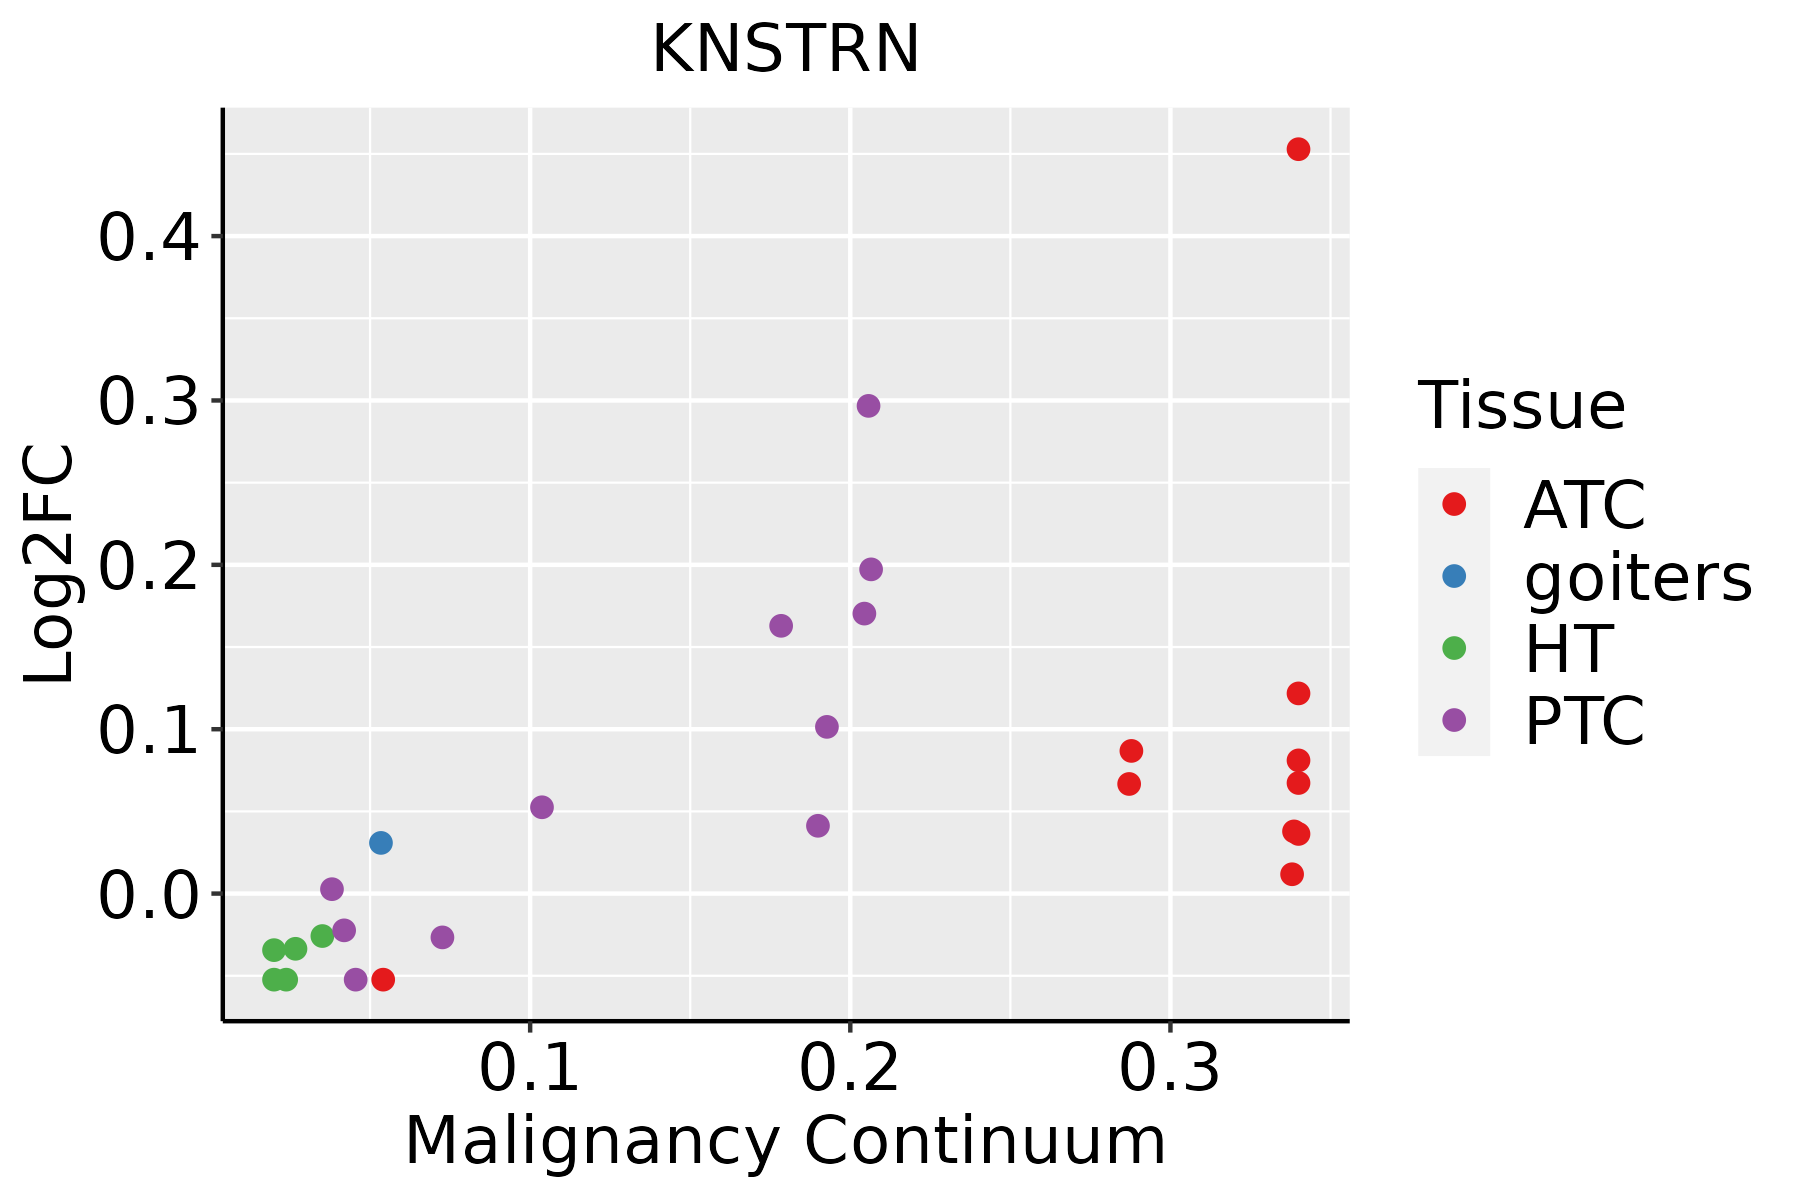 | ATC: Anaplastic thyroid cancer |
| HT: Hashimoto's thyroiditis | ||
| PTC: Papillary thyroid cancer |
| ∗log2FC in expression of this searched gene in stem-like cells from each diseased tissue sample relative to stem-like cells in normal samples in each tissue plotted against the malignancy continuum. Samples are colored based on if they are from different disease stage. |
Top |
Malignant transformation related pathway analysis |
| Find out the enriched GO biological processes and KEGG pathways involved in transition from healthy to precancer to cancer |
| Tissue | Disease Stage | Enriched GO biological Processes |
| Colorectum | AD |  |
| Colorectum | SER |  |
| Colorectum | MSS |  |
| Colorectum | MSI-H |  |
| Colorectum | FAP |  |
| ∗Top 15 enriched GO BP terms are showed in the bar plot of each disease state in each tissue. Each row represents a significant GO biological process which is colored according to the -log10(p.adjust). |
| Page: 1 2 3 4 5 6 7 8 9 |
| GO ID | Tissue | Disease Stage | Description | Gene Ratio | Bg Ratio | pvalue | p.adjust | Count |
| GO:014001414 | Esophagus | ESCC | mitotic nuclear division | 218/8552 | 287/18723 | 6.17e-26 | 1.78e-23 | 218 |
| GO:000007011 | Esophagus | ESCC | mitotic sister chromatid segregation | 138/8552 | 168/18723 | 1.37e-22 | 2.63e-20 | 138 |
| GO:00008194 | Esophagus | ESCC | sister chromatid segregation | 157/8552 | 202/18723 | 8.41e-21 | 1.33e-18 | 157 |
| GO:000705911 | Esophagus | ESCC | chromosome segregation | 238/8552 | 346/18723 | 1.72e-18 | 1.82e-16 | 238 |
| GO:000705114 | Esophagus | ESCC | spindle organization | 134/8552 | 184/18723 | 5.70e-14 | 2.87e-12 | 134 |
| GO:00482853 | Esophagus | ESCC | organelle fission | 301/8552 | 488/18723 | 4.64e-13 | 2.12e-11 | 301 |
| GO:00988133 | Esophagus | ESCC | nuclear chromosome segregation | 187/8552 | 281/18723 | 1.00e-12 | 4.36e-11 | 187 |
| GO:00002802 | Esophagus | ESCC | nuclear division | 270/8552 | 439/18723 | 1.17e-11 | 4.24e-10 | 270 |
| GO:007084919 | Esophagus | ESCC | response to epidermal growth factor | 38/8552 | 49/18723 | 5.24e-06 | 5.49e-05 | 38 |
| GO:00086081 | Esophagus | ESCC | attachment of spindle microtubules to kinetochore | 29/8552 | 35/18723 | 6.61e-06 | 6.75e-05 | 29 |
| GO:007136419 | Esophagus | ESCC | cellular response to epidermal growth factor stimulus | 35/8552 | 45/18723 | 1.11e-05 | 1.04e-04 | 35 |
| GO:00519882 | Esophagus | ESCC | regulation of attachment of spindle microtubules to kinetochore | 13/8552 | 13/18723 | 3.75e-05 | 3.04e-04 | 13 |
| GO:01400145 | Oral cavity | OSCC | mitotic nuclear division | 191/7305 | 287/18723 | 1.99e-21 | 3.70e-19 | 191 |
| GO:00000702 | Oral cavity | OSCC | mitotic sister chromatid segregation | 118/7305 | 168/18723 | 1.89e-16 | 1.48e-14 | 118 |
| GO:00008193 | Oral cavity | OSCC | sister chromatid segregation | 135/7305 | 202/18723 | 8.88e-16 | 6.52e-14 | 135 |
| GO:00070592 | Oral cavity | OSCC | chromosome segregation | 206/7305 | 346/18723 | 5.82e-15 | 3.76e-13 | 206 |
| GO:00482852 | Oral cavity | OSCC | organelle fission | 265/7305 | 488/18723 | 3.22e-12 | 1.27e-10 | 265 |
| GO:00070517 | Oral cavity | OSCC | spindle organization | 117/7305 | 184/18723 | 1.16e-11 | 4.17e-10 | 117 |
| GO:00002801 | Oral cavity | OSCC | nuclear division | 237/7305 | 439/18723 | 9.62e-11 | 2.90e-09 | 237 |
| GO:00988132 | Oral cavity | OSCC | nuclear chromosome segregation | 162/7305 | 281/18723 | 1.56e-10 | 4.56e-09 | 162 |
| Page: 1 2 3 4 |
| Pathway ID | Tissue | Disease Stage | Description | Gene Ratio | Bg Ratio | pvalue | p.adjust | qvalue | Count |
| Page: 1 |
Top |
Cell-cell communication analysis |
| Identification of potential cell-cell interactions between two cell types and their ligand-receptor pairs for different disease states |
| Ligand | Receptor | LRpair | Pathway | Tissue | Disease Stage |
| Page: 1 |
Top |
Single-cell gene regulatory network inference analysis |
| Find out the significant the regulons (TFs) and the target genes of each regulon across cell types for different disease states |
| TF | Cell Type | Tissue | Disease Stage | Target Gene | RSS | Regulon Activity |
| ∗The dot plots of a searched regulon are shown for all cell subpopulations in each disease state of each tissue based on the regulon specific score inferred using pySCENIC and by calculating the average expression. |
| Page: 1 |
Top |
Somatic mutation of malignant transformation related genes |
| Annotation of somatic variants for genes involved in malignant transformation |
| Hugo Symbol | Variant Class | Variant Classification | dbSNP RS | HGVSc | HGVSp | HGVSp Short | SWISSPROT | BIOTYPE | SIFT | PolyPhen | Tumor Sample Barcode | Tissue | Histology | Sex | Age | Stage | Therapy Types | Drugs | Outcome |
| KNSTRN | SNV | Missense_Mutation | novel | c.160C>A | p.Leu54Ile | p.L54I | Q9Y448 | protein_coding | tolerated_low_confidence(0.06) | benign(0.215) | TCGA-AN-A046-01 | Breast | breast invasive carcinoma | Female | >=65 | I/II | Unknown | Unknown | SD |
| KNSTRN | SNV | Missense_Mutation | rs762664300 | c.68N>T | p.Asp23Val | p.D23V | Q9Y448 | protein_coding | tolerated_low_confidence(0.09) | benign(0.003) | TCGA-AR-A256-01 | Breast | breast invasive carcinoma | Female | <65 | I/II | Chemotherapy | doxorubicin | PD |
| KNSTRN | SNV | Missense_Mutation | c.718N>A | p.Glu240Lys | p.E240K | Q9Y448 | protein_coding | tolerated(0.27) | benign(0.124) | TCGA-C8-A3M7-01 | Breast | breast invasive carcinoma | Female | <65 | III/IV | Unknown | Unknown | PD | |
| KNSTRN | SNV | Missense_Mutation | rs761636030 | c.361G>A | p.Asp121Asn | p.D121N | Q9Y448 | protein_coding | tolerated(0.06) | probably_damaging(0.917) | TCGA-VS-A959-01 | Cervix | cervical & endocervical cancer | Female | >=65 | I/II | Unknown | Unknown | SD |
| KNSTRN | deletion | Frame_Shift_Del | novel | c.412delA | p.Ile138SerfsTer4 | p.I138Sfs*4 | Q9Y448 | protein_coding | TCGA-EA-A410-01 | Cervix | cervical & endocervical cancer | Female | <65 | I/II | Unknown | Unknown | SD | ||
| KNSTRN | SNV | Missense_Mutation | c.823N>C | p.Ala275Pro | p.A275P | Q9Y448 | protein_coding | deleterious(0.02) | probably_damaging(0.92) | TCGA-A6-2680-01 | Colorectum | colon adenocarcinoma | Female | >=65 | I/II | Unknown | Unknown | SD | |
| KNSTRN | SNV | Missense_Mutation | c.706N>A | p.Ala236Thr | p.A236T | Q9Y448 | protein_coding | tolerated(0.3) | benign(0.297) | TCGA-A6-3809-01 | Colorectum | colon adenocarcinoma | Female | >=65 | I/II | Unknown | Unknown | SD | |
| KNSTRN | SNV | Missense_Mutation | c.703C>A | p.Leu235Met | p.L235M | Q9Y448 | protein_coding | deleterious(0.01) | possibly_damaging(0.748) | TCGA-AA-3663-01 | Colorectum | colon adenocarcinoma | Male | <65 | I/II | Unknown | Unknown | SD | |
| KNSTRN | SNV | Missense_Mutation | c.74A>G | p.His25Arg | p.H25R | Q9Y448 | protein_coding | tolerated_low_confidence(1) | benign(0) | TCGA-AA-3815-01 | Colorectum | colon adenocarcinoma | Female | >=65 | I/II | Unknown | Unknown | SD | |
| KNSTRN | SNV | Missense_Mutation | c.901A>C | p.Asn301His | p.N301H | Q9Y448 | protein_coding | deleterious(0.05) | benign(0.01) | TCGA-AG-3892-01 | Colorectum | rectum adenocarcinoma | Female | <65 | I/II | Unknown | Unknown | SD |
| Page: 1 2 3 4 |
Top |
Related drugs of malignant transformation related genes |
| Identification of chemicals and drugs interact with genes involved in malignant transfromation |
| (DGIdb 4.0) |
| Entrez ID | Symbol | Category | Interaction Types | Drug Claim Name | Drug Name | PMIDs |
| Page: 1 |

Copyright 2023-Present -The University of Texas Health Science Center at Houston |