
|
|||||
|
 | |
| |
| |
| |
| |
| |
|
Gene: KNOP1 |
Gene summary for KNOP1 |
| Gene information | Species | Human | Gene symbol | KNOP1 | Gene ID | 400506 |
| Gene name | lysine rich nucleolar protein 1 | |
| Gene Alias | 101F10.1 | |
| Cytomap | 16p12.3 | |
| Gene Type | protein-coding | GO ID | GO:0005575 | UniProtAcc | Q1ED39 |
Top |
Malignant transformation analysis |
| Identification of the aberrant gene expression in precancerous and cancerous lesions by comparing the gene expression of stem-like cells in diseased tissues with normal stem cells |
| Entrez ID | Symbol | Replicates | Species | Organ | Tissue | Adj P-value | Log2FC | Malignancy |
| 400506 | KNOP1 | GSM4909281 | Human | Breast | IDC | 7.22e-08 | 3.12e-01 | 0.21 |
| 400506 | KNOP1 | GSM4909282 | Human | Breast | IDC | 1.59e-04 | 2.84e-01 | -0.0288 |
| 400506 | KNOP1 | GSM4909290 | Human | Breast | IDC | 4.31e-13 | 4.19e-01 | 0.2096 |
| 400506 | KNOP1 | GSM4909291 | Human | Breast | IDC | 1.40e-02 | 2.69e-01 | 0.1753 |
| 400506 | KNOP1 | GSM4909293 | Human | Breast | IDC | 6.76e-24 | 5.07e-01 | 0.1581 |
| 400506 | KNOP1 | GSM4909297 | Human | Breast | IDC | 2.42e-02 | 5.74e-02 | 0.1517 |
| 400506 | KNOP1 | GSM4909298 | Human | Breast | IDC | 2.57e-22 | 4.69e-01 | 0.1551 |
| 400506 | KNOP1 | GSM4909301 | Human | Breast | IDC | 5.10e-05 | 2.98e-01 | 0.1577 |
| 400506 | KNOP1 | GSM4909302 | Human | Breast | IDC | 6.87e-04 | 2.54e-01 | 0.1545 |
| 400506 | KNOP1 | GSM4909305 | Human | Breast | IDC | 1.49e-11 | 4.23e-01 | 0.0436 |
| 400506 | KNOP1 | GSM4909306 | Human | Breast | IDC | 3.34e-51 | 8.94e-01 | 0.1564 |
| 400506 | KNOP1 | GSM4909307 | Human | Breast | IDC | 4.82e-02 | 2.23e-01 | 0.1569 |
| 400506 | KNOP1 | GSM4909308 | Human | Breast | IDC | 8.40e-05 | 2.07e-01 | 0.158 |
| 400506 | KNOP1 | GSM4909311 | Human | Breast | IDC | 8.75e-11 | 3.04e-02 | 0.1534 |
| 400506 | KNOP1 | GSM4909312 | Human | Breast | IDC | 5.13e-05 | 1.31e-01 | 0.1552 |
| 400506 | KNOP1 | GSM4909317 | Human | Breast | IDC | 1.22e-23 | 5.22e-01 | 0.1355 |
| 400506 | KNOP1 | GSM4909319 | Human | Breast | IDC | 2.94e-24 | 2.25e-01 | 0.1563 |
| 400506 | KNOP1 | GSM4909321 | Human | Breast | IDC | 5.74e-03 | 7.50e-02 | 0.1559 |
| 400506 | KNOP1 | brca2 | Human | Breast | Precancer | 1.95e-09 | 2.56e-01 | -0.024 |
| 400506 | KNOP1 | M1 | Human | Breast | IDC | 1.60e-10 | 4.19e-01 | 0.1577 |
| Page: 1 2 3 4 5 6 7 8 |
| Tissue | Expression Dynamics | Abbreviation |
| Breast |  | IDC: Invasive ductal carcinoma |
| DCIS: Ductal carcinoma in situ | ||
| Precancer(BRCA1-mut): Precancerous lesion from BRCA1 mutation carriers | ||
| Esophagus | 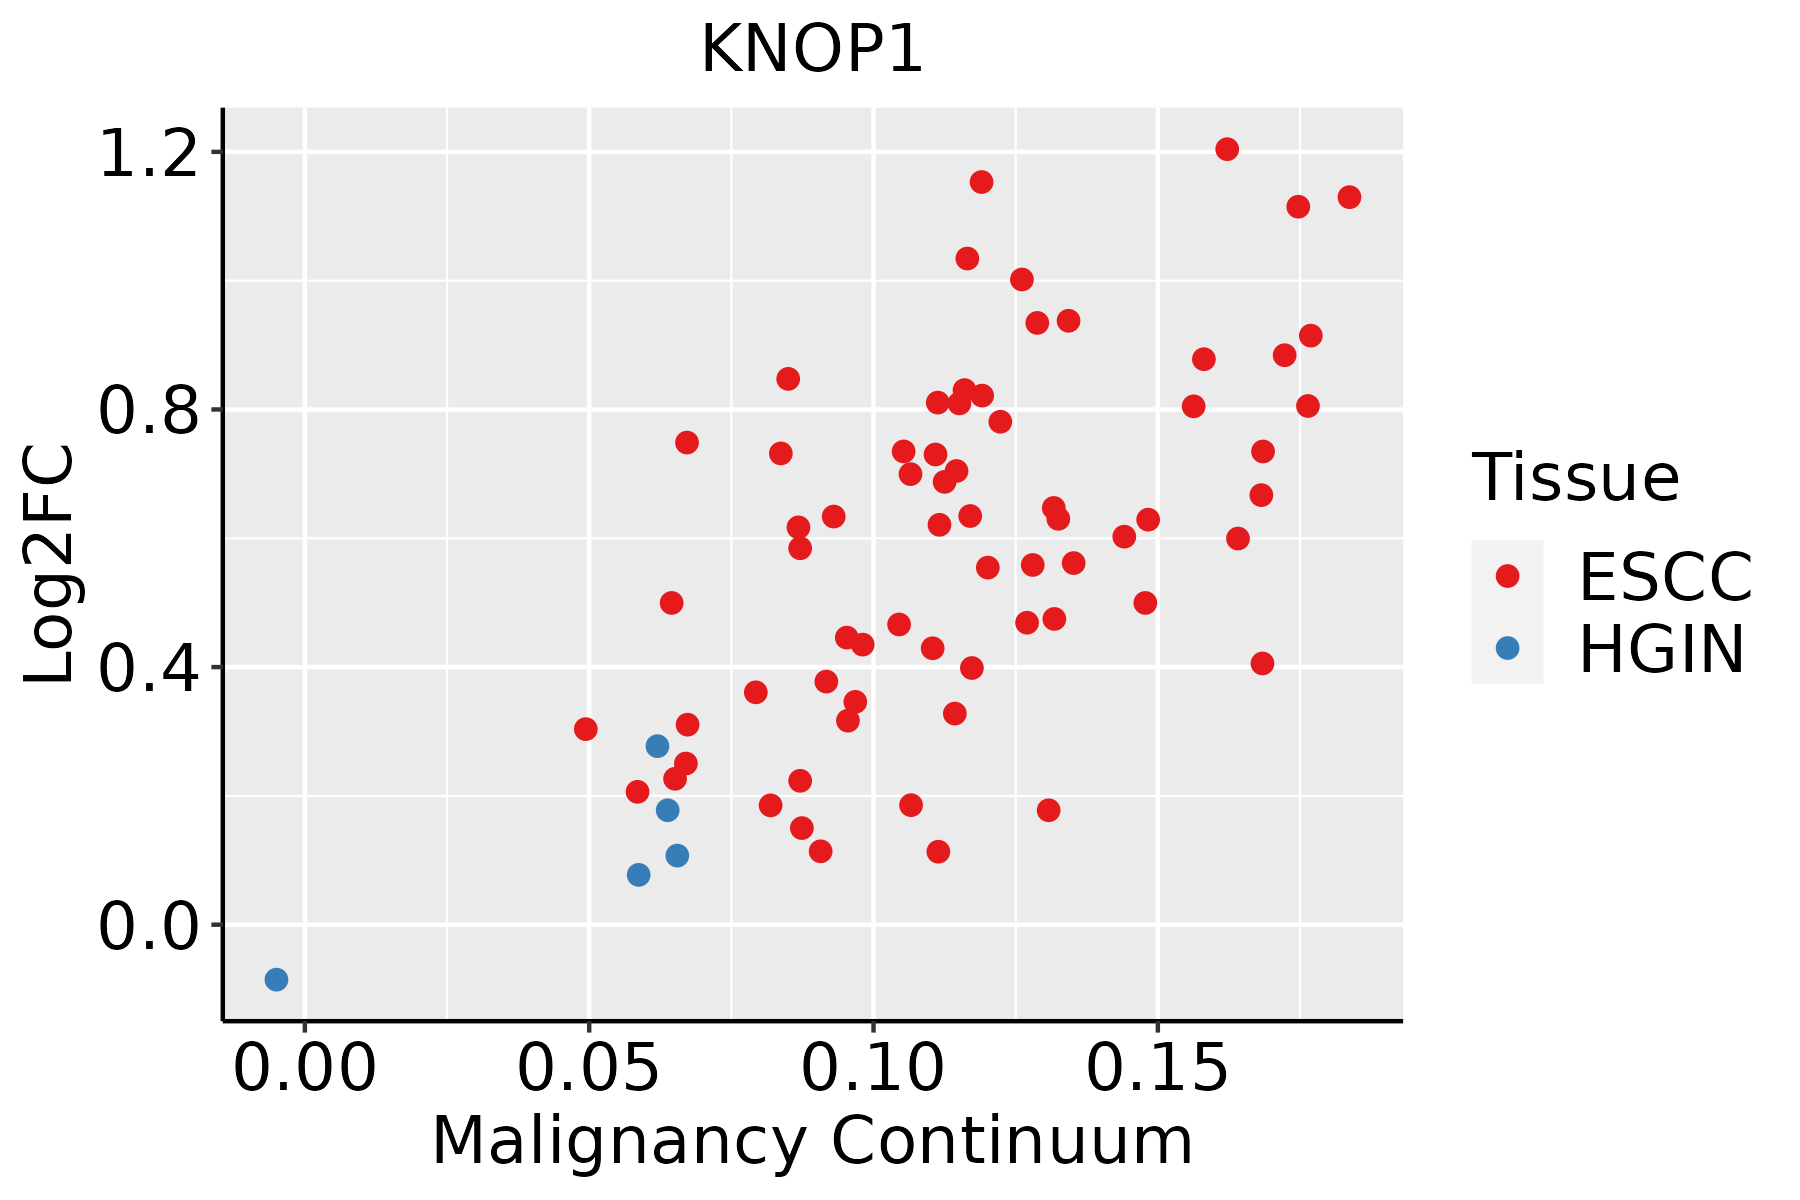 | ESCC: Esophageal squamous cell carcinoma |
| HGIN: High-grade intraepithelial neoplasias | ||
| LGIN: Low-grade intraepithelial neoplasias | ||
| Liver | 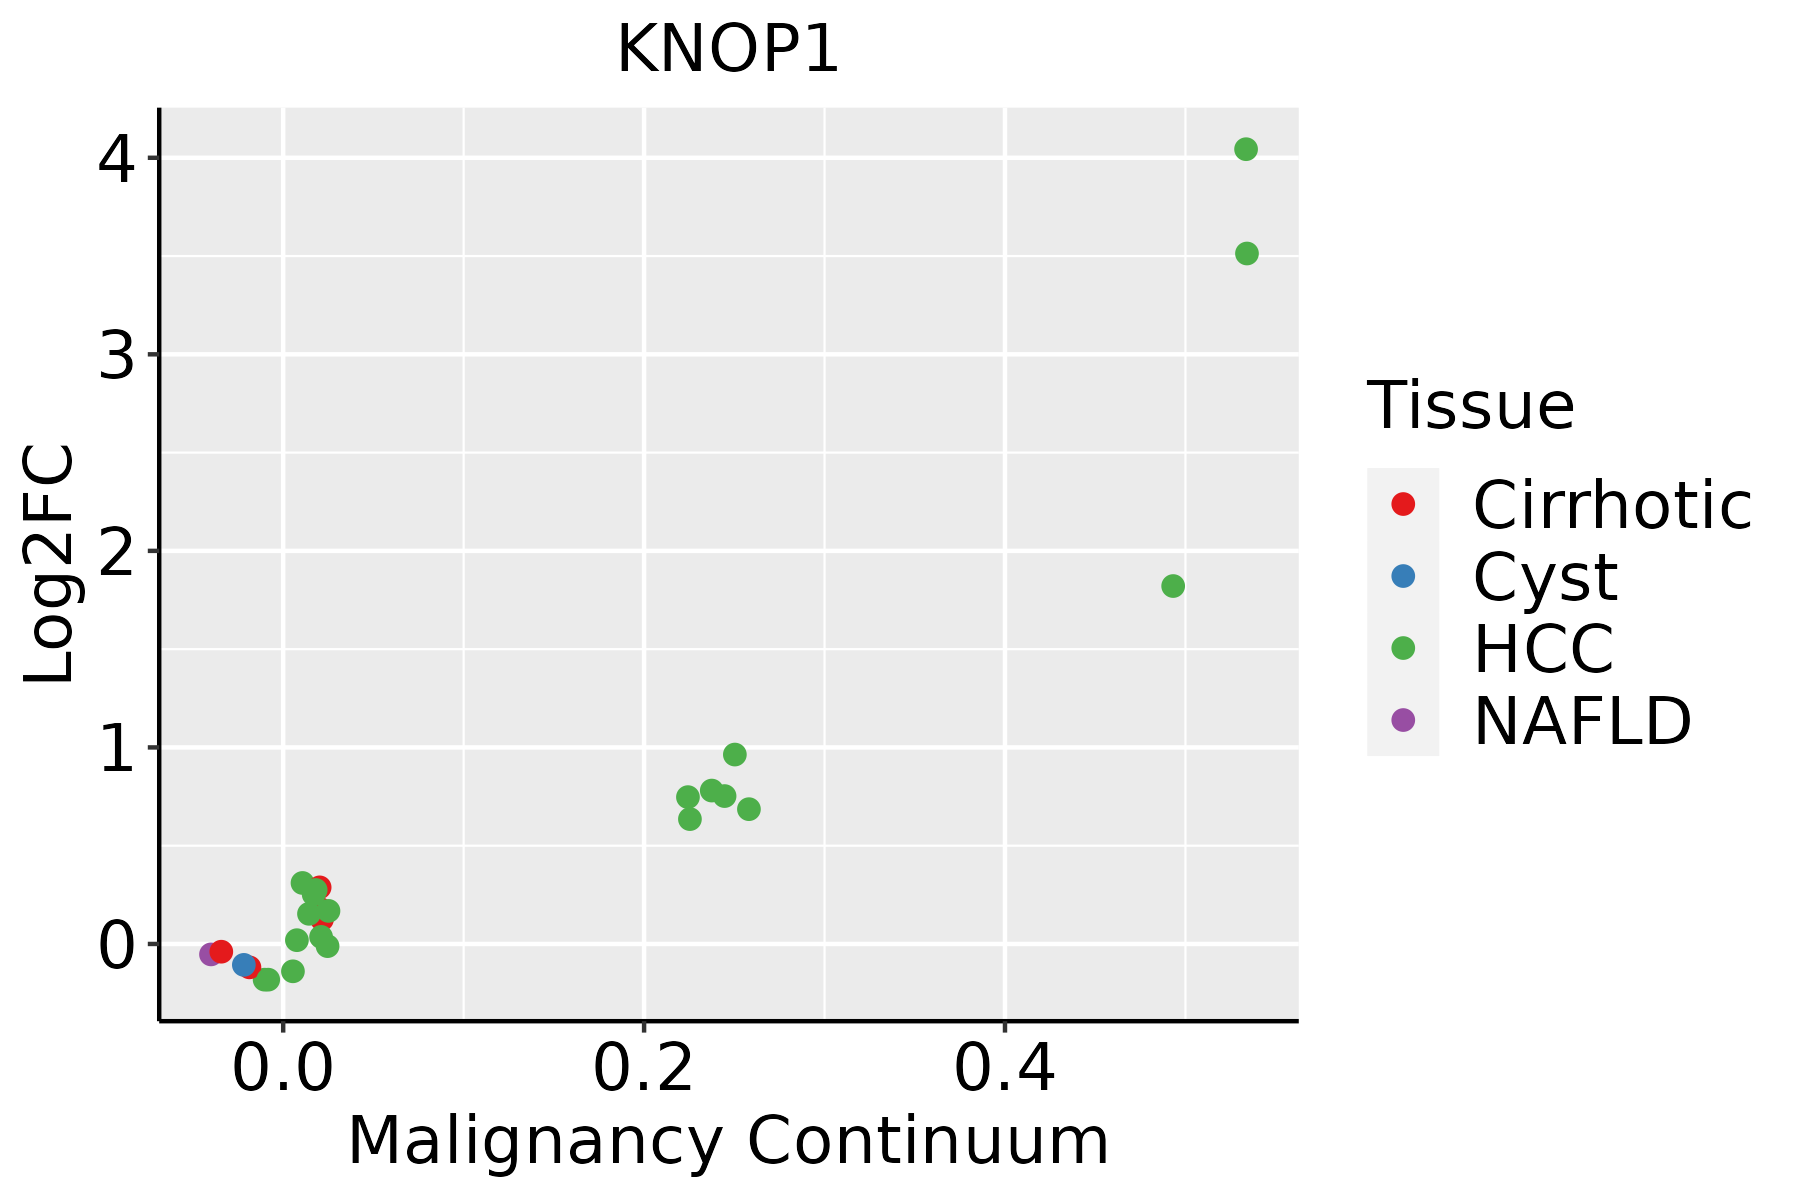 | HCC: Hepatocellular carcinoma |
| NAFLD: Non-alcoholic fatty liver disease | ||
| Oral Cavity | 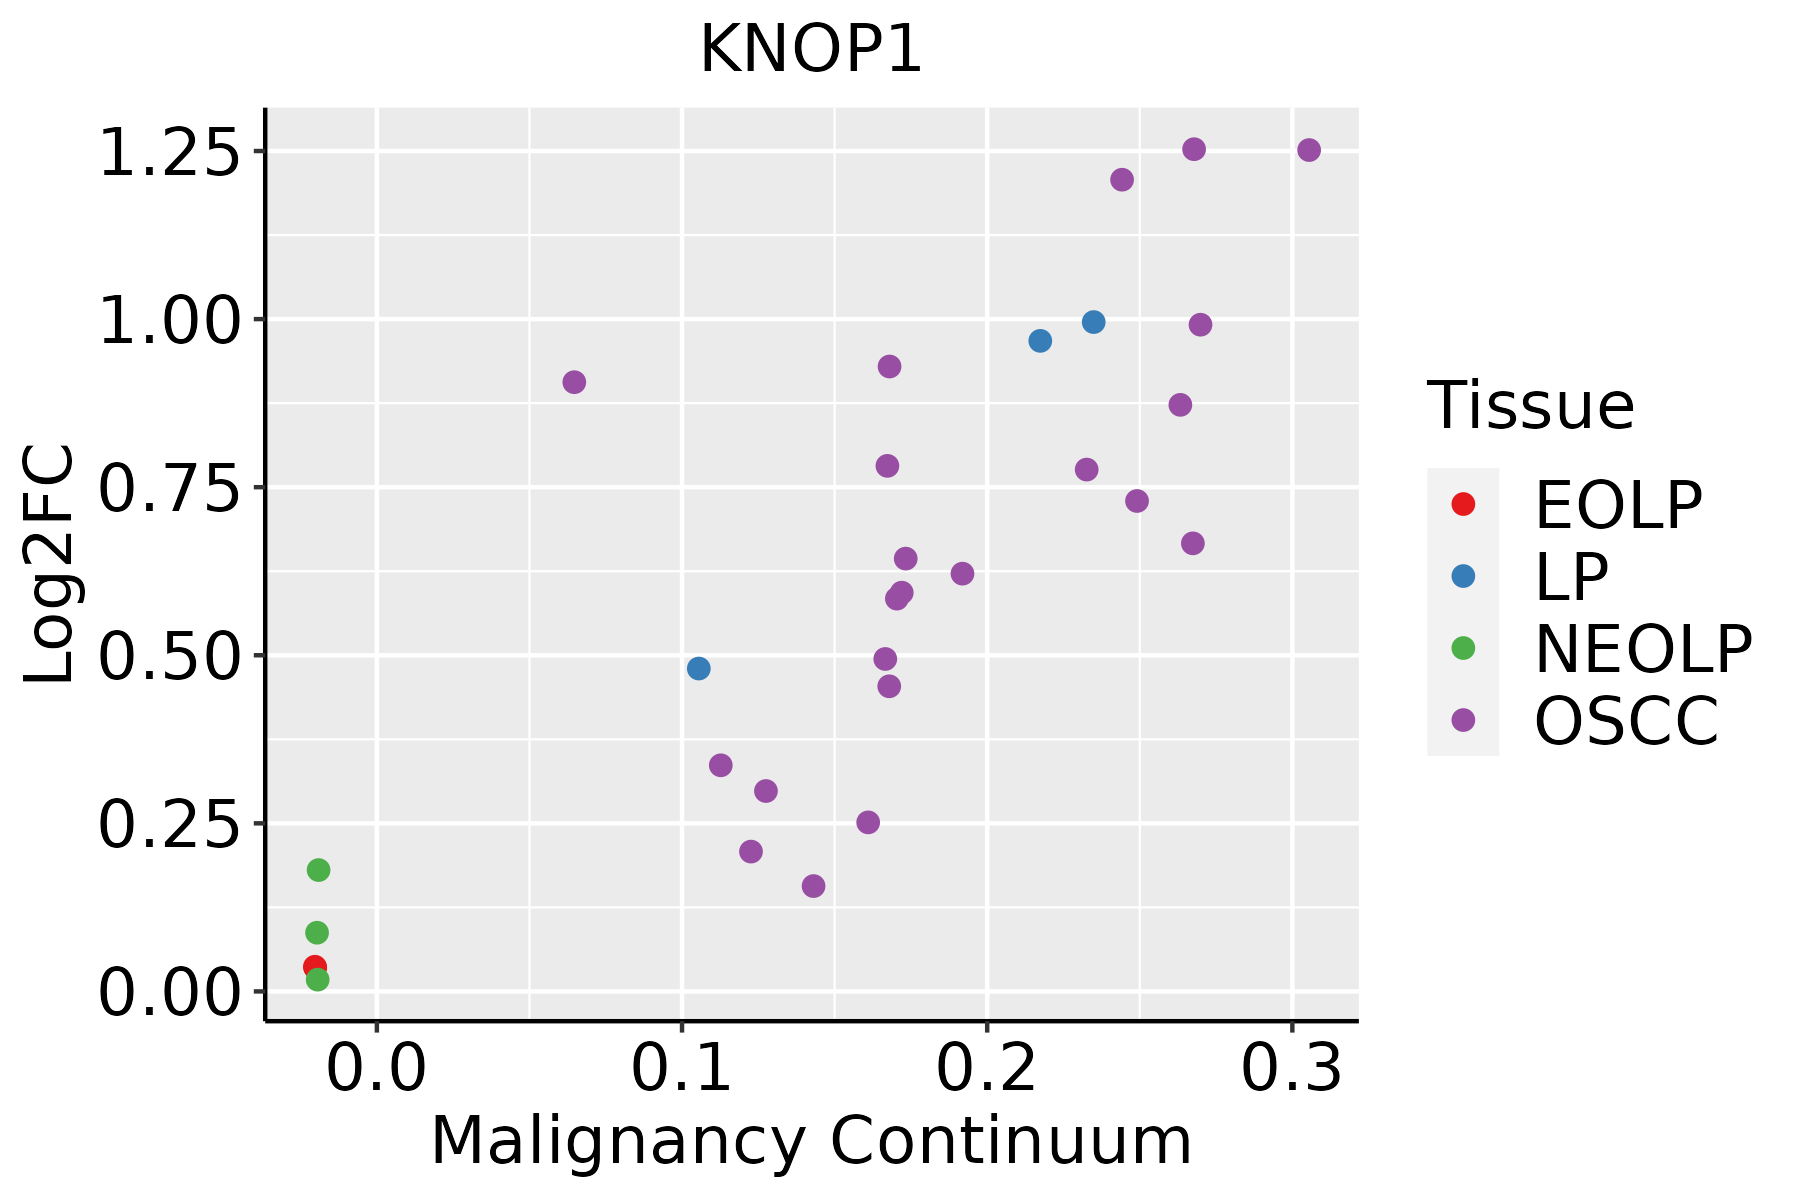 | EOLP: Erosive Oral lichen planus |
| LP: leukoplakia | ||
| NEOLP: Non-erosive oral lichen planus | ||
| OSCC: Oral squamous cell carcinoma | ||
| Skin | 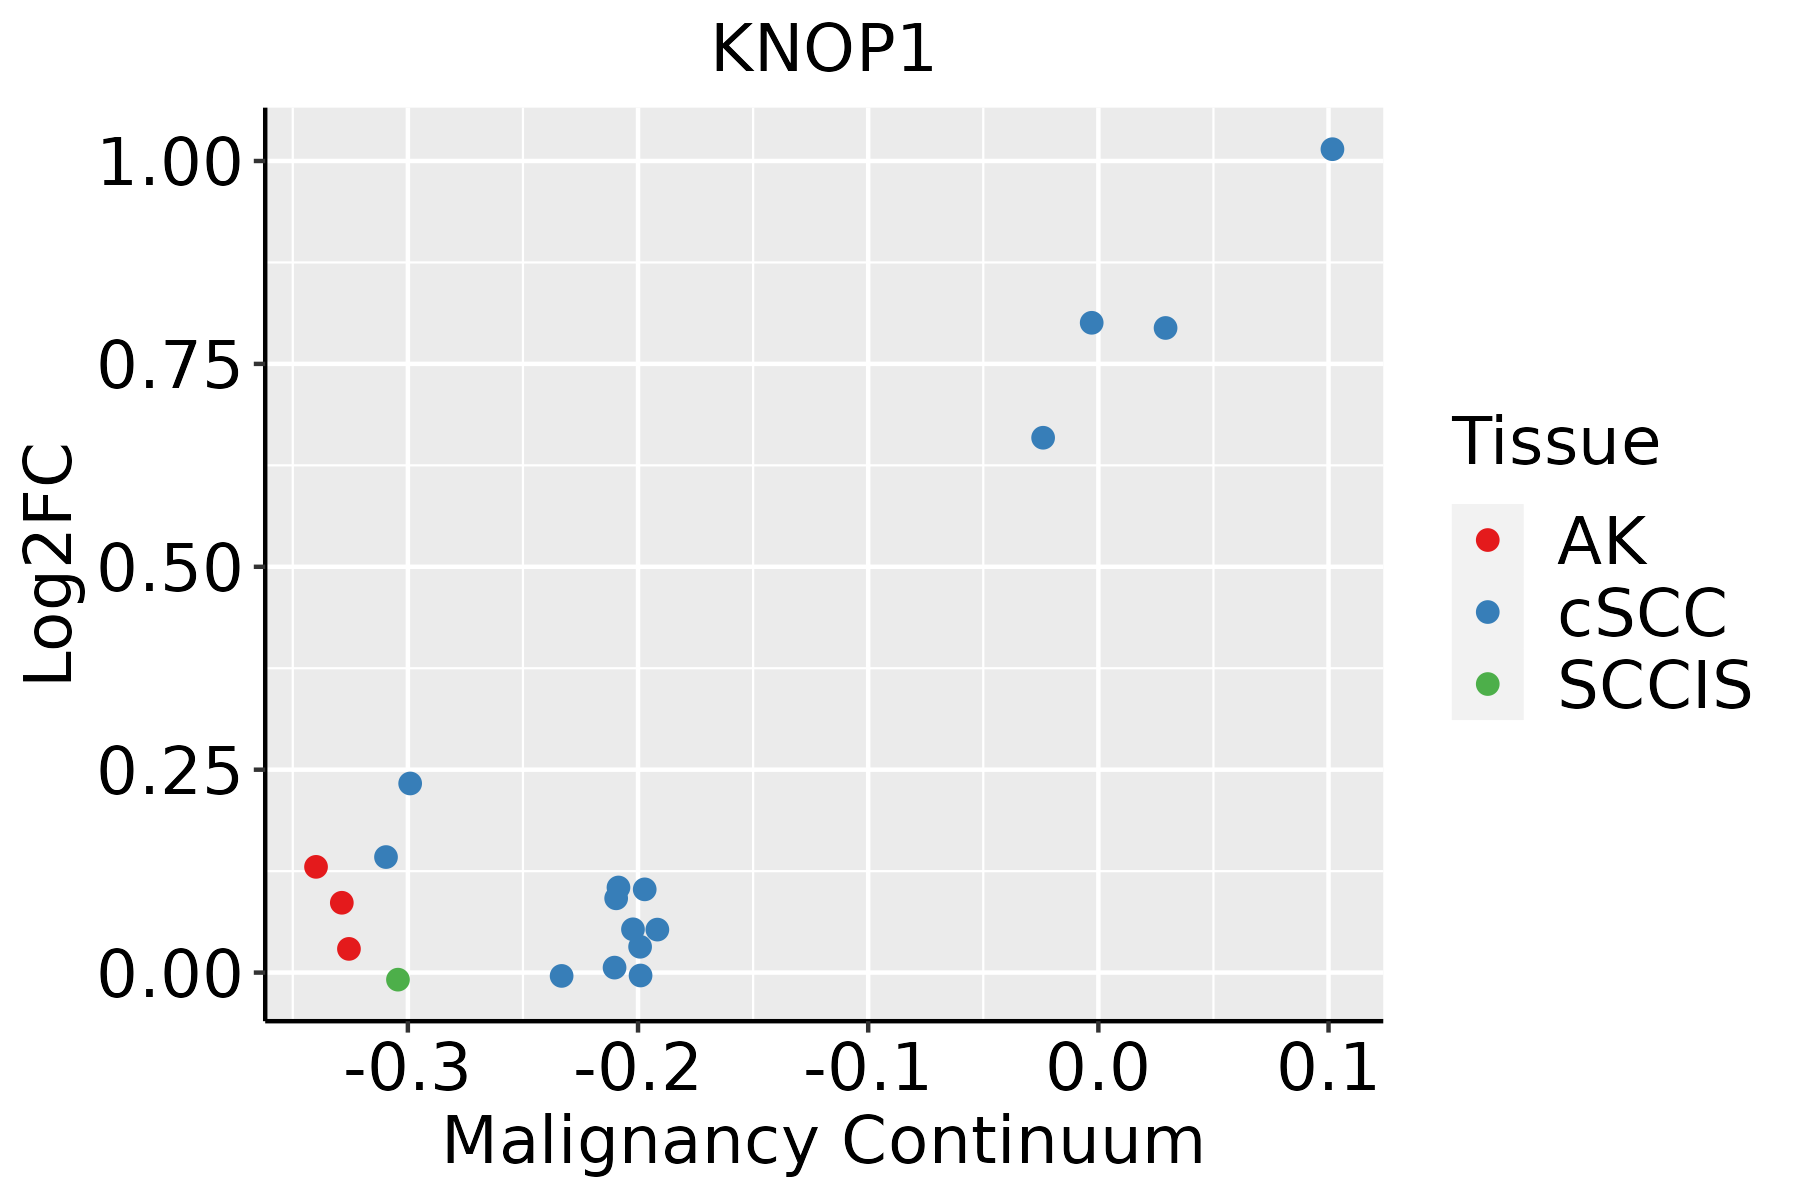 | AK: Actinic keratosis |
| cSCC: Cutaneous squamous cell carcinoma | ||
| SCCIS:squamous cell carcinoma in situ | ||
| Thyroid | 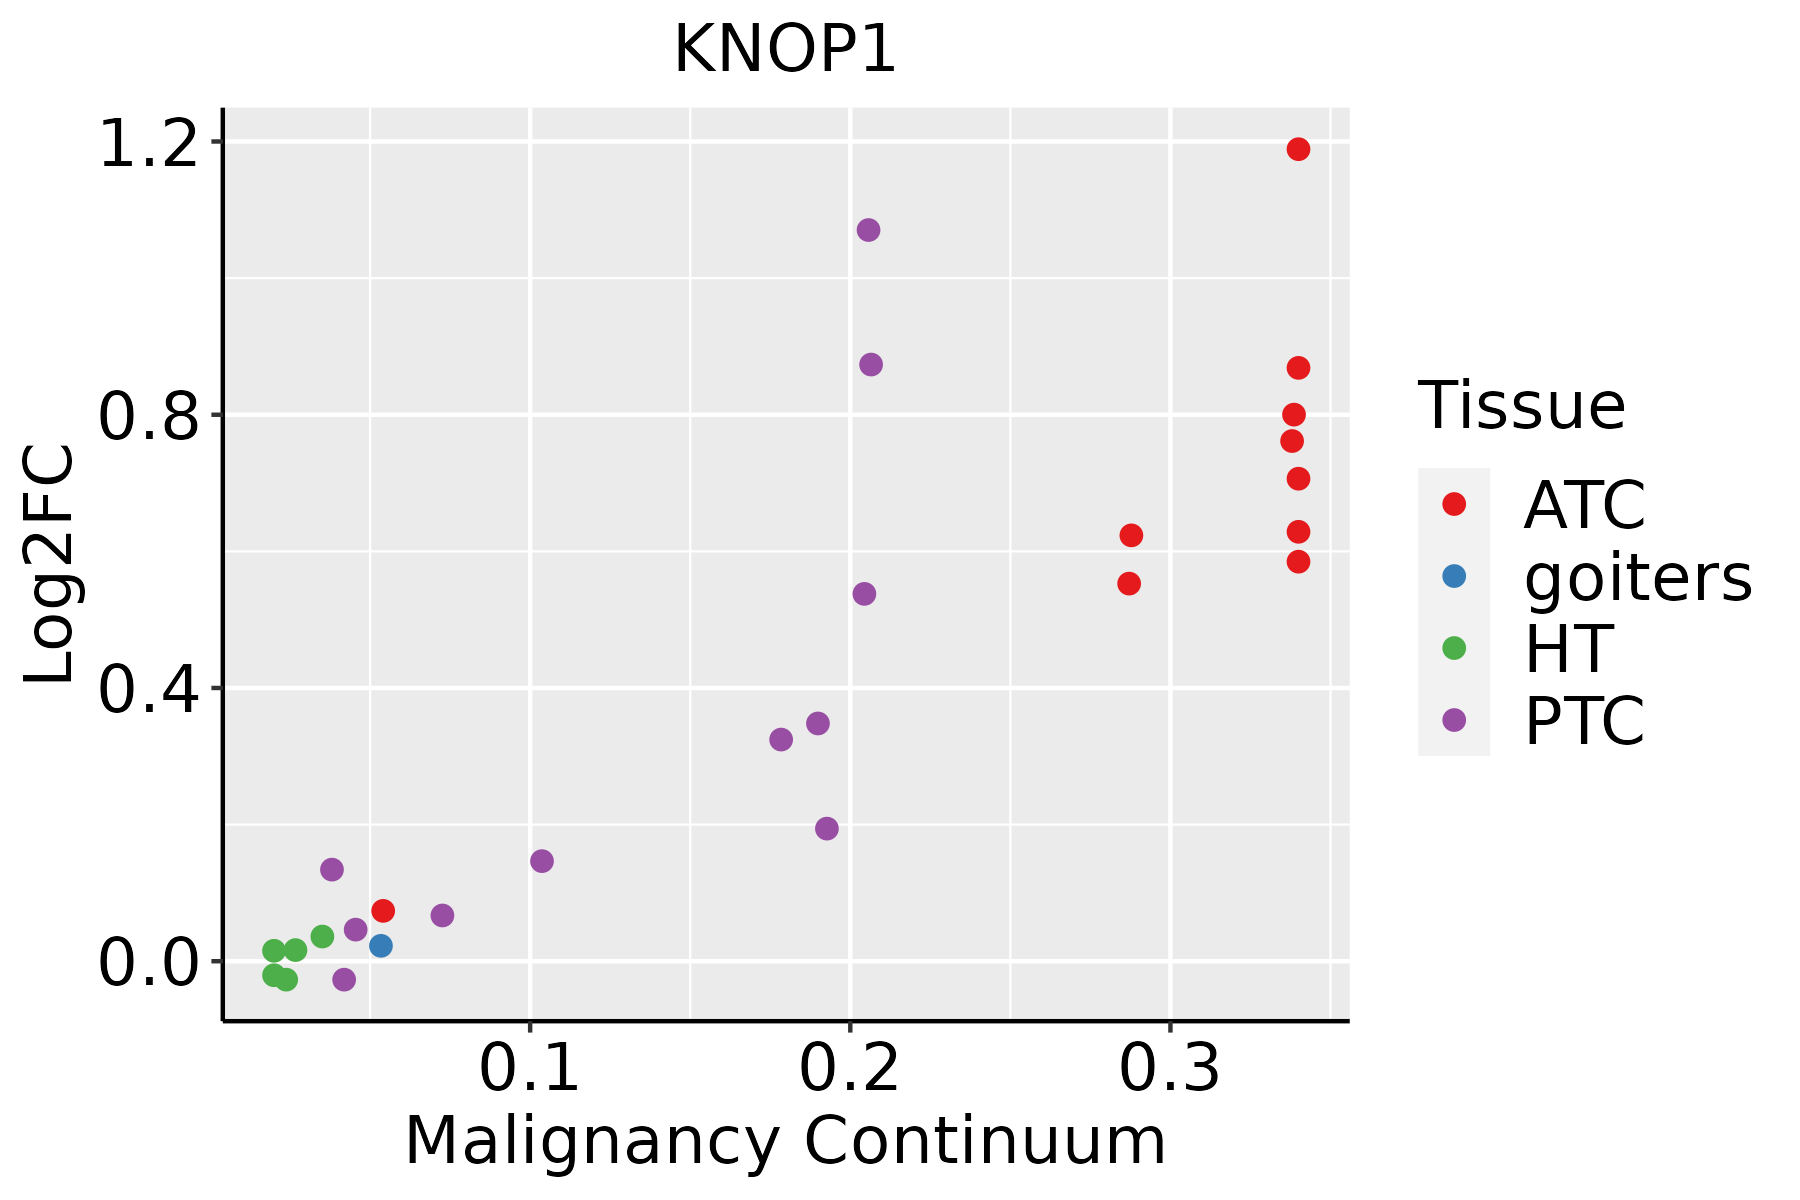 | ATC: Anaplastic thyroid cancer |
| HT: Hashimoto's thyroiditis | ||
| PTC: Papillary thyroid cancer |
| ∗log2FC in expression of this searched gene in stem-like cells from each diseased tissue sample relative to stem-like cells in normal samples in each tissue plotted against the malignancy continuum. Samples are colored based on if they are from different disease stage. |
Top |
Malignant transformation related pathway analysis |
| Find out the enriched GO biological processes and KEGG pathways involved in transition from healthy to precancer to cancer |
| Tissue | Disease Stage | Enriched GO biological Processes |
| Colorectum | AD |  |
| Colorectum | SER |  |
| Colorectum | MSS |  |
| Colorectum | MSI-H |  |
| Colorectum | FAP |  |
| ∗Top 15 enriched GO BP terms are showed in the bar plot of each disease state in each tissue. Each row represents a significant GO biological process which is colored according to the -log10(p.adjust). |
| Page: 1 2 3 4 5 6 7 8 9 |
| GO ID | Tissue | Disease Stage | Description | Gene Ratio | Bg Ratio | pvalue | p.adjust | Count |
| Page: 1 |
| Pathway ID | Tissue | Disease Stage | Description | Gene Ratio | Bg Ratio | pvalue | p.adjust | qvalue | Count |
| Page: 1 |
Top |
Cell-cell communication analysis |
| Identification of potential cell-cell interactions between two cell types and their ligand-receptor pairs for different disease states |
| Ligand | Receptor | LRpair | Pathway | Tissue | Disease Stage |
| Page: 1 |
Top |
Single-cell gene regulatory network inference analysis |
| Find out the significant the regulons (TFs) and the target genes of each regulon across cell types for different disease states |
| TF | Cell Type | Tissue | Disease Stage | Target Gene | RSS | Regulon Activity |
| ∗The dot plots of a searched regulon are shown for all cell subpopulations in each disease state of each tissue based on the regulon specific score inferred using pySCENIC and by calculating the average expression. |
| Page: 1 |
Top |
Somatic mutation of malignant transformation related genes |
| Annotation of somatic variants for genes involved in malignant transformation |
| Hugo Symbol | Variant Class | Variant Classification | dbSNP RS | HGVSc | HGVSp | HGVSp Short | SWISSPROT | BIOTYPE | SIFT | PolyPhen | Tumor Sample Barcode | Tissue | Histology | Sex | Age | Stage | Therapy Types | Drugs | Outcome |
| KNOP1 | SNV | Missense_Mutation | novel | c.882N>T | p.Arg294Ser | p.R294S | Q1ED39 | protein_coding | deleterious(0.01) | benign(0.005) | TCGA-AC-A2FM-01 | Breast | breast invasive carcinoma | Female | >=65 | I/II | Unknown | Unknown | PD |
| KNOP1 | SNV | Missense_Mutation | novel | c.667N>C | p.Asp223His | p.D223H | Q1ED39 | protein_coding | deleterious(0) | possibly_damaging(0.884) | TCGA-AC-A2FM-01 | Breast | breast invasive carcinoma | Female | >=65 | I/II | Unknown | Unknown | PD |
| KNOP1 | SNV | Missense_Mutation | c.889N>T | p.Ser297Cys | p.S297C | Q1ED39 | protein_coding | deleterious(0.04) | possibly_damaging(0.799) | TCGA-AN-A0FJ-01 | Breast | breast invasive carcinoma | Female | <65 | III/IV | Unknown | Unknown | SD | |
| KNOP1 | SNV | Missense_Mutation | rs374832937 | c.1315N>A | p.Ala439Thr | p.A439T | Q1ED39 | protein_coding | tolerated(0.42) | benign(0.071) | TCGA-A6-3808-01 | Colorectum | colon adenocarcinoma | Male | >=65 | I/II | Unknown | Unknown | SD |
| KNOP1 | SNV | Missense_Mutation | rs757928834 | c.1064N>T | p.Thr355Met | p.T355M | Q1ED39 | protein_coding | tolerated(0.11) | benign(0.01) | TCGA-AA-A01R-01 | Colorectum | colon adenocarcinoma | Male | <65 | III/IV | Chemotherapy | 5-fluorouracil | PD |
| KNOP1 | SNV | Missense_Mutation | c.785N>A | p.Pro262His | p.P262H | Q1ED39 | protein_coding | deleterious(0.02) | possibly_damaging(0.874) | TCGA-CM-5861-01 | Colorectum | colon adenocarcinoma | Female | <65 | I/II | Unknown | Unknown | PD | |
| KNOP1 | insertion | Frame_Shift_Ins | novel | c.467_468insA | p.Ala158GlyfsTer16 | p.A158Gfs*16 | Q1ED39 | protein_coding | TCGA-A6-5665-01 | Colorectum | colon adenocarcinoma | Female | >=65 | I/II | Unknown | Unknown | PD | ||
| KNOP1 | deletion | Frame_Shift_Del | c.1119delA | p.Lys373AsnfsTer2 | p.K373Nfs*2 | Q1ED39 | protein_coding | TCGA-CM-4743-01 | Colorectum | colon adenocarcinoma | Male | >=65 | I/II | Chemotherapy | capecitabine | SD | |||
| KNOP1 | SNV | Missense_Mutation | novel | c.564N>T | p.Lys188Asn | p.K188N | Q1ED39 | protein_coding | tolerated(0.08) | benign(0.018) | TCGA-A5-A0G2-01 | Endometrium | uterine corpus endometrioid carcinoma | Female | <65 | III/IV | Unknown | Unknown | SD |
| KNOP1 | SNV | Missense_Mutation | novel | c.876N>T | p.Lys292Asn | p.K292N | Q1ED39 | protein_coding | deleterious(0.02) | possibly_damaging(0.876) | TCGA-A5-A1OF-01 | Endometrium | uterine corpus endometrioid carcinoma | Female | <65 | I/II | Unknown | Unknown | SD |
| Page: 1 2 3 |
Top |
Related drugs of malignant transformation related genes |
| Identification of chemicals and drugs interact with genes involved in malignant transfromation |
| (DGIdb 4.0) |
| Entrez ID | Symbol | Category | Interaction Types | Drug Claim Name | Drug Name | PMIDs |
| Page: 1 |

Copyright 2023-Present -The University of Texas Health Science Center at Houston |