
|
|||||
|
 | |
| |
| |
| |
| |
| |
|
Gene: KNL1 |
Gene summary for KNL1 |
| Gene information | Species | Human | Gene symbol | KNL1 | Gene ID | 57082 |
| Gene name | kinetochore scaffold 1 | |
| Gene Alias | AF15Q14 | |
| Cytomap | 15q15.1 | |
| Gene Type | protein-coding | GO ID | GO:0000003 | UniProtAcc | Q8NG31 |
Top |
Malignant transformation analysis |
| Identification of the aberrant gene expression in precancerous and cancerous lesions by comparing the gene expression of stem-like cells in diseased tissues with normal stem cells |
| Entrez ID | Symbol | Replicates | Species | Organ | Tissue | Adj P-value | Log2FC | Malignancy |
| 57082 | KNL1 | HSIL_HPV_2 | Human | Cervix | HSIL_HPV | 4.38e-03 | 1.79e-01 | 0.0208 |
| 57082 | KNL1 | CCI_1 | Human | Cervix | CC | 3.54e-02 | 6.86e-01 | 0.528 |
| 57082 | KNL1 | CCI_2 | Human | Cervix | CC | 1.17e-17 | 1.21e+00 | 0.5249 |
| 57082 | KNL1 | sample3 | Human | Cervix | CC | 1.29e-03 | 1.12e-01 | 0.1387 |
| 57082 | KNL1 | T3 | Human | Cervix | CC | 1.16e-04 | 1.24e-01 | 0.1389 |
| 57082 | KNL1 | HCC2 | Human | Liver | HCC | 5.93e-12 | 2.79e+00 | 0.5341 |
| 57082 | KNL1 | HCC5 | Human | Liver | HCC | 1.19e-05 | 1.38e+00 | 0.4932 |
| 57082 | KNL1 | S014 | Human | Liver | HCC | 7.44e-07 | 2.23e-01 | 0.2254 |
| 57082 | KNL1 | S015 | Human | Liver | HCC | 1.71e-04 | 2.04e-01 | 0.2375 |
| 57082 | KNL1 | S016 | Human | Liver | HCC | 2.02e-04 | 1.90e-01 | 0.2243 |
| 57082 | KNL1 | S028 | Human | Liver | HCC | 2.76e-10 | 4.71e-01 | 0.2503 |
| 57082 | KNL1 | S029 | Human | Liver | HCC | 3.09e-09 | 3.97e-01 | 0.2581 |
| 57082 | KNL1 | ATC12 | Human | Thyroid | ATC | 1.21e-03 | 2.61e-01 | 0.34 |
| 57082 | KNL1 | ATC13 | Human | Thyroid | ATC | 5.14e-03 | 1.39e-01 | 0.34 |
| 57082 | KNL1 | ATC2 | Human | Thyroid | ATC | 3.34e-11 | 9.98e-01 | 0.34 |
| 57082 | KNL1 | ATC4 | Human | Thyroid | ATC | 1.06e-08 | 3.32e-01 | 0.34 |
| 57082 | KNL1 | ATC5 | Human | Thyroid | ATC | 2.41e-03 | 2.49e-01 | 0.34 |
| Page: 1 |
| Tissue | Expression Dynamics | Abbreviation |
| Cervix | 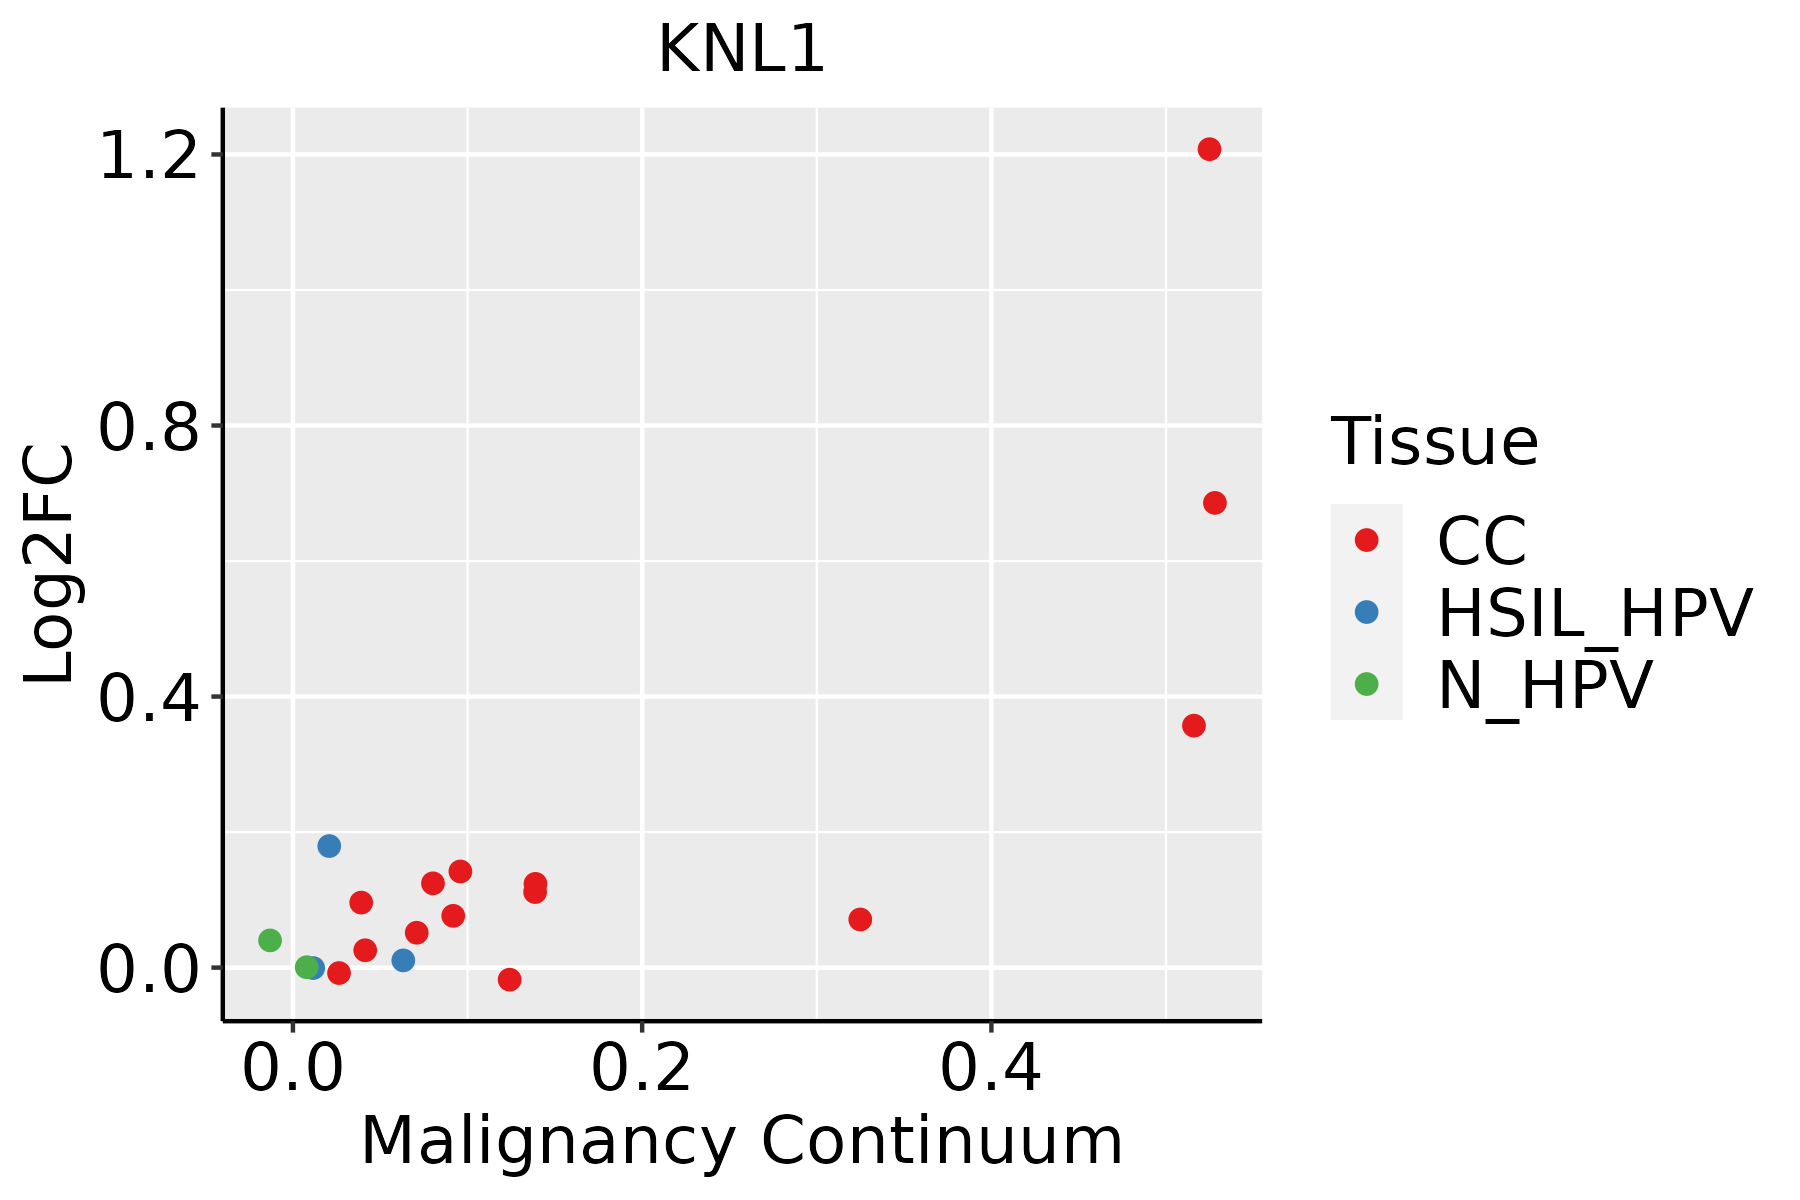 | CC: Cervix cancer |
| HSIL_HPV: HPV-infected high-grade squamous intraepithelial lesions | ||
| N_HPV: HPV-infected normal cervix | ||
| Liver |  | HCC: Hepatocellular carcinoma |
| NAFLD: Non-alcoholic fatty liver disease | ||
| Thyroid |  | ATC: Anaplastic thyroid cancer |
| HT: Hashimoto's thyroiditis | ||
| PTC: Papillary thyroid cancer |
| ∗log2FC in expression of this searched gene in stem-like cells from each diseased tissue sample relative to stem-like cells in normal samples in each tissue plotted against the malignancy continuum. Samples are colored based on if they are from different disease stage. |
Top |
Malignant transformation related pathway analysis |
| Find out the enriched GO biological processes and KEGG pathways involved in transition from healthy to precancer to cancer |
| Tissue | Disease Stage | Enriched GO biological Processes |
| Colorectum | AD |  |
| Colorectum | SER |  |
| Colorectum | MSS |  |
| Colorectum | MSI-H |  |
| Colorectum | FAP |  |
| ∗Top 15 enriched GO BP terms are showed in the bar plot of each disease state in each tissue. Each row represents a significant GO biological process which is colored according to the -log10(p.adjust). |
| Page: 1 2 3 4 5 6 7 8 9 |
| GO ID | Tissue | Disease Stage | Description | Gene Ratio | Bg Ratio | pvalue | p.adjust | Count |
| GO:00160506 | Cervix | CC | vesicle organization | 54/2311 | 300/18723 | 2.71e-03 | 1.85e-02 | 54 |
| GO:001605021 | Liver | HCC | vesicle organization | 194/7958 | 300/18723 | 5.58e-15 | 3.97e-13 | 194 |
| GO:0007059 | Liver | HCC | chromosome segregation | 197/7958 | 346/18723 | 3.57e-08 | 7.87e-07 | 197 |
| GO:0098813 | Liver | HCC | nuclear chromosome segregation | 157/7958 | 281/18723 | 3.82e-06 | 4.95e-05 | 157 |
| GO:00345021 | Liver | HCC | protein localization to chromosome | 55/7958 | 92/18723 | 6.12e-04 | 3.82e-03 | 55 |
| GO:001605023 | Thyroid | ATC | vesicle organization | 166/6293 | 300/18723 | 6.14e-15 | 3.92e-13 | 166 |
| GO:000705913 | Thyroid | ATC | chromosome segregation | 183/6293 | 346/18723 | 8.03e-14 | 4.23e-12 | 183 |
| GO:009881312 | Thyroid | ATC | nuclear chromosome segregation | 145/6293 | 281/18723 | 3.06e-10 | 8.61e-09 | 145 |
| GO:003450212 | Thyroid | ATC | protein localization to chromosome | 52/6293 | 92/18723 | 5.21e-06 | 5.61e-05 | 52 |
| GO:00086083 | Thyroid | ATC | attachment of spindle microtubules to kinetochore | 23/6293 | 35/18723 | 1.03e-04 | 7.41e-04 | 23 |
| Page: 1 |
| Pathway ID | Tissue | Disease Stage | Description | Gene Ratio | Bg Ratio | pvalue | p.adjust | qvalue | Count |
| hsa041106 | Cervix | CC | Cell cycle | 36/1267 | 157/8465 | 4.94e-03 | 1.67e-02 | 9.86e-03 | 36 |
| hsa0411013 | Cervix | CC | Cell cycle | 36/1267 | 157/8465 | 4.94e-03 | 1.67e-02 | 9.86e-03 | 36 |
| hsa041102 | Liver | HCC | Cell cycle | 106/4020 | 157/8465 | 2.54e-07 | 3.04e-06 | 1.69e-06 | 106 |
| hsa041103 | Liver | HCC | Cell cycle | 106/4020 | 157/8465 | 2.54e-07 | 3.04e-06 | 1.69e-06 | 106 |
| Page: 1 |
Top |
Cell-cell communication analysis |
| Identification of potential cell-cell interactions between two cell types and their ligand-receptor pairs for different disease states |
| Ligand | Receptor | LRpair | Pathway | Tissue | Disease Stage |
| Page: 1 |
Top |
Single-cell gene regulatory network inference analysis |
| Find out the significant the regulons (TFs) and the target genes of each regulon across cell types for different disease states |
| TF | Cell Type | Tissue | Disease Stage | Target Gene | RSS | Regulon Activity |
| ∗The dot plots of a searched regulon are shown for all cell subpopulations in each disease state of each tissue based on the regulon specific score inferred using pySCENIC and by calculating the average expression. |
| Page: 1 |
Top |
Somatic mutation of malignant transformation related genes |
| Annotation of somatic variants for genes involved in malignant transformation |
| Hugo Symbol | Variant Class | Variant Classification | dbSNP RS | HGVSc | HGVSp | HGVSp Short | SWISSPROT | BIOTYPE | SIFT | PolyPhen | Tumor Sample Barcode | Tissue | Histology | Sex | Age | Stage | Therapy Types | Drugs | Outcome |
| KNL1 | SNV | Missense_Mutation | c.2334N>A | p.Met778Ile | p.M778I | Q8NG31 | protein_coding | tolerated(0.83) | benign(0) | TCGA-A2-A04W-01 | Breast | breast invasive carcinoma | Female | <65 | I/II | Chemotherapy | cytoxan | SD | |
| KNL1 | SNV | Missense_Mutation | c.6340G>C | p.Asp2114His | p.D2114H | Q8NG31 | protein_coding | deleterious(0.01) | possibly_damaging(0.789) | TCGA-A8-A094-01 | Breast | breast invasive carcinoma | Female | >=65 | I/II | Unknown | Unknown | SD | |
| KNL1 | SNV | Missense_Mutation | c.2494G>C | p.Glu832Gln | p.E832Q | Q8NG31 | protein_coding | deleterious(0.03) | possibly_damaging(0.55) | TCGA-AC-A23H-01 | Breast | breast invasive carcinoma | Female | >=65 | I/II | Unknown | Unknown | PD | |
| KNL1 | SNV | Missense_Mutation | novel | c.3419C>A | p.Ser1140Tyr | p.S1140Y | Q8NG31 | protein_coding | tolerated(0.05) | possibly_damaging(0.847) | TCGA-AN-A046-01 | Breast | breast invasive carcinoma | Female | >=65 | I/II | Unknown | Unknown | SD |
| KNL1 | SNV | Missense_Mutation | c.1479N>G | p.Asp493Glu | p.D493E | Q8NG31 | protein_coding | tolerated(0.22) | benign(0.391) | TCGA-AR-A250-01 | Breast | breast invasive carcinoma | Female | <65 | I/II | Chemotherapy | doxorubicin | SD | |
| KNL1 | SNV | Missense_Mutation | c.6516G>C | p.Lys2172Asn | p.K2172N | Q8NG31 | protein_coding | tolerated(0.34) | benign(0.063) | TCGA-B6-A0I2-01 | Breast | breast invasive carcinoma | Female | <65 | I/II | Unknown | Unknown | SD | |
| KNL1 | SNV | Missense_Mutation | c.2509N>G | p.Ser837Gly | p.S837G | Q8NG31 | protein_coding | tolerated(0.25) | benign(0.001) | TCGA-BH-A18G-01 | Breast | breast invasive carcinoma | Female | >=65 | I/II | Unknown | Unknown | SD | |
| KNL1 | SNV | Missense_Mutation | c.2719N>C | p.Glu907Gln | p.E907Q | Q8NG31 | protein_coding | deleterious(0.03) | possibly_damaging(0.7) | TCGA-LD-A74U-01 | Breast | breast invasive carcinoma | Female | >=65 | III/IV | Chemotherapy | taxotere | SD | |
| KNL1 | SNV | Missense_Mutation | novel | c.5311G>C | p.Glu1771Gln | p.E1771Q | Q8NG31 | protein_coding | deleterious(0.02) | benign(0.082) | TCGA-XX-A89A-01 | Breast | breast invasive carcinoma | Female | >=65 | I/II | Unknown | Unknown | SD |
| KNL1 | insertion | Nonsense_Mutation | novel | c.5445_5446insTGGTGGAAATAGATAACGAAAGTGCCCT | p.Asp1816TrpfsTer4 | p.D1816Wfs*4 | Q8NG31 | protein_coding | TCGA-A8-A06X-01 | Breast | breast invasive carcinoma | Female | >=65 | I/II | Unknown | Unknown | SD |
| Page: 1 2 3 4 5 6 7 8 9 10 11 12 13 14 15 16 17 18 19 20 21 22 23 24 |
Top |
Related drugs of malignant transformation related genes |
| Identification of chemicals and drugs interact with genes involved in malignant transfromation |
| (DGIdb 4.0) |
| Entrez ID | Symbol | Category | Interaction Types | Drug Claim Name | Drug Name | PMIDs |
| Page: 1 |

Copyright 2023-Present -The University of Texas Health Science Center at Houston |