
|
|||||
|
 | |
| |
| |
| |
| |
| |
|
Gene: KMT5C |
Gene summary for KMT5C |
| Gene information | Species | Human | Gene symbol | KMT5C | Gene ID | 84787 |
| Gene name | lysine methyltransferase 5C | |
| Gene Alias | SUV420H2 | |
| Cytomap | 19q13.42 | |
| Gene Type | protein-coding | GO ID | GO:0000018 | UniProtAcc | Q86Y97 |
Top |
Malignant transformation analysis |
| Identification of the aberrant gene expression in precancerous and cancerous lesions by comparing the gene expression of stem-like cells in diseased tissues with normal stem cells |
| Entrez ID | Symbol | Replicates | Species | Organ | Tissue | Adj P-value | Log2FC | Malignancy |
| 84787 | KMT5C | LZE7T | Human | Esophagus | ESCC | 7.11e-04 | 2.38e-01 | 0.0667 |
| 84787 | KMT5C | LZE24T | Human | Esophagus | ESCC | 1.73e-09 | 2.87e-01 | 0.0596 |
| 84787 | KMT5C | P1T-E | Human | Esophagus | ESCC | 2.81e-09 | 3.54e-01 | 0.0875 |
| 84787 | KMT5C | P2T-E | Human | Esophagus | ESCC | 9.56e-08 | 1.87e-01 | 0.1177 |
| 84787 | KMT5C | P4T-E | Human | Esophagus | ESCC | 1.65e-03 | 1.32e-01 | 0.1323 |
| 84787 | KMT5C | P8T-E | Human | Esophagus | ESCC | 4.76e-16 | 2.74e-01 | 0.0889 |
| 84787 | KMT5C | P10T-E | Human | Esophagus | ESCC | 1.33e-14 | 2.62e-01 | 0.116 |
| 84787 | KMT5C | P11T-E | Human | Esophagus | ESCC | 1.55e-05 | 2.55e-01 | 0.1426 |
| 84787 | KMT5C | P12T-E | Human | Esophagus | ESCC | 7.62e-11 | 2.92e-01 | 0.1122 |
| 84787 | KMT5C | P15T-E | Human | Esophagus | ESCC | 2.51e-09 | 2.03e-01 | 0.1149 |
| 84787 | KMT5C | P16T-E | Human | Esophagus | ESCC | 3.08e-08 | 1.55e-01 | 0.1153 |
| 84787 | KMT5C | P20T-E | Human | Esophagus | ESCC | 1.28e-03 | 1.60e-01 | 0.1124 |
| 84787 | KMT5C | P21T-E | Human | Esophagus | ESCC | 7.33e-06 | 6.38e-02 | 0.1617 |
| 84787 | KMT5C | P22T-E | Human | Esophagus | ESCC | 3.17e-06 | 1.42e-01 | 0.1236 |
| 84787 | KMT5C | P23T-E | Human | Esophagus | ESCC | 5.41e-05 | 1.60e-01 | 0.108 |
| 84787 | KMT5C | P24T-E | Human | Esophagus | ESCC | 5.99e-05 | 1.25e-01 | 0.1287 |
| 84787 | KMT5C | P26T-E | Human | Esophagus | ESCC | 2.62e-17 | 2.55e-01 | 0.1276 |
| 84787 | KMT5C | P27T-E | Human | Esophagus | ESCC | 9.10e-13 | 2.36e-01 | 0.1055 |
| 84787 | KMT5C | P28T-E | Human | Esophagus | ESCC | 4.12e-11 | 2.24e-01 | 0.1149 |
| 84787 | KMT5C | P30T-E | Human | Esophagus | ESCC | 1.34e-07 | 2.31e-01 | 0.137 |
| Page: 1 2 3 |
| Tissue | Expression Dynamics | Abbreviation |
| Esophagus | 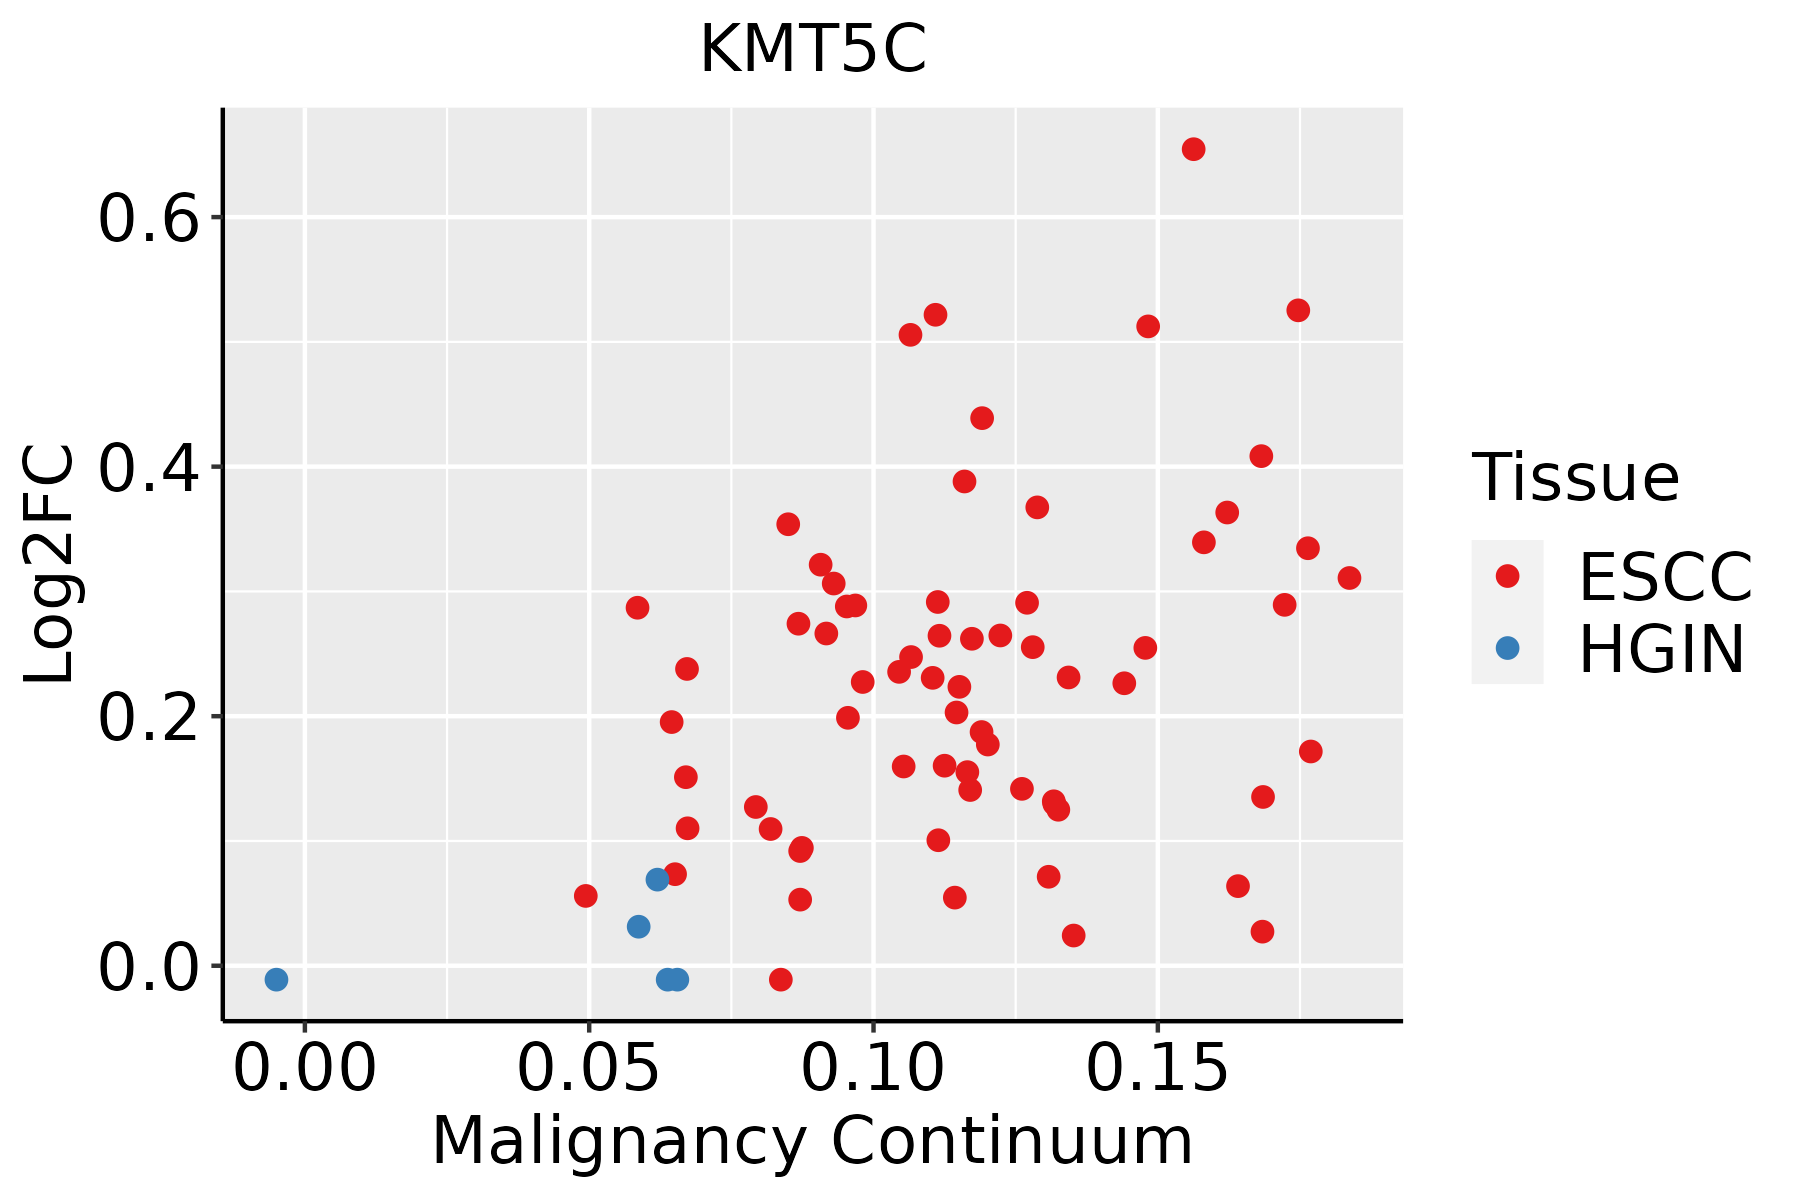 | ESCC: Esophageal squamous cell carcinoma |
| HGIN: High-grade intraepithelial neoplasias | ||
| LGIN: Low-grade intraepithelial neoplasias |
| ∗log2FC in expression of this searched gene in stem-like cells from each diseased tissue sample relative to stem-like cells in normal samples in each tissue plotted against the malignancy continuum. Samples are colored based on if they are from different disease stage. |
Top |
Malignant transformation related pathway analysis |
| Find out the enriched GO biological processes and KEGG pathways involved in transition from healthy to precancer to cancer |
| Tissue | Disease Stage | Enriched GO biological Processes |
| Colorectum | AD |  |
| Colorectum | SER |  |
| Colorectum | MSS |  |
| Colorectum | MSI-H |  |
| Colorectum | FAP |  |
| ∗Top 15 enriched GO BP terms are showed in the bar plot of each disease state in each tissue. Each row represents a significant GO biological process which is colored according to the -log10(p.adjust). |
| Page: 1 2 3 4 5 6 7 8 9 |
| GO ID | Tissue | Disease Stage | Description | Gene Ratio | Bg Ratio | pvalue | p.adjust | Count |
| GO:001657015 | Esophagus | ESCC | histone modification | 323/8552 | 463/18723 | 2.61e-26 | 7.88e-24 | 323 |
| GO:001820514 | Esophagus | ESCC | peptidyl-lysine modification | 259/8552 | 376/18723 | 3.90e-20 | 5.26e-18 | 259 |
| GO:005105215 | Esophagus | ESCC | regulation of DNA metabolic process | 232/8552 | 359/18723 | 2.40e-13 | 1.13e-11 | 232 |
| GO:005105417 | Esophagus | ESCC | positive regulation of DNA metabolic process | 139/8552 | 201/18723 | 1.20e-11 | 4.33e-10 | 139 |
| GO:00434143 | Esophagus | ESCC | macromolecule methylation | 199/8552 | 316/18723 | 3.44e-10 | 9.57e-09 | 199 |
| GO:2001020110 | Esophagus | ESCC | regulation of response to DNA damage stimulus | 145/8552 | 219/18723 | 5.97e-10 | 1.50e-08 | 145 |
| GO:00322592 | Esophagus | ESCC | methylation | 222/8552 | 364/18723 | 2.26e-09 | 5.09e-08 | 222 |
| GO:000647914 | Esophagus | ESCC | protein methylation | 115/8552 | 181/18723 | 9.07e-07 | 1.16e-05 | 115 |
| GO:000821314 | Esophagus | ESCC | protein alkylation | 115/8552 | 181/18723 | 9.07e-07 | 1.16e-05 | 115 |
| GO:00063024 | Esophagus | ESCC | double-strand break repair | 152/8552 | 251/18723 | 1.33e-06 | 1.62e-05 | 152 |
| GO:00165718 | Esophagus | ESCC | histone methylation | 89/8552 | 141/18723 | 2.17e-05 | 1.87e-04 | 89 |
| GO:20010228 | Esophagus | ESCC | positive regulation of response to DNA damage stimulus | 69/8552 | 105/18723 | 2.66e-05 | 2.22e-04 | 69 |
| GO:00062826 | Esophagus | ESCC | regulation of DNA repair | 82/8552 | 130/18723 | 4.65e-05 | 3.66e-04 | 82 |
| GO:00457395 | Esophagus | ESCC | positive regulation of DNA repair | 49/8552 | 73/18723 | 1.74e-04 | 1.14e-03 | 49 |
| GO:003496814 | Esophagus | ESCC | histone lysine methylation | 72/8552 | 115/18723 | 1.85e-04 | 1.18e-03 | 72 |
| GO:001802214 | Esophagus | ESCC | peptidyl-lysine methylation | 79/8552 | 131/18723 | 5.17e-04 | 2.86e-03 | 79 |
| GO:00063101 | Esophagus | ESCC | DNA recombination | 168/8552 | 305/18723 | 5.58e-04 | 3.05e-03 | 168 |
| GO:00025622 | Esophagus | ESCC | somatic diversification of immune receptors via germline recombination within a single locus | 43/8552 | 66/18723 | 1.10e-03 | 5.53e-03 | 43 |
| GO:0006303 | Esophagus | ESCC | double-strand break repair via nonhomologous end joining | 43/8552 | 66/18723 | 1.10e-03 | 5.53e-03 | 43 |
| GO:00164442 | Esophagus | ESCC | somatic cell DNA recombination | 43/8552 | 66/18723 | 1.10e-03 | 5.53e-03 | 43 |
| Page: 1 2 |
| Pathway ID | Tissue | Disease Stage | Description | Gene Ratio | Bg Ratio | pvalue | p.adjust | qvalue | Count |
| hsa0031010 | Esophagus | ESCC | Lysine degradation | 41/4205 | 63/8465 | 9.63e-03 | 2.27e-02 | 1.16e-02 | 41 |
| hsa0031013 | Esophagus | ESCC | Lysine degradation | 41/4205 | 63/8465 | 9.63e-03 | 2.27e-02 | 1.16e-02 | 41 |
| Page: 1 |
Top |
Cell-cell communication analysis |
| Identification of potential cell-cell interactions between two cell types and their ligand-receptor pairs for different disease states |
| Ligand | Receptor | LRpair | Pathway | Tissue | Disease Stage |
| Page: 1 |
Top |
Single-cell gene regulatory network inference analysis |
| Find out the significant the regulons (TFs) and the target genes of each regulon across cell types for different disease states |
| TF | Cell Type | Tissue | Disease Stage | Target Gene | RSS | Regulon Activity |
| ∗The dot plots of a searched regulon are shown for all cell subpopulations in each disease state of each tissue based on the regulon specific score inferred using pySCENIC and by calculating the average expression. |
| Page: 1 |
Top |
Somatic mutation of malignant transformation related genes |
| Annotation of somatic variants for genes involved in malignant transformation |
| Hugo Symbol | Variant Class | Variant Classification | dbSNP RS | HGVSc | HGVSp | HGVSp Short | SWISSPROT | BIOTYPE | SIFT | PolyPhen | Tumor Sample Barcode | Tissue | Histology | Sex | Age | Stage | Therapy Types | Drugs | Outcome |
| KMT5C | SNV | Missense_Mutation | novel | c.782N>A | p.Leu261Gln | p.L261Q | Q86Y97 | protein_coding | deleterious(0) | possibly_damaging(0.831) | TCGA-A8-A07R-01 | Breast | breast invasive carcinoma | Female | >=65 | III/IV | Ancillary | zoledronic | SD |
| KMT5C | SNV | Missense_Mutation | novel | c.655N>A | p.Glu219Lys | p.E219K | Q86Y97 | protein_coding | tolerated(0.1) | benign(0.011) | TCGA-BH-A0B6-01 | Breast | breast invasive carcinoma | Female | <65 | I/II | Unknown | Unknown | SD |
| KMT5C | SNV | Missense_Mutation | novel | c.535G>A | p.Ala179Thr | p.A179T | Q86Y97 | protein_coding | deleterious(0.01) | possibly_damaging(0.76) | TCGA-EK-A2PK-01 | Cervix | cervical & endocervical cancer | Female | <65 | I/II | Unknown | Unknown | SD |
| KMT5C | SNV | Missense_Mutation | novel | c.787G>A | p.Glu263Lys | p.E263K | Q86Y97 | protein_coding | deleterious(0) | benign(0.187) | TCGA-MA-AA41-01 | Cervix | cervical & endocervical cancer | Female | <65 | I/II | Unknown | Unknown | SD |
| KMT5C | SNV | Missense_Mutation | novel | c.436C>T | p.Arg146Trp | p.R146W | Q86Y97 | protein_coding | deleterious(0) | probably_damaging(0.981) | TCGA-5M-AAT6-01 | Colorectum | colon adenocarcinoma | Female | <65 | III/IV | Unknown | Unknown | PD |
| KMT5C | SNV | Missense_Mutation | rs774927761 | c.106N>A | p.Val36Ile | p.V36I | Q86Y97 | protein_coding | tolerated(0.42) | benign(0.054) | TCGA-A6-5665-01 | Colorectum | colon adenocarcinoma | Female | >=65 | I/II | Unknown | Unknown | PD |
| KMT5C | SNV | Missense_Mutation | rs769760559 | c.370N>A | p.Val124Met | p.V124M | Q86Y97 | protein_coding | deleterious(0) | probably_damaging(0.965) | TCGA-AZ-4313-01 | Colorectum | colon adenocarcinoma | Female | <65 | I/II | Unknown | Unknown | SD |
| KMT5C | SNV | Missense_Mutation | rs759434740 | c.850N>T | p.Arg284Trp | p.R284W | Q86Y97 | protein_coding | tolerated(0.14) | benign(0) | TCGA-AZ-4313-01 | Colorectum | colon adenocarcinoma | Female | <65 | I/II | Unknown | Unknown | SD |
| KMT5C | SNV | Missense_Mutation | c.527N>C | p.Gly176Ala | p.G176A | Q86Y97 | protein_coding | deleterious(0.02) | benign(0.33) | TCGA-CK-4951-01 | Colorectum | colon adenocarcinoma | Female | >=65 | I/II | Unknown | Unknown | PD | |
| KMT5C | SNV | Missense_Mutation | rs778738858 | c.1058N>A | p.Arg353His | p.R353H | Q86Y97 | protein_coding | tolerated_low_confidence(0.54) | benign(0.06) | TCGA-F4-6570-01 | Colorectum | colon adenocarcinoma | Female | >=65 | I/II | Unknown | Unknown | SD |
| Page: 1 2 3 4 |
Top |
Related drugs of malignant transformation related genes |
| Identification of chemicals and drugs interact with genes involved in malignant transfromation |
| (DGIdb 4.0) |
| Entrez ID | Symbol | Category | Interaction Types | Drug Claim Name | Drug Name | PMIDs |
| 84787 | KMT5C | ENZYME, METHYL TRANSFERASE, DNA REPAIR | inhibitor | 310264730 |
| Page: 1 |

Copyright 2023-Present -The University of Texas Health Science Center at Houston |