
|
|||||
|
 | |
| |
| |
| |
| |
| |
|
Gene: KMT5B |
Gene summary for KMT5B |
| Gene information | Species | Human | Gene symbol | KMT5B | Gene ID | 51111 |
| Gene name | lysine methyltransferase 5B | |
| Gene Alias | CGI-85 | |
| Cytomap | 11q13.2 | |
| Gene Type | protein-coding | GO ID | GO:0000018 | UniProtAcc | B7WNX0 |
Top |
Malignant transformation analysis |
| Identification of the aberrant gene expression in precancerous and cancerous lesions by comparing the gene expression of stem-like cells in diseased tissues with normal stem cells |
| Entrez ID | Symbol | Replicates | Species | Organ | Tissue | Adj P-value | Log2FC | Malignancy |
| 51111 | KMT5B | HTA11_3410_2000001011 | Human | Colorectum | AD | 1.59e-05 | -3.81e-01 | 0.0155 |
| 51111 | KMT5B | HTA11_347_2000001011 | Human | Colorectum | AD | 4.71e-12 | 6.37e-01 | -0.1954 |
| 51111 | KMT5B | HTA11_99999974143_84620 | Human | Colorectum | MSS | 3.15e-10 | -4.29e-01 | 0.3005 |
| 51111 | KMT5B | A001-C-207 | Human | Colorectum | FAP | 3.55e-03 | -2.02e-01 | 0.1278 |
| 51111 | KMT5B | A015-C-203 | Human | Colorectum | FAP | 1.15e-19 | -2.51e-01 | -0.1294 |
| 51111 | KMT5B | A015-C-204 | Human | Colorectum | FAP | 6.09e-04 | -2.00e-01 | -0.0228 |
| 51111 | KMT5B | A014-C-040 | Human | Colorectum | FAP | 3.44e-03 | -2.97e-01 | -0.1184 |
| 51111 | KMT5B | A002-C-201 | Human | Colorectum | FAP | 7.23e-12 | -3.40e-01 | 0.0324 |
| 51111 | KMT5B | A002-C-203 | Human | Colorectum | FAP | 4.42e-02 | -1.34e-01 | 0.2786 |
| 51111 | KMT5B | A001-C-119 | Human | Colorectum | FAP | 1.34e-03 | -5.09e-02 | -0.1557 |
| 51111 | KMT5B | A001-C-108 | Human | Colorectum | FAP | 9.11e-13 | -1.97e-01 | -0.0272 |
| 51111 | KMT5B | A002-C-205 | Human | Colorectum | FAP | 2.18e-18 | -2.26e-01 | -0.1236 |
| 51111 | KMT5B | A001-C-104 | Human | Colorectum | FAP | 4.65e-02 | -1.39e-01 | 0.0184 |
| 51111 | KMT5B | A015-C-006 | Human | Colorectum | FAP | 2.02e-13 | -3.85e-01 | -0.0994 |
| 51111 | KMT5B | A015-C-106 | Human | Colorectum | FAP | 2.33e-08 | -1.97e-01 | -0.0511 |
| 51111 | KMT5B | A002-C-114 | Human | Colorectum | FAP | 2.13e-14 | -3.05e-01 | -0.1561 |
| 51111 | KMT5B | A015-C-104 | Human | Colorectum | FAP | 6.24e-22 | -3.05e-01 | -0.1899 |
| 51111 | KMT5B | A001-C-014 | Human | Colorectum | FAP | 1.22e-08 | -2.23e-01 | 0.0135 |
| 51111 | KMT5B | A002-C-016 | Human | Colorectum | FAP | 5.01e-22 | -3.29e-01 | 0.0521 |
| 51111 | KMT5B | A015-C-002 | Human | Colorectum | FAP | 3.63e-09 | -3.64e-01 | -0.0763 |
| Page: 1 2 3 4 5 6 7 |
| Tissue | Expression Dynamics | Abbreviation |
| Colorectum (GSE201348) |  | FAP: Familial adenomatous polyposis |
| CRC: Colorectal cancer | ||
| Colorectum (HTA11) |  | AD: Adenomas |
| SER: Sessile serrated lesions | ||
| MSI-H: Microsatellite-high colorectal cancer | ||
| MSS: Microsatellite stable colorectal cancer | ||
| Esophagus |  | ESCC: Esophageal squamous cell carcinoma |
| HGIN: High-grade intraepithelial neoplasias | ||
| LGIN: Low-grade intraepithelial neoplasias | ||
| Liver |  | HCC: Hepatocellular carcinoma |
| NAFLD: Non-alcoholic fatty liver disease | ||
| Oral Cavity |  | EOLP: Erosive Oral lichen planus |
| LP: leukoplakia | ||
| NEOLP: Non-erosive oral lichen planus | ||
| OSCC: Oral squamous cell carcinoma | ||
| Thyroid | 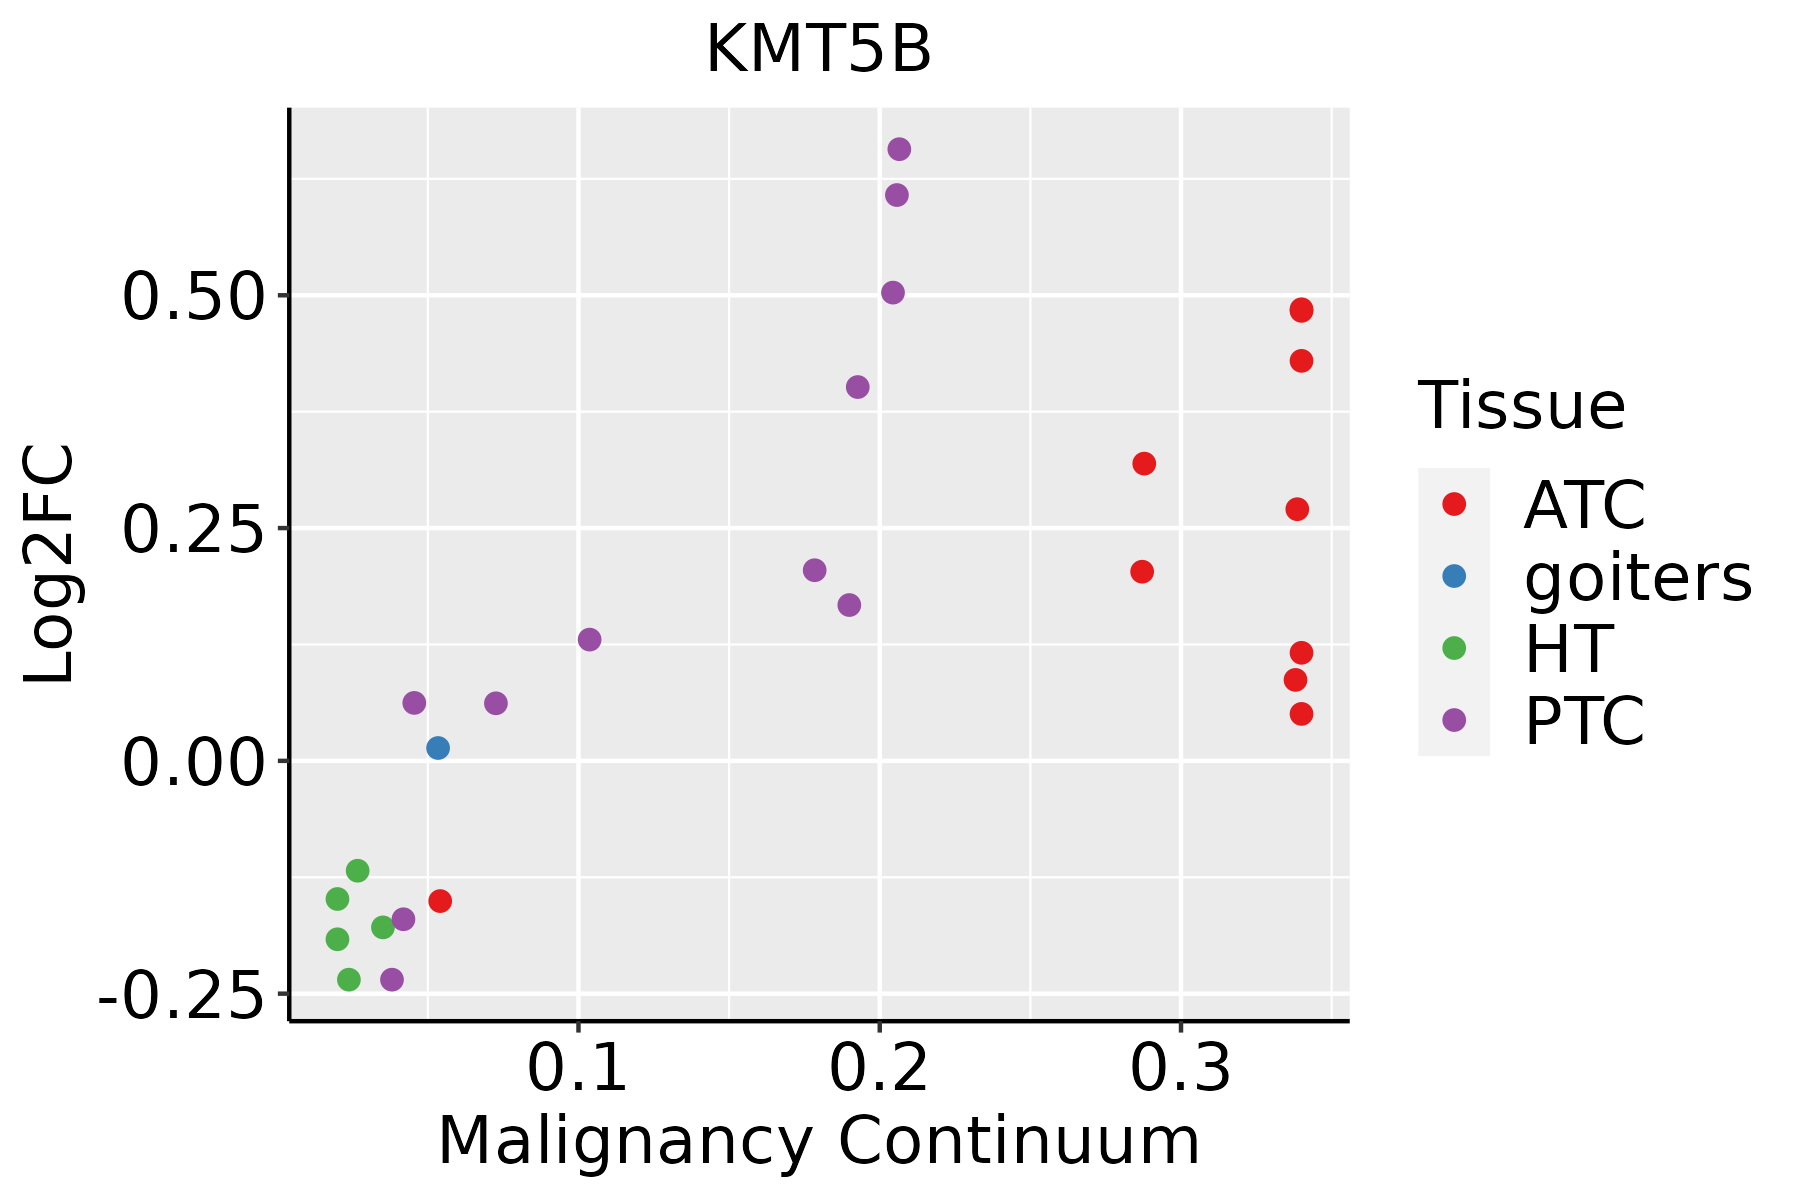 | ATC: Anaplastic thyroid cancer |
| HT: Hashimoto's thyroiditis | ||
| PTC: Papillary thyroid cancer |
| ∗log2FC in expression of this searched gene in stem-like cells from each diseased tissue sample relative to stem-like cells in normal samples in each tissue plotted against the malignancy continuum. Samples are colored based on if they are from different disease stage. |
Top |
Malignant transformation related pathway analysis |
| Find out the enriched GO biological processes and KEGG pathways involved in transition from healthy to precancer to cancer |
| Tissue | Disease Stage | Enriched GO biological Processes |
| Colorectum | AD |  |
| Colorectum | SER |  |
| Colorectum | MSS |  |
| Colorectum | MSI-H |  |
| Colorectum | FAP |  |
| ∗Top 15 enriched GO BP terms are showed in the bar plot of each disease state in each tissue. Each row represents a significant GO biological process which is colored according to the -log10(p.adjust). |
| Page: 1 2 3 4 5 6 7 8 9 |
| GO ID | Tissue | Disease Stage | Description | Gene Ratio | Bg Ratio | pvalue | p.adjust | Count |
| GO:0051052 | Colorectum | AD | regulation of DNA metabolic process | 116/3918 | 359/18723 | 2.47e-07 | 1.00e-05 | 116 |
| GO:0051054 | Colorectum | AD | positive regulation of DNA metabolic process | 73/3918 | 201/18723 | 3.27e-07 | 1.29e-05 | 73 |
| GO:2001020 | Colorectum | AD | regulation of response to DNA damage stimulus | 71/3918 | 219/18723 | 4.38e-05 | 7.65e-04 | 71 |
| GO:2001022 | Colorectum | AD | positive regulation of response to DNA damage stimulus | 36/3918 | 105/18723 | 1.02e-03 | 9.47e-03 | 36 |
| GO:0006282 | Colorectum | AD | regulation of DNA repair | 42/3918 | 130/18723 | 1.57e-03 | 1.32e-02 | 42 |
| GO:00510522 | Colorectum | MSS | regulation of DNA metabolic process | 108/3467 | 359/18723 | 5.86e-08 | 3.10e-06 | 108 |
| GO:00510542 | Colorectum | MSS | positive regulation of DNA metabolic process | 69/3467 | 201/18723 | 6.33e-08 | 3.26e-06 | 69 |
| GO:20010202 | Colorectum | MSS | regulation of response to DNA damage stimulus | 64/3467 | 219/18723 | 7.20e-05 | 1.21e-03 | 64 |
| GO:0016570 | Colorectum | MSS | histone modification | 113/3467 | 463/18723 | 8.37e-04 | 8.68e-03 | 113 |
| GO:20010221 | Colorectum | MSS | positive regulation of response to DNA damage stimulus | 33/3467 | 105/18723 | 9.83e-04 | 9.86e-03 | 33 |
| GO:00062821 | Colorectum | MSS | regulation of DNA repair | 38/3467 | 130/18723 | 1.93e-03 | 1.67e-02 | 38 |
| GO:0006302 | Colorectum | MSS | double-strand break repair | 64/3467 | 251/18723 | 3.58e-03 | 2.65e-02 | 64 |
| GO:0045739 | Colorectum | MSS | positive regulation of DNA repair | 23/3467 | 73/18723 | 5.22e-03 | 3.57e-02 | 23 |
| GO:00510524 | Colorectum | FAP | regulation of DNA metabolic process | 84/2622 | 359/18723 | 9.80e-07 | 4.38e-05 | 84 |
| GO:00510544 | Colorectum | FAP | positive regulation of DNA metabolic process | 53/2622 | 201/18723 | 2.55e-06 | 9.82e-05 | 53 |
| GO:00165701 | Colorectum | FAP | histone modification | 94/2622 | 463/18723 | 1.06e-04 | 1.76e-03 | 94 |
| GO:20010204 | Colorectum | FAP | regulation of response to DNA damage stimulus | 51/2622 | 219/18723 | 1.40e-04 | 2.21e-03 | 51 |
| GO:00062822 | Colorectum | FAP | regulation of DNA repair | 32/2622 | 130/18723 | 8.53e-04 | 8.79e-03 | 32 |
| GO:20010222 | Colorectum | FAP | positive regulation of response to DNA damage stimulus | 27/2622 | 105/18723 | 1.04e-03 | 1.02e-02 | 27 |
| GO:0006479 | Colorectum | FAP | protein methylation | 39/2622 | 181/18723 | 3.60e-03 | 2.58e-02 | 39 |
| Page: 1 2 3 4 5 6 7 8 9 10 11 |
| Pathway ID | Tissue | Disease Stage | Description | Gene Ratio | Bg Ratio | pvalue | p.adjust | qvalue | Count |
| hsa00310 | Colorectum | AD | Lysine degradation | 27/2092 | 63/8465 | 1.17e-03 | 7.75e-03 | 4.94e-03 | 27 |
| hsa003101 | Colorectum | AD | Lysine degradation | 27/2092 | 63/8465 | 1.17e-03 | 7.75e-03 | 4.94e-03 | 27 |
| hsa003104 | Colorectum | FAP | Lysine degradation | 23/1404 | 63/8465 | 1.04e-04 | 9.46e-04 | 5.76e-04 | 23 |
| hsa003105 | Colorectum | FAP | Lysine degradation | 23/1404 | 63/8465 | 1.04e-04 | 9.46e-04 | 5.76e-04 | 23 |
| hsa003106 | Colorectum | CRC | Lysine degradation | 18/1091 | 63/8465 | 7.21e-04 | 6.34e-03 | 4.30e-03 | 18 |
| hsa003107 | Colorectum | CRC | Lysine degradation | 18/1091 | 63/8465 | 7.21e-04 | 6.34e-03 | 4.30e-03 | 18 |
| hsa0031010 | Esophagus | ESCC | Lysine degradation | 41/4205 | 63/8465 | 9.63e-03 | 2.27e-02 | 1.16e-02 | 41 |
| hsa0031013 | Esophagus | ESCC | Lysine degradation | 41/4205 | 63/8465 | 9.63e-03 | 2.27e-02 | 1.16e-02 | 41 |
| hsa003108 | Liver | NAFLD | Lysine degradation | 21/1043 | 63/8465 | 1.09e-05 | 3.58e-04 | 2.89e-04 | 21 |
| hsa0031011 | Liver | NAFLD | Lysine degradation | 21/1043 | 63/8465 | 1.09e-05 | 3.58e-04 | 2.89e-04 | 21 |
| hsa0031021 | Liver | Cirrhotic | Lysine degradation | 29/2530 | 63/8465 | 4.81e-03 | 1.74e-02 | 1.07e-02 | 29 |
| hsa0031031 | Liver | Cirrhotic | Lysine degradation | 29/2530 | 63/8465 | 4.81e-03 | 1.74e-02 | 1.07e-02 | 29 |
| hsa0031041 | Liver | HCC | Lysine degradation | 47/4020 | 63/8465 | 1.02e-05 | 7.58e-05 | 4.22e-05 | 47 |
| hsa0031051 | Liver | HCC | Lysine degradation | 47/4020 | 63/8465 | 1.02e-05 | 7.58e-05 | 4.22e-05 | 47 |
| Page: 1 |
Top |
Cell-cell communication analysis |
| Identification of potential cell-cell interactions between two cell types and their ligand-receptor pairs for different disease states |
| Ligand | Receptor | LRpair | Pathway | Tissue | Disease Stage |
| Page: 1 |
Top |
Single-cell gene regulatory network inference analysis |
| Find out the significant the regulons (TFs) and the target genes of each regulon across cell types for different disease states |
| TF | Cell Type | Tissue | Disease Stage | Target Gene | RSS | Regulon Activity |
| ∗The dot plots of a searched regulon are shown for all cell subpopulations in each disease state of each tissue based on the regulon specific score inferred using pySCENIC and by calculating the average expression. |
| Page: 1 |
Top |
Somatic mutation of malignant transformation related genes |
| Annotation of somatic variants for genes involved in malignant transformation |
| Hugo Symbol | Variant Class | Variant Classification | dbSNP RS | HGVSc | HGVSp | HGVSp Short | SWISSPROT | BIOTYPE | SIFT | PolyPhen | Tumor Sample Barcode | Tissue | Histology | Sex | Age | Stage | Therapy Types | Drugs | Outcome |
| KMT5B | SNV | Missense_Mutation | c.1673C>A | p.Pro558Gln | p.P558Q | Q4FZB7 | protein_coding | deleterious(0) | probably_damaging(0.913) | TCGA-A2-A0D2-01 | Breast | breast invasive carcinoma | Female | <65 | I/II | Chemotherapy | adriamycin | SD | |
| KMT5B | SNV | Missense_Mutation | c.764C>T | p.Ser255Phe | p.S255F | Q4FZB7 | protein_coding | deleterious(0) | probably_damaging(0.999) | TCGA-A8-A0A7-01 | Breast | breast invasive carcinoma | Female | <65 | I/II | Unknown | Unknown | SD | |
| KMT5B | SNV | Missense_Mutation | novel | c.2161N>T | p.Arg721Cys | p.R721C | Q4FZB7 | protein_coding | deleterious(0) | probably_damaging(0.999) | TCGA-AN-A046-01 | Breast | breast invasive carcinoma | Female | >=65 | I/II | Unknown | Unknown | SD |
| KMT5B | SNV | Missense_Mutation | novel | c.577N>T | p.Ser193Cys | p.S193C | Q4FZB7 | protein_coding | deleterious(0.01) | possibly_damaging(0.871) | TCGA-AO-A1KS-01 | Breast | breast invasive carcinoma | Female | >=65 | I/II | Hormone Therapy | arimidex | SD |
| KMT5B | SNV | Missense_Mutation | c.2482N>A | p.Asp828Asn | p.D828N | Q4FZB7 | protein_coding | deleterious(0.05) | benign(0.152) | TCGA-BH-A209-01 | Breast | breast invasive carcinoma | Female | >=65 | I/II | Unknown | Unknown | SD | |
| KMT5B | SNV | Missense_Mutation | c.746N>G | p.Asp249Gly | p.D249G | Q4FZB7 | protein_coding | deleterious(0) | probably_damaging(0.999) | TCGA-C8-A12W-01 | Breast | breast invasive carcinoma | Female | <65 | III/IV | Unknown | Unknown | SD | |
| KMT5B | SNV | Missense_Mutation | rs146086325 | c.1921G>A | p.Ala641Thr | p.A641T | Q4FZB7 | protein_coding | tolerated(0.53) | benign(0.001) | TCGA-GM-A3NW-01 | Breast | breast invasive carcinoma | Female | <65 | I/II | Chemotherapy | fluorouracil | SD |
| KMT5B | insertion | Frame_Shift_Ins | novel | c.583_584insGTTCCCTATGTTATCTCCCAGGAAAAACATGTAGCTCCTCA | p.Phe195CysfsTer32 | p.F195Cfs*32 | Q4FZB7 | protein_coding | TCGA-AN-A0FS-01 | Breast | breast invasive carcinoma | Female | <65 | I/II | Unknown | Unknown | SD | ||
| KMT5B | deletion | Frame_Shift_Del | novel | c.2087delA | p.Lys696ArgfsTer12 | p.K696Rfs*12 | Q4FZB7 | protein_coding | TCGA-EW-A2FV-01 | Breast | breast invasive carcinoma | Female | <65 | III/IV | Chemotherapy | docetaxel | SD | ||
| KMT5B | SNV | Missense_Mutation | c.1362N>C | p.Leu454Phe | p.L454F | Q4FZB7 | protein_coding | deleterious(0.01) | probably_damaging(0.927) | TCGA-EK-A2PG-01 | Cervix | cervical & endocervical cancer | Female | >=65 | I/II | Unknown | Unknown | SD |
| Page: 1 2 3 4 5 6 7 8 9 10 11 |
Top |
Related drugs of malignant transformation related genes |
| Identification of chemicals and drugs interact with genes involved in malignant transfromation |
| (DGIdb 4.0) |
| Entrez ID | Symbol | Category | Interaction Types | Drug Claim Name | Drug Name | PMIDs |
| 51111 | KMT5B | DNA REPAIR, METHYL TRANSFERASE, ENZYME | inhibitor | 310264730 |
| Page: 1 |

Copyright 2023-Present -The University of Texas Health Science Center at Houston |