
|
|||||
|
 | |
| |
| |
| |
| |
| |
|
Gene: KMT5A |
Gene summary for KMT5A |
| Gene information | Species | Human | Gene symbol | KMT5A | Gene ID | 387893 |
| Gene name | lysine methyltransferase 5A | |
| Gene Alias | PR-Set7 | |
| Cytomap | 12q24.31 | |
| Gene Type | protein-coding | GO ID | GO:0000070 | UniProtAcc | E3VVS3 |
Top |
Malignant transformation analysis |
| Identification of the aberrant gene expression in precancerous and cancerous lesions by comparing the gene expression of stem-like cells in diseased tissues with normal stem cells |
| Entrez ID | Symbol | Replicates | Species | Organ | Tissue | Adj P-value | Log2FC | Malignancy |
| 387893 | KMT5A | LZE7T | Human | Esophagus | ESCC | 2.46e-02 | 2.16e-01 | 0.0667 |
| 387893 | KMT5A | LZE20T | Human | Esophagus | ESCC | 6.48e-03 | 1.77e-02 | 0.0662 |
| 387893 | KMT5A | LZE24T | Human | Esophagus | ESCC | 2.79e-04 | 1.11e-01 | 0.0596 |
| 387893 | KMT5A | LZE21T | Human | Esophagus | ESCC | 4.06e-02 | 8.06e-02 | 0.0655 |
| 387893 | KMT5A | P1T-E | Human | Esophagus | ESCC | 3.58e-02 | 3.46e-01 | 0.0875 |
| 387893 | KMT5A | P2T-E | Human | Esophagus | ESCC | 7.47e-14 | 3.59e-01 | 0.1177 |
| 387893 | KMT5A | P4T-E | Human | Esophagus | ESCC | 1.23e-18 | 5.08e-01 | 0.1323 |
| 387893 | KMT5A | P5T-E | Human | Esophagus | ESCC | 2.47e-10 | 1.92e-01 | 0.1327 |
| 387893 | KMT5A | P8T-E | Human | Esophagus | ESCC | 8.87e-11 | 1.37e-01 | 0.0889 |
| 387893 | KMT5A | P9T-E | Human | Esophagus | ESCC | 7.25e-13 | 1.00e-01 | 0.1131 |
| 387893 | KMT5A | P10T-E | Human | Esophagus | ESCC | 2.35e-12 | 3.00e-01 | 0.116 |
| 387893 | KMT5A | P12T-E | Human | Esophagus | ESCC | 6.92e-05 | 1.11e-01 | 0.1122 |
| 387893 | KMT5A | P15T-E | Human | Esophagus | ESCC | 2.82e-07 | 2.34e-01 | 0.1149 |
| 387893 | KMT5A | P16T-E | Human | Esophagus | ESCC | 5.93e-13 | 7.19e-02 | 0.1153 |
| 387893 | KMT5A | P19T-E | Human | Esophagus | ESCC | 4.49e-02 | 1.15e-01 | 0.1662 |
| 387893 | KMT5A | P20T-E | Human | Esophagus | ESCC | 9.63e-07 | 1.78e-01 | 0.1124 |
| 387893 | KMT5A | P21T-E | Human | Esophagus | ESCC | 2.39e-15 | 1.66e-01 | 0.1617 |
| 387893 | KMT5A | P22T-E | Human | Esophagus | ESCC | 1.16e-12 | 5.13e-02 | 0.1236 |
| 387893 | KMT5A | P23T-E | Human | Esophagus | ESCC | 5.91e-19 | 1.68e-01 | 0.108 |
| 387893 | KMT5A | P24T-E | Human | Esophagus | ESCC | 7.88e-11 | 3.13e-02 | 0.1287 |
| Page: 1 2 3 4 5 |
| Tissue | Expression Dynamics | Abbreviation |
| Esophagus | 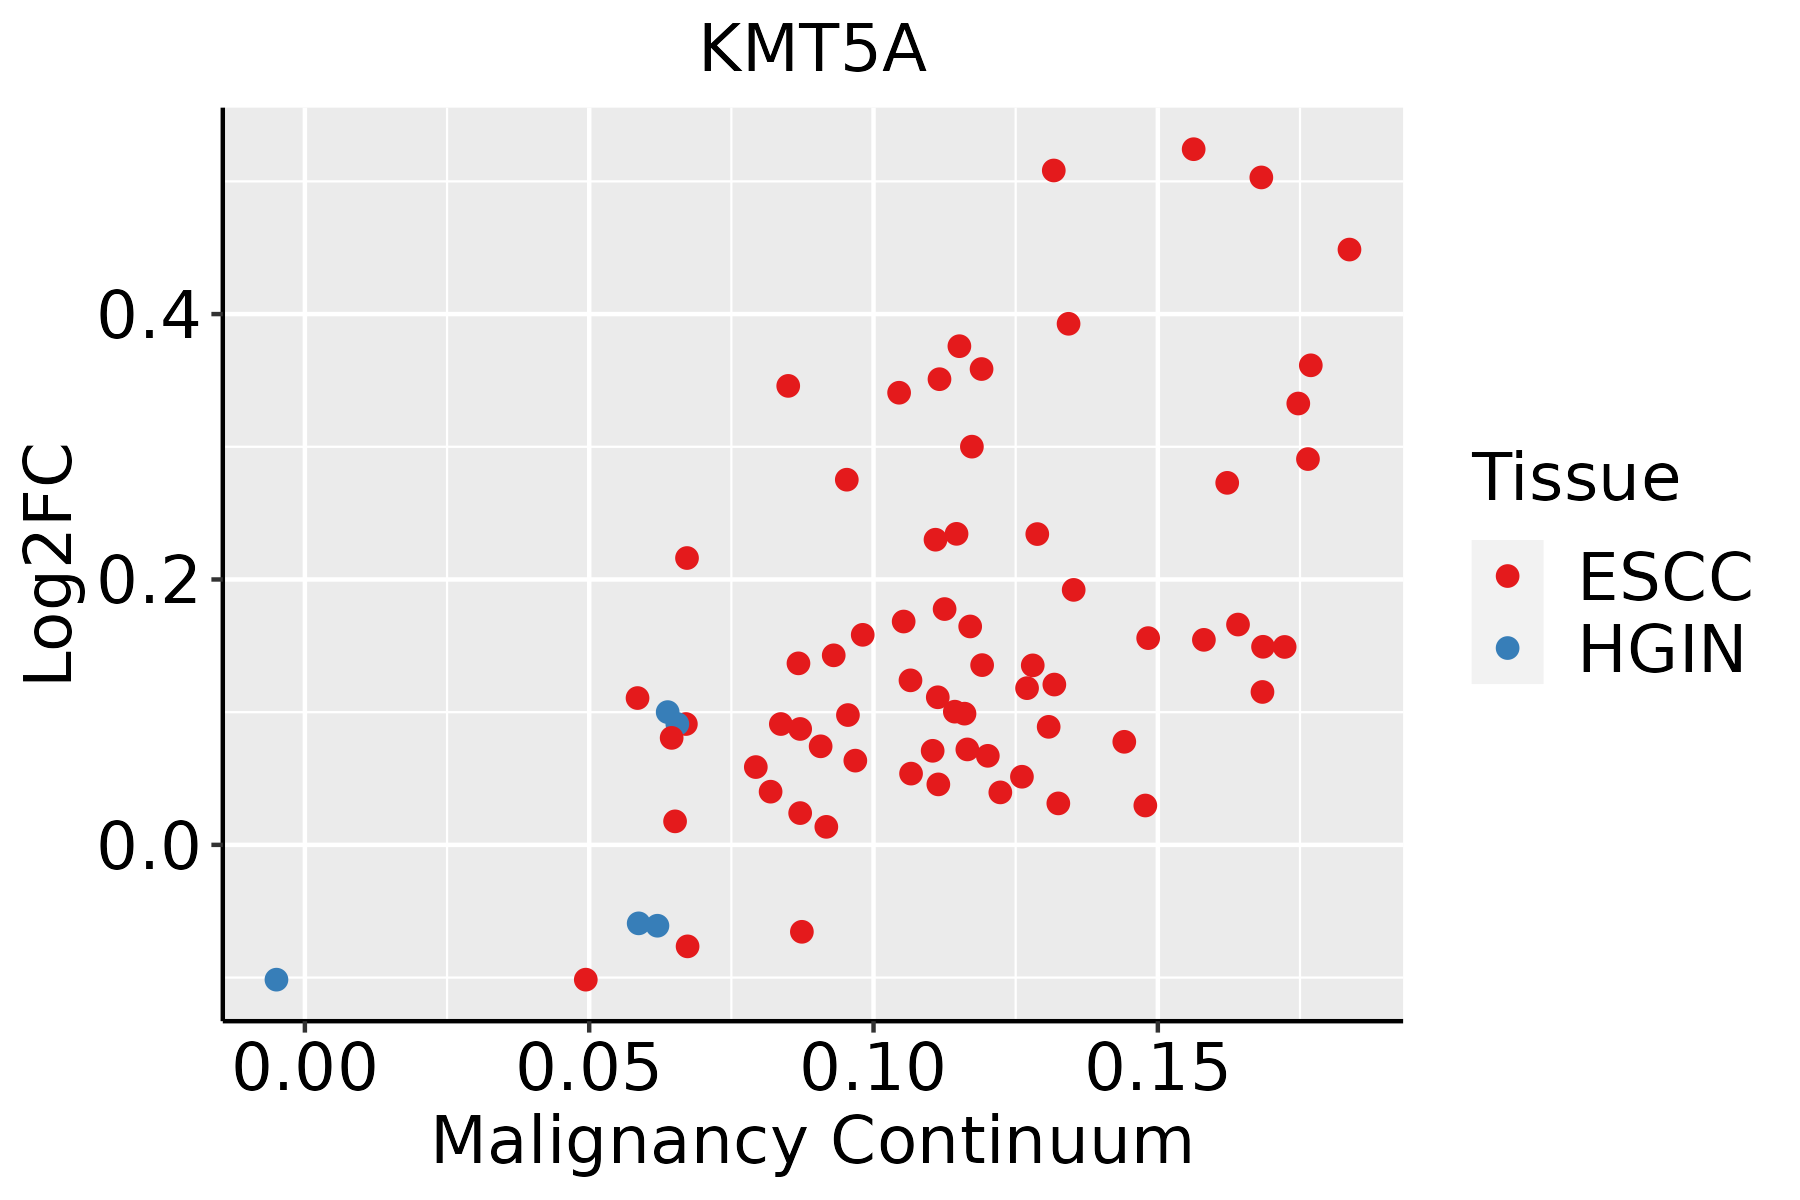 | ESCC: Esophageal squamous cell carcinoma |
| HGIN: High-grade intraepithelial neoplasias | ||
| LGIN: Low-grade intraepithelial neoplasias | ||
| Liver | 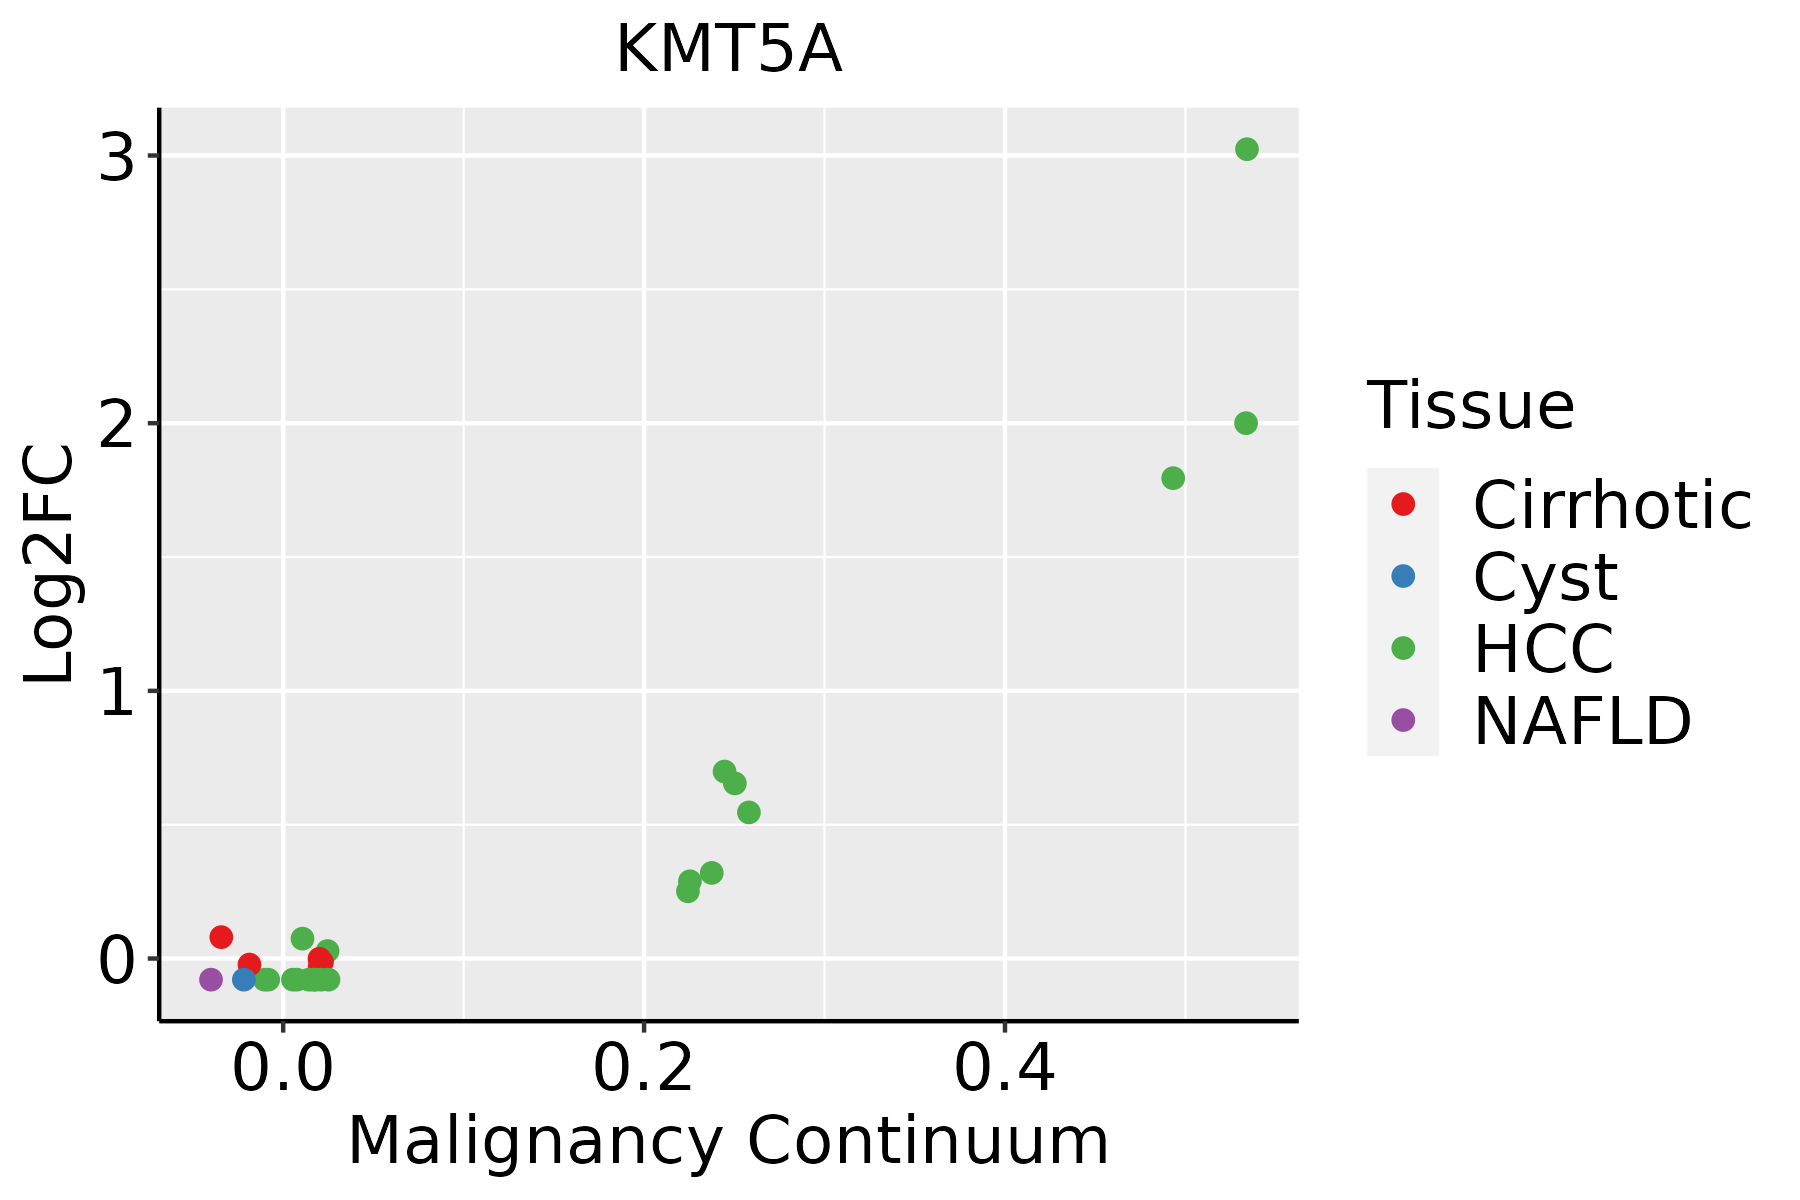 | HCC: Hepatocellular carcinoma |
| NAFLD: Non-alcoholic fatty liver disease | ||
| Oral Cavity | 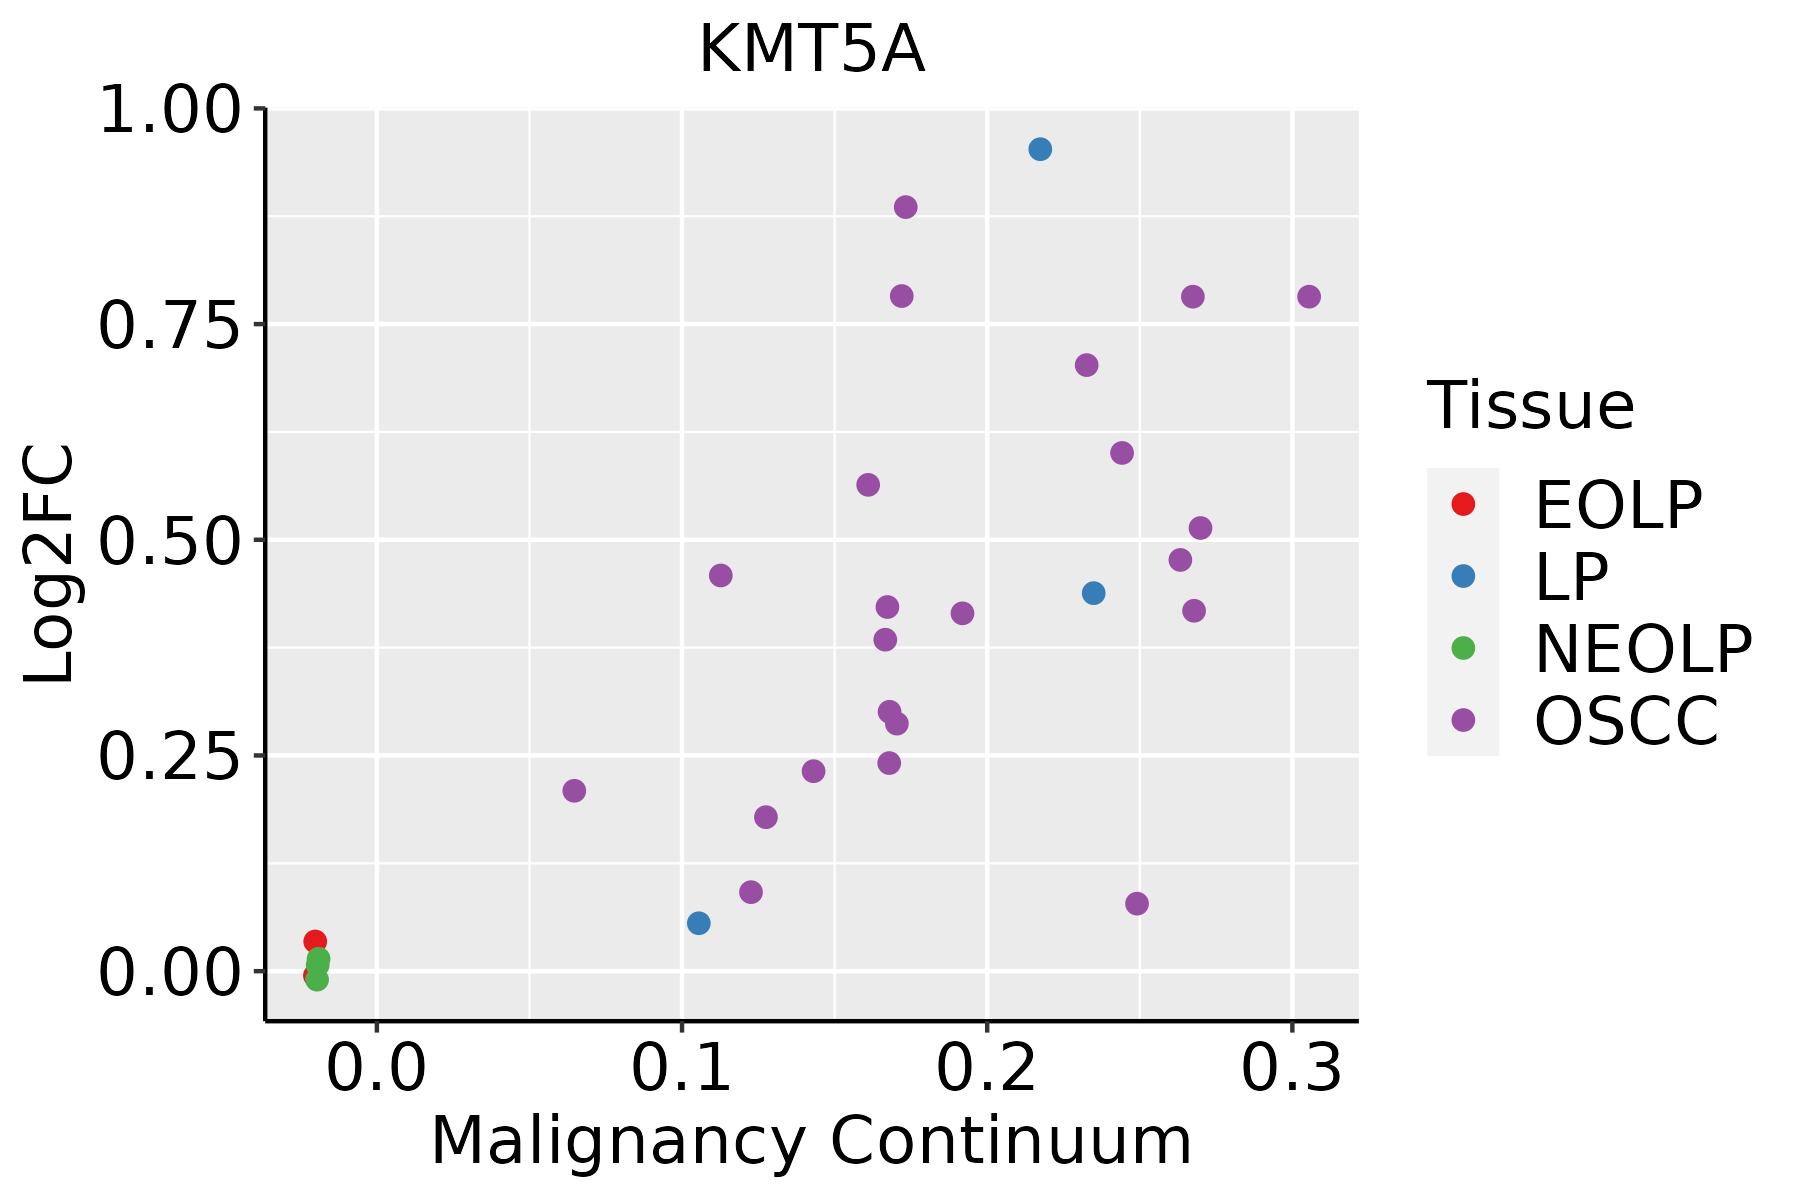 | EOLP: Erosive Oral lichen planus |
| LP: leukoplakia | ||
| NEOLP: Non-erosive oral lichen planus | ||
| OSCC: Oral squamous cell carcinoma | ||
| Thyroid | 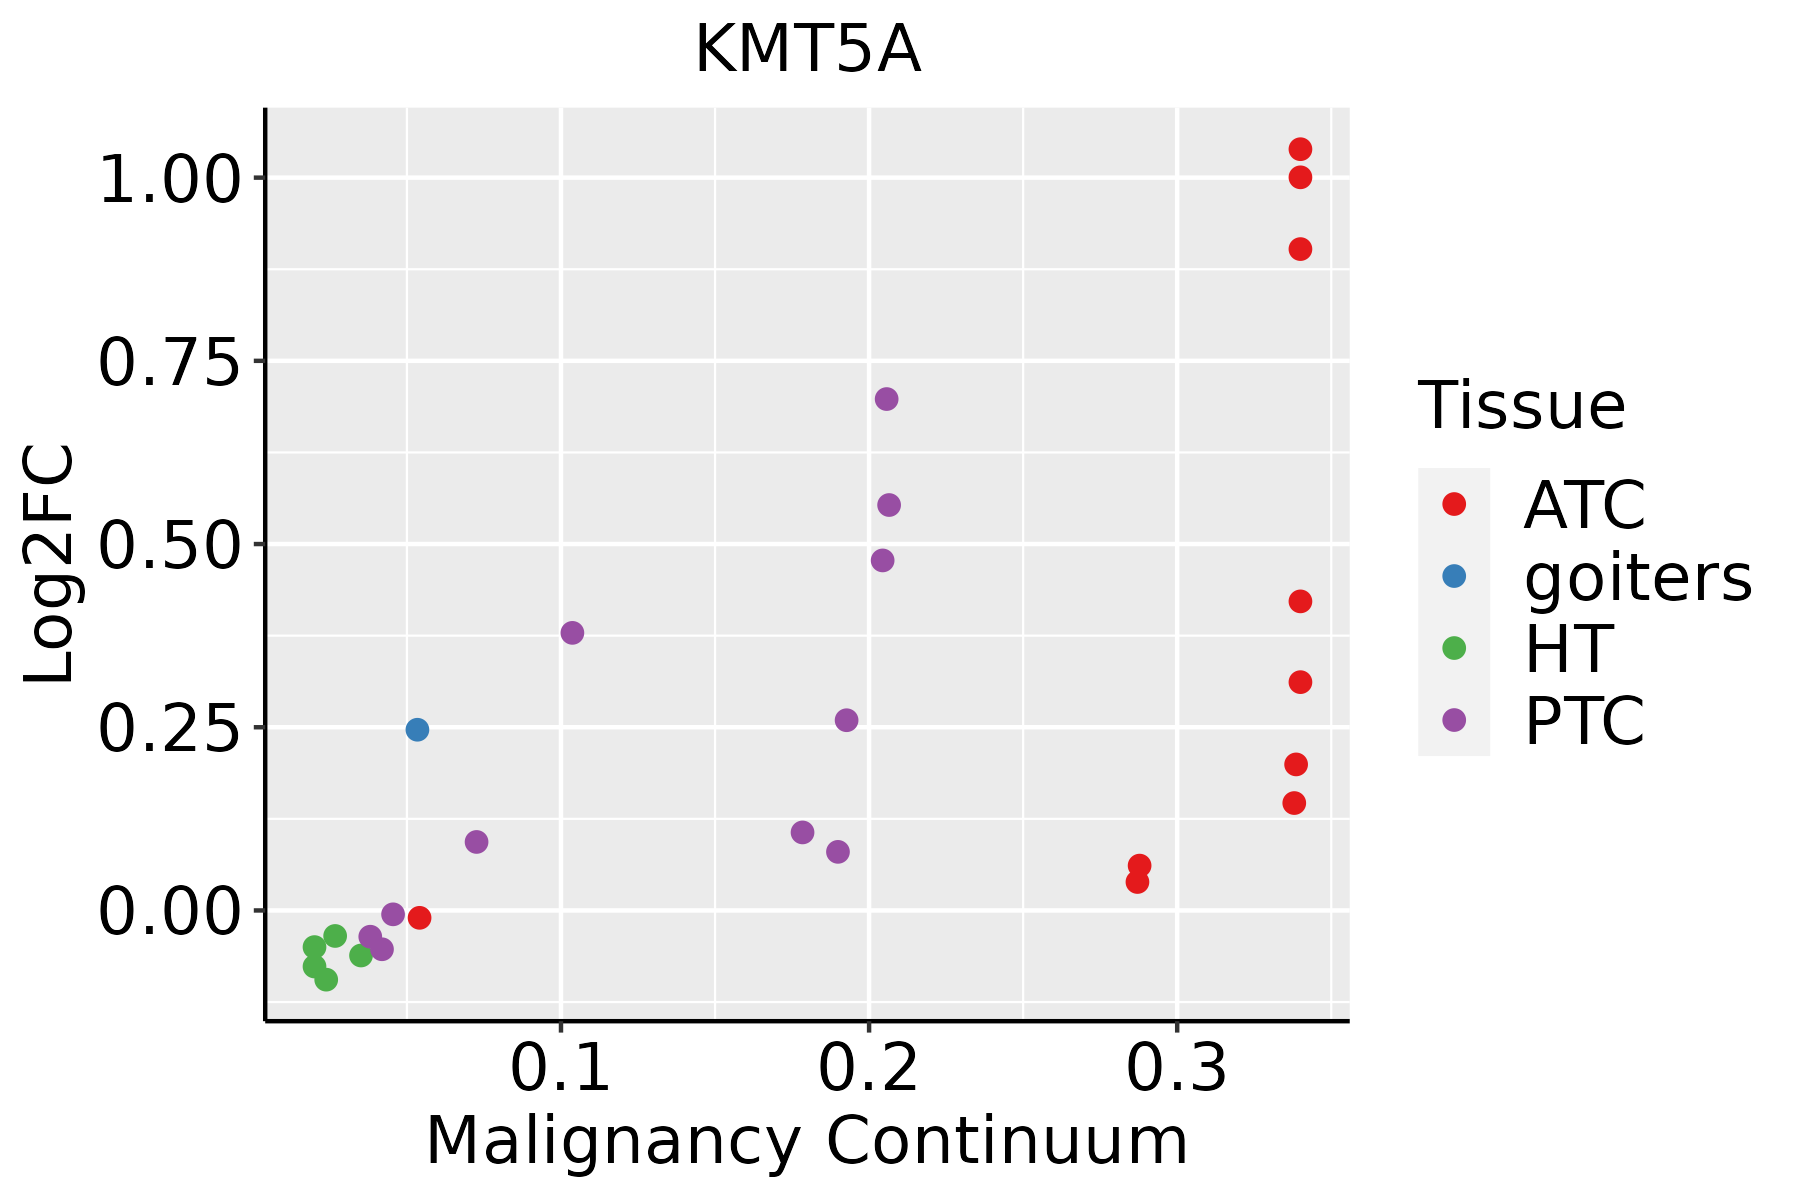 | ATC: Anaplastic thyroid cancer |
| HT: Hashimoto's thyroiditis | ||
| PTC: Papillary thyroid cancer |
| ∗log2FC in expression of this searched gene in stem-like cells from each diseased tissue sample relative to stem-like cells in normal samples in each tissue plotted against the malignancy continuum. Samples are colored based on if they are from different disease stage. |
Top |
Malignant transformation related pathway analysis |
| Find out the enriched GO biological processes and KEGG pathways involved in transition from healthy to precancer to cancer |
| Tissue | Disease Stage | Enriched GO biological Processes |
| Colorectum | AD |  |
| Colorectum | SER |  |
| Colorectum | MSS |  |
| Colorectum | MSI-H |  |
| Colorectum | FAP |  |
| ∗Top 15 enriched GO BP terms are showed in the bar plot of each disease state in each tissue. Each row represents a significant GO biological process which is colored according to the -log10(p.adjust). |
| Page: 1 2 3 4 5 6 7 8 9 |
| GO ID | Tissue | Disease Stage | Description | Gene Ratio | Bg Ratio | pvalue | p.adjust | Count |
| GO:001657015 | Esophagus | ESCC | histone modification | 323/8552 | 463/18723 | 2.61e-26 | 7.88e-24 | 323 |
| GO:014001414 | Esophagus | ESCC | mitotic nuclear division | 218/8552 | 287/18723 | 6.17e-26 | 1.78e-23 | 218 |
| GO:000007011 | Esophagus | ESCC | mitotic sister chromatid segregation | 138/8552 | 168/18723 | 1.37e-22 | 2.63e-20 | 138 |
| GO:00008194 | Esophagus | ESCC | sister chromatid segregation | 157/8552 | 202/18723 | 8.41e-21 | 1.33e-18 | 157 |
| GO:001820514 | Esophagus | ESCC | peptidyl-lysine modification | 259/8552 | 376/18723 | 3.90e-20 | 5.26e-18 | 259 |
| GO:000705911 | Esophagus | ESCC | chromosome segregation | 238/8552 | 346/18723 | 1.72e-18 | 1.82e-16 | 238 |
| GO:0072331111 | Esophagus | ESCC | signal transduction by p53 class mediator | 121/8552 | 163/18723 | 9.61e-14 | 4.69e-12 | 121 |
| GO:00482853 | Esophagus | ESCC | organelle fission | 301/8552 | 488/18723 | 4.64e-13 | 2.12e-11 | 301 |
| GO:00988133 | Esophagus | ESCC | nuclear chromosome segregation | 187/8552 | 281/18723 | 1.00e-12 | 4.36e-11 | 187 |
| GO:00002802 | Esophagus | ESCC | nuclear division | 270/8552 | 439/18723 | 1.17e-11 | 4.24e-10 | 270 |
| GO:00434143 | Esophagus | ESCC | macromolecule methylation | 199/8552 | 316/18723 | 3.44e-10 | 9.57e-09 | 199 |
| GO:2001020110 | Esophagus | ESCC | regulation of response to DNA damage stimulus | 145/8552 | 219/18723 | 5.97e-10 | 1.50e-08 | 145 |
| GO:00322592 | Esophagus | ESCC | methylation | 222/8552 | 364/18723 | 2.26e-09 | 5.09e-08 | 222 |
| GO:004277014 | Esophagus | ESCC | signal transduction in response to DNA damage | 117/8552 | 172/18723 | 2.38e-09 | 5.32e-08 | 117 |
| GO:1901796111 | Esophagus | ESCC | regulation of signal transduction by p53 class mediator | 70/8552 | 93/18723 | 5.69e-09 | 1.18e-07 | 70 |
| GO:000647914 | Esophagus | ESCC | protein methylation | 115/8552 | 181/18723 | 9.07e-07 | 1.16e-05 | 115 |
| GO:000821314 | Esophagus | ESCC | protein alkylation | 115/8552 | 181/18723 | 9.07e-07 | 1.16e-05 | 115 |
| GO:0030330110 | Esophagus | ESCC | DNA damage response, signal transduction by p53 class mediator | 53/8552 | 72/18723 | 1.34e-06 | 1.63e-05 | 53 |
| GO:00165718 | Esophagus | ESCC | histone methylation | 89/8552 | 141/18723 | 2.17e-05 | 1.87e-04 | 89 |
| GO:003496814 | Esophagus | ESCC | histone lysine methylation | 72/8552 | 115/18723 | 1.85e-04 | 1.18e-03 | 72 |
| Page: 1 2 3 4 5 6 7 |
| Pathway ID | Tissue | Disease Stage | Description | Gene Ratio | Bg Ratio | pvalue | p.adjust | qvalue | Count |
| hsa0031010 | Esophagus | ESCC | Lysine degradation | 41/4205 | 63/8465 | 9.63e-03 | 2.27e-02 | 1.16e-02 | 41 |
| hsa0031013 | Esophagus | ESCC | Lysine degradation | 41/4205 | 63/8465 | 9.63e-03 | 2.27e-02 | 1.16e-02 | 41 |
| hsa0031041 | Liver | HCC | Lysine degradation | 47/4020 | 63/8465 | 1.02e-05 | 7.58e-05 | 4.22e-05 | 47 |
| hsa0031051 | Liver | HCC | Lysine degradation | 47/4020 | 63/8465 | 1.02e-05 | 7.58e-05 | 4.22e-05 | 47 |
| Page: 1 |
Top |
Cell-cell communication analysis |
| Identification of potential cell-cell interactions between two cell types and their ligand-receptor pairs for different disease states |
| Ligand | Receptor | LRpair | Pathway | Tissue | Disease Stage |
| Page: 1 |
Top |
Single-cell gene regulatory network inference analysis |
| Find out the significant the regulons (TFs) and the target genes of each regulon across cell types for different disease states |
| TF | Cell Type | Tissue | Disease Stage | Target Gene | RSS | Regulon Activity |
| ∗The dot plots of a searched regulon are shown for all cell subpopulations in each disease state of each tissue based on the regulon specific score inferred using pySCENIC and by calculating the average expression. |
| Page: 1 |
Top |
Somatic mutation of malignant transformation related genes |
| Annotation of somatic variants for genes involved in malignant transformation |
| Hugo Symbol | Variant Class | Variant Classification | dbSNP RS | HGVSc | HGVSp | HGVSp Short | SWISSPROT | BIOTYPE | SIFT | PolyPhen | Tumor Sample Barcode | Tissue | Histology | Sex | Age | Stage | Therapy Types | Drugs | Outcome |
| KMT5A | SNV | Missense_Mutation | rs553535516 | c.980N>T | p.Ala327Val | p.A327V | Q9NQR1 | protein_coding | tolerated(0.11) | benign(0.015) | TCGA-A8-A09Z-01 | Breast | breast invasive carcinoma | Female | >=65 | I/II | Unknown | Unknown | SD |
| KMT5A | insertion | Frame_Shift_Ins | novel | c.562_563insCGCTTATTTTTGTATTTTTATTAGAGACAGGGTTTCACCATGTT | p.Arg188ProfsTer34 | p.R188Pfs*34 | Q9NQR1 | protein_coding | TCGA-A2-A0D1-01 | Breast | breast invasive carcinoma | Female | >=65 | I/II | Chemotherapy | taxotere | SD | ||
| KMT5A | insertion | Nonsense_Mutation | novel | c.580_581insTTTTTTGAGACAGAGTCTCTTGTTGCCCAGGCTGGAGT | p.Ser194IlefsTer3 | p.S194Ifs*3 | Q9NQR1 | protein_coding | TCGA-BH-A0H7-01 | Breast | breast invasive carcinoma | Female | >=65 | III/IV | Chemotherapy | doxorubicin | SD | ||
| KMT5A | SNV | Missense_Mutation | c.199N>T | p.Arg67Cys | p.R67C | Q9NQR1 | protein_coding | deleterious_low_confidence(0.03) | benign(0.025) | TCGA-AA-A01R-01 | Colorectum | colon adenocarcinoma | Male | <65 | III/IV | Chemotherapy | 5-fluorouracil | PD | |
| KMT5A | SNV | Missense_Mutation | c.698N>T | p.Thr233Ile | p.T233I | Q9NQR1 | protein_coding | deleterious(0.03) | benign(0.345) | TCGA-AA-A01R-01 | Colorectum | colon adenocarcinoma | Male | <65 | III/IV | Chemotherapy | 5-fluorouracil | PD | |
| KMT5A | SNV | Missense_Mutation | rs758323252 | c.310N>A | p.Ala104Thr | p.A104T | Q9NQR1 | protein_coding | tolerated(0.44) | benign(0.005) | TCGA-AD-A5EJ-01 | Colorectum | colon adenocarcinoma | Female | >=65 | I/II | Unknown | Unknown | SD |
| KMT5A | SNV | Missense_Mutation | c.199C>T | p.Arg67Cys | p.R67C | Q9NQR1 | protein_coding | deleterious_low_confidence(0.03) | benign(0.025) | TCGA-CM-5861-01 | Colorectum | colon adenocarcinoma | Female | <65 | I/II | Unknown | Unknown | PD | |
| KMT5A | SNV | Missense_Mutation | rs376869233 | c.322N>A | p.Ala108Thr | p.A108T | Q9NQR1 | protein_coding | tolerated(0.57) | benign(0) | TCGA-CM-6162-01 | Colorectum | colon adenocarcinoma | Female | <65 | III/IV | Chemotherapy | oxaliplatin | SD |
| KMT5A | SNV | Missense_Mutation | novel | c.751G>A | p.Glu251Lys | p.E251K | Q9NQR1 | protein_coding | deleterious(0.02) | possibly_damaging(0.548) | TCGA-EI-6917-01 | Colorectum | rectum adenocarcinoma | Male | <65 | III/IV | Chemotherapy | 5fluorouracil+oxaciplatina+l-folinian | SD |
| KMT5A | SNV | Missense_Mutation | rs368237921 | c.457G>A | p.Ala153Thr | p.A153T | Q9NQR1 | protein_coding | tolerated(0.14) | benign(0.079) | TCGA-A5-A1OF-01 | Endometrium | uterine corpus endometrioid carcinoma | Female | <65 | I/II | Unknown | Unknown | SD |
| Page: 1 2 3 4 |
Top |
Related drugs of malignant transformation related genes |
| Identification of chemicals and drugs interact with genes involved in malignant transfromation |
| (DGIdb 4.0) |
| Entrez ID | Symbol | Category | Interaction Types | Drug Claim Name | Drug Name | PMIDs |
| 387893 | KMT5A | ENZYME | inhibitor | 178102575 | ||
| 387893 | KMT5A | ENZYME | inhibitor | 178103601 |
| Page: 1 |

Copyright 2023-Present -The University of Texas Health Science Center at Houston |