
|
|||||
|
 | |
| |
| |
| |
| |
| |
|
Gene: KMT2D |
Gene summary for KMT2D |
| Gene information | Species | Human | Gene symbol | KMT2D | Gene ID | 8085 |
| Gene name | lysine methyltransferase 2D | |
| Gene Alias | AAD10 | |
| Cytomap | 12q13.12 | |
| Gene Type | protein-coding | GO ID | GO:0000003 | UniProtAcc | O14686 |
Top |
Malignant transformation analysis |
| Identification of the aberrant gene expression in precancerous and cancerous lesions by comparing the gene expression of stem-like cells in diseased tissues with normal stem cells |
| Entrez ID | Symbol | Replicates | Species | Organ | Tissue | Adj P-value | Log2FC | Malignancy |
| 8085 | KMT2D | NAFLD1 | Human | Liver | NAFLD | 1.71e-02 | 3.79e-01 | -0.04 |
| 8085 | KMT2D | HCC1_Meng | Human | Liver | HCC | 1.03e-26 | -5.81e-03 | 0.0246 |
| 8085 | KMT2D | HCC2_Meng | Human | Liver | HCC | 1.88e-03 | 7.37e-03 | 0.0107 |
| 8085 | KMT2D | HCC2 | Human | Liver | HCC | 4.38e-12 | 2.79e+00 | 0.5341 |
| 8085 | KMT2D | S014 | Human | Liver | HCC | 5.35e-08 | 4.58e-01 | 0.2254 |
| 8085 | KMT2D | S015 | Human | Liver | HCC | 8.20e-10 | 5.17e-01 | 0.2375 |
| 8085 | KMT2D | S016 | Human | Liver | HCC | 7.27e-13 | 5.04e-01 | 0.2243 |
| 8085 | KMT2D | S027 | Human | Liver | HCC | 2.02e-07 | 6.06e-01 | 0.2446 |
| 8085 | KMT2D | S028 | Human | Liver | HCC | 1.67e-15 | 6.83e-01 | 0.2503 |
| 8085 | KMT2D | S029 | Human | Liver | HCC | 2.66e-11 | 5.24e-01 | 0.2581 |
| Page: 1 |
| Tissue | Expression Dynamics | Abbreviation |
| Liver | 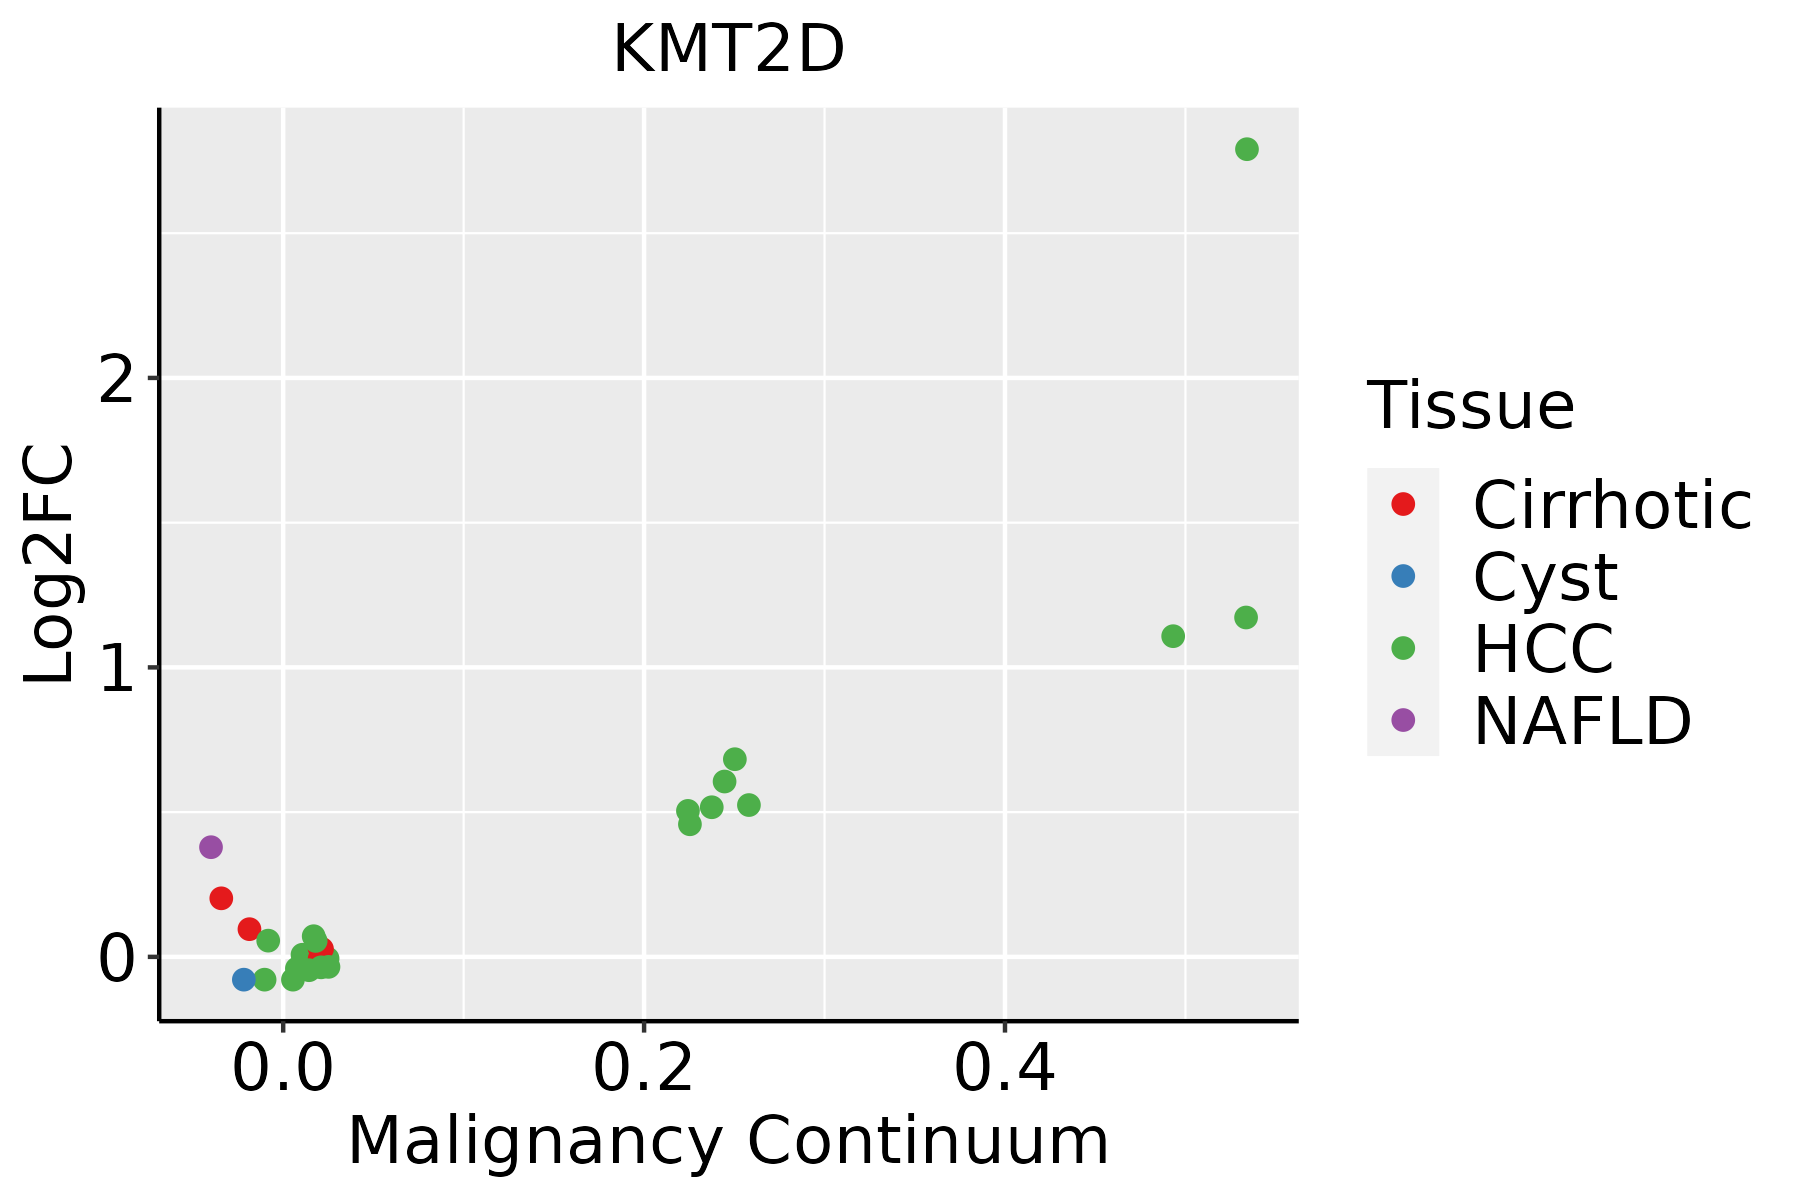 | HCC: Hepatocellular carcinoma |
| NAFLD: Non-alcoholic fatty liver disease |
| ∗log2FC in expression of this searched gene in stem-like cells from each diseased tissue sample relative to stem-like cells in normal samples in each tissue plotted against the malignancy continuum. Samples are colored based on if they are from different disease stage. |
Top |
Malignant transformation related pathway analysis |
| Find out the enriched GO biological processes and KEGG pathways involved in transition from healthy to precancer to cancer |
| Tissue | Disease Stage | Enriched GO biological Processes |
| Colorectum | AD |  |
| Colorectum | SER |  |
| Colorectum | MSS |  |
| Colorectum | MSI-H |  |
| Colorectum | FAP |  |
| ∗Top 15 enriched GO BP terms are showed in the bar plot of each disease state in each tissue. Each row represents a significant GO biological process which is colored according to the -log10(p.adjust). |
| Page: 1 2 3 4 5 6 7 8 9 |
| GO ID | Tissue | Disease Stage | Description | Gene Ratio | Bg Ratio | pvalue | p.adjust | Count |
| GO:00485457 | Liver | NAFLD | response to steroid hormone | 75/1882 | 339/18723 | 3.44e-11 | 1.12e-08 | 75 |
| GO:00165703 | Liver | NAFLD | histone modification | 90/1882 | 463/18723 | 5.74e-10 | 1.28e-07 | 90 |
| GO:00713836 | Liver | NAFLD | cellular response to steroid hormone stimulus | 48/1882 | 204/18723 | 1.50e-08 | 1.83e-06 | 48 |
| GO:00305226 | Liver | NAFLD | intracellular receptor signaling pathway | 55/1882 | 265/18723 | 1.39e-07 | 1.03e-05 | 55 |
| GO:00160495 | Liver | NAFLD | cell growth | 85/1882 | 482/18723 | 1.75e-07 | 1.25e-05 | 85 |
| GO:0018205 | Liver | NAFLD | peptidyl-lysine modification | 65/1882 | 376/18723 | 9.42e-06 | 3.02e-04 | 65 |
| GO:00097556 | Liver | NAFLD | hormone-mediated signaling pathway | 39/1882 | 190/18723 | 1.15e-05 | 3.58e-04 | 39 |
| GO:00485884 | Liver | NAFLD | developmental cell growth | 45/1882 | 234/18723 | 1.50e-05 | 4.38e-04 | 45 |
| GO:00165713 | Liver | NAFLD | histone methylation | 29/1882 | 141/18723 | 1.40e-04 | 2.63e-03 | 29 |
| GO:00434016 | Liver | NAFLD | steroid hormone mediated signaling pathway | 28/1882 | 136/18723 | 1.78e-04 | 3.14e-03 | 28 |
| GO:00349682 | Liver | NAFLD | histone lysine methylation | 24/1882 | 115/18723 | 4.06e-04 | 6.02e-03 | 24 |
| GO:00305185 | Liver | NAFLD | intracellular steroid hormone receptor signaling pathway | 24/1882 | 116/18723 | 4.64e-04 | 6.74e-03 | 24 |
| GO:00064793 | Liver | NAFLD | protein methylation | 33/1882 | 181/18723 | 5.36e-04 | 7.35e-03 | 33 |
| GO:00082133 | Liver | NAFLD | protein alkylation | 33/1882 | 181/18723 | 5.36e-04 | 7.35e-03 | 33 |
| GO:0018023 | Liver | NAFLD | peptidyl-lysine trimethylation | 13/1882 | 50/18723 | 1.04e-03 | 1.22e-02 | 13 |
| GO:0018022 | Liver | NAFLD | peptidyl-lysine methylation | 24/1882 | 131/18723 | 2.70e-03 | 2.47e-02 | 24 |
| GO:0043414 | Liver | NAFLD | macromolecule methylation | 47/1882 | 316/18723 | 4.08e-03 | 3.41e-02 | 47 |
| GO:00331433 | Liver | NAFLD | regulation of intracellular steroid hormone receptor signaling pathway | 15/1882 | 74/18723 | 6.18e-03 | 4.62e-02 | 15 |
| GO:00305203 | Liver | NAFLD | intracellular estrogen receptor signaling pathway | 12/1882 | 54/18723 | 6.44e-03 | 4.69e-02 | 12 |
| GO:001657021 | Liver | HCC | histone modification | 283/7958 | 463/18723 | 2.68e-16 | 2.33e-14 | 283 |
| Page: 1 2 3 |
| Pathway ID | Tissue | Disease Stage | Description | Gene Ratio | Bg Ratio | pvalue | p.adjust | qvalue | Count |
| hsa003108 | Liver | NAFLD | Lysine degradation | 21/1043 | 63/8465 | 1.09e-05 | 3.58e-04 | 2.89e-04 | 21 |
| hsa0031011 | Liver | NAFLD | Lysine degradation | 21/1043 | 63/8465 | 1.09e-05 | 3.58e-04 | 2.89e-04 | 21 |
| hsa0031041 | Liver | HCC | Lysine degradation | 47/4020 | 63/8465 | 1.02e-05 | 7.58e-05 | 4.22e-05 | 47 |
| hsa0031051 | Liver | HCC | Lysine degradation | 47/4020 | 63/8465 | 1.02e-05 | 7.58e-05 | 4.22e-05 | 47 |
| Page: 1 |
Top |
Cell-cell communication analysis |
| Identification of potential cell-cell interactions between two cell types and their ligand-receptor pairs for different disease states |
| Ligand | Receptor | LRpair | Pathway | Tissue | Disease Stage |
| Page: 1 |
Top |
Single-cell gene regulatory network inference analysis |
| Find out the significant the regulons (TFs) and the target genes of each regulon across cell types for different disease states |
| TF | Cell Type | Tissue | Disease Stage | Target Gene | RSS | Regulon Activity |
| ∗The dot plots of a searched regulon are shown for all cell subpopulations in each disease state of each tissue based on the regulon specific score inferred using pySCENIC and by calculating the average expression. |
| Page: 1 |
Top |
Somatic mutation of malignant transformation related genes |
| Annotation of somatic variants for genes involved in malignant transformation |
| Hugo Symbol | Variant Class | Variant Classification | dbSNP RS | HGVSc | HGVSp | HGVSp Short | SWISSPROT | BIOTYPE | SIFT | PolyPhen | Tumor Sample Barcode | Tissue | Histology | Sex | Age | Stage | Therapy Types | Drugs | Outcome |
| KMT2D | SNV | Missense_Mutation | novel | c.5042C>A | p.Thr1681Asn | p.T1681N | O14686 | protein_coding | deleterious(0) | possibly_damaging(0.852) | TCGA-3C-AALJ-01 | Breast | breast invasive carcinoma | Female | <65 | I/II | Chemotherapy | doxorubicin | SD |
| KMT2D | SNV | Missense_Mutation | novel | c.10413G>C | p.Gln3471His | p.Q3471H | O14686 | protein_coding | deleterious(0.01) | possibly_damaging(0.804) | TCGA-5L-AAT1-01 | Breast | breast invasive carcinoma | Female | <65 | III/IV | Hormone Therapy | letrozol | SD |
| KMT2D | SNV | Missense_Mutation | c.10760N>T | p.Glu3587Val | p.E3587V | O14686 | protein_coding | deleterious(0) | probably_damaging(0.997) | TCGA-A2-A0CT-01 | Breast | breast invasive carcinoma | Female | >=65 | I/II | Chemotherapy | cytoxan | SD | |
| KMT2D | SNV | Missense_Mutation | c.3061N>T | p.Pro1021Ser | p.P1021S | O14686 | protein_coding | deleterious_low_confidence(0.04) | benign(0.003) | TCGA-A2-A25B-01 | Breast | breast invasive carcinoma | Female | <65 | I/II | Chemotherapy | taxotere | PD | |
| KMT2D | SNV | Missense_Mutation | c.10744C>T | p.Arg3582Trp | p.R3582W | O14686 | protein_coding | deleterious(0) | probably_damaging(0.999) | TCGA-A8-A076-01 | Breast | breast invasive carcinoma | Female | >=65 | I/II | Hormone Therapy | anastrozole | SD | |
| KMT2D | SNV | Missense_Mutation | novel | c.6007C>G | p.Leu2003Val | p.L2003V | O14686 | protein_coding | deleterious(0.02) | probably_damaging(0.939) | TCGA-AC-A7VC-01 | Breast | breast invasive carcinoma | Female | <65 | I/II | Unknown | Unknown | SD |
| KMT2D | SNV | Missense_Mutation | c.13410N>T | p.Lys4470Asn | p.K4470N | O14686 | protein_coding | deleterious(0) | probably_damaging(0.997) | TCGA-AN-A046-01 | Breast | breast invasive carcinoma | Female | >=65 | I/II | Unknown | Unknown | SD | |
| KMT2D | SNV | Missense_Mutation | rs766696812 | c.10876N>T | p.Arg3626Trp | p.R3626W | O14686 | protein_coding | deleterious(0) | probably_damaging(0.971) | TCGA-AN-A04C-01 | Breast | breast invasive carcinoma | Female | <65 | I/II | Unknown | Unknown | SD |
| KMT2D | SNV | Missense_Mutation | rs775632051 | c.10640G>A | p.Arg3547His | p.R3547H | O14686 | protein_coding | deleterious(0) | probably_damaging(0.997) | TCGA-AN-A0AK-01 | Breast | breast invasive carcinoma | Female | >=65 | I/II | Unknown | Unknown | SD |
| KMT2D | SNV | Missense_Mutation | novel | c.12089N>C | p.Asp4030Ala | p.D4030A | O14686 | protein_coding | deleterious_low_confidence(0.02) | benign(0) | TCGA-AR-A1AP-01 | Breast | breast invasive carcinoma | Female | >=65 | I/II | Hormone Therapy | anastrozole | SD |
| Page: 1 2 3 4 5 6 7 8 9 10 11 12 13 14 15 16 17 18 19 20 21 22 23 24 25 26 27 28 29 30 31 32 33 34 35 36 37 38 39 40 41 42 43 44 45 46 47 48 49 50 51 52 53 54 55 56 57 58 59 60 61 62 63 |
Top |
Related drugs of malignant transformation related genes |
| Identification of chemicals and drugs interact with genes involved in malignant transfromation |
| (DGIdb 4.0) |
| Entrez ID | Symbol | Category | Interaction Types | Drug Claim Name | Drug Name | PMIDs |
| 8085 | KMT2D | METHYL TRANSFERASE, ENZYME, CLINICALLY ACTIONABLE | HDAC INHIBITOR AR-42 | 25273096 |
| Page: 1 |

Copyright 2023-Present -The University of Texas Health Science Center at Houston |