
|
|||||
|
 | |
| |
| |
| |
| |
| |
|
Gene: KMT2C |
Gene summary for KMT2C |
| Gene information | Species | Human | Gene symbol | KMT2C | Gene ID | 58508 |
| Gene name | lysine methyltransferase 2C | |
| Gene Alias | HALR | |
| Cytomap | 7q36.1 | |
| Gene Type | protein-coding | GO ID | GO:0006139 | UniProtAcc | Q8NEZ4 |
Top |
Malignant transformation analysis |
| Identification of the aberrant gene expression in precancerous and cancerous lesions by comparing the gene expression of stem-like cells in diseased tissues with normal stem cells |
| Entrez ID | Symbol | Replicates | Species | Organ | Tissue | Adj P-value | Log2FC | Malignancy |
| 58508 | KMT2C | CA_HPV_1 | Human | Cervix | CC | 3.57e-02 | -6.85e-02 | 0.0264 |
| 58508 | KMT2C | CCI_1 | Human | Cervix | CC | 4.57e-03 | 9.44e-01 | 0.528 |
| 58508 | KMT2C | CCI_2 | Human | Cervix | CC | 1.52e-14 | 1.34e+00 | 0.5249 |
| 58508 | KMT2C | CCI_3 | Human | Cervix | CC | 1.20e-02 | 7.74e-01 | 0.516 |
| 58508 | KMT2C | L1 | Human | Cervix | CC | 6.13e-03 | -2.72e-01 | 0.0802 |
| 58508 | KMT2C | HTA11_3410_2000001011 | Human | Colorectum | AD | 1.08e-32 | -7.42e-01 | 0.0155 |
| 58508 | KMT2C | HTA11_2951_2000001011 | Human | Colorectum | AD | 3.90e-05 | -6.55e-01 | 0.0216 |
| 58508 | KMT2C | HTA11_347_2000001011 | Human | Colorectum | AD | 5.06e-04 | 4.23e-01 | -0.1954 |
| 58508 | KMT2C | HTA11_3361_2000001011 | Human | Colorectum | AD | 1.74e-07 | -4.53e-01 | -0.1207 |
| 58508 | KMT2C | HTA11_9341_2000001011 | Human | Colorectum | SER | 8.21e-07 | -4.89e-01 | -0.00410000000000005 |
| 58508 | KMT2C | HTA11_866_3004761011 | Human | Colorectum | AD | 4.85e-07 | -5.30e-01 | 0.096 |
| 58508 | KMT2C | HTA11_8622_2000001021 | Human | Colorectum | SER | 1.74e-04 | -6.53e-01 | 0.0528 |
| 58508 | KMT2C | HTA11_6801_2000001011 | Human | Colorectum | SER | 6.74e-04 | -5.71e-01 | 0.0171 |
| 58508 | KMT2C | HTA11_10711_2000001011 | Human | Colorectum | AD | 2.91e-10 | -4.66e-01 | 0.0338 |
| 58508 | KMT2C | HTA11_7469_2000001011 | Human | Colorectum | AD | 3.55e-03 | -5.58e-01 | -0.0124 |
| 58508 | KMT2C | HTA11_6818_2000001021 | Human | Colorectum | AD | 1.69e-06 | -3.63e-01 | 0.0588 |
| 58508 | KMT2C | HTA11_99999970781_79442 | Human | Colorectum | MSS | 7.43e-05 | -4.07e-01 | 0.294 |
| 58508 | KMT2C | HTA11_99999965104_69814 | Human | Colorectum | MSS | 1.61e-03 | 5.36e-01 | 0.281 |
| 58508 | KMT2C | HTA11_99999974143_84620 | Human | Colorectum | MSS | 2.92e-05 | -4.02e-01 | 0.3005 |
| 58508 | KMT2C | A001-C-207 | Human | Colorectum | FAP | 9.36e-03 | -1.99e-01 | 0.1278 |
| Page: 1 2 3 4 5 6 7 8 9 10 11 12 13 14 |
| Tissue | Expression Dynamics | Abbreviation |
| Cervix | 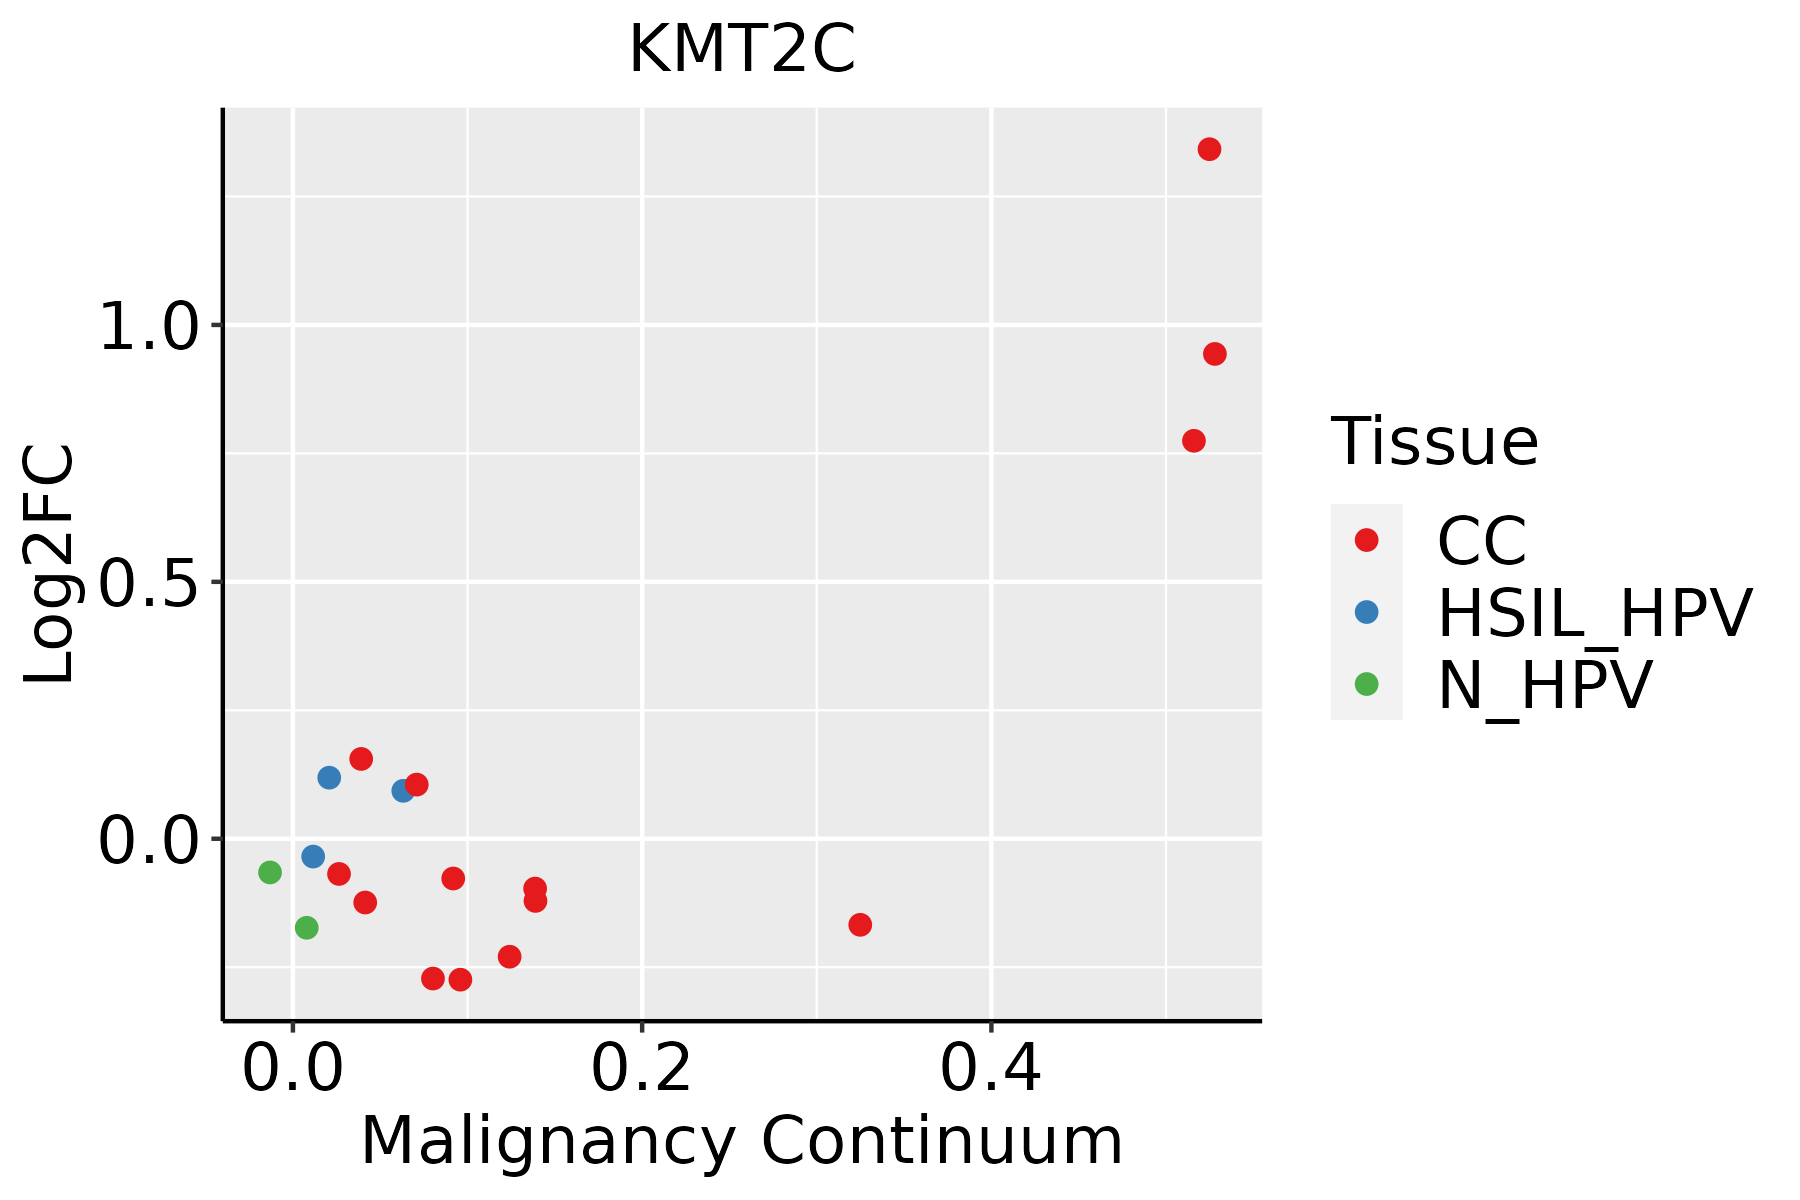 | CC: Cervix cancer |
| HSIL_HPV: HPV-infected high-grade squamous intraepithelial lesions | ||
| N_HPV: HPV-infected normal cervix | ||
| Colorectum (GSE201348) |  | FAP: Familial adenomatous polyposis |
| CRC: Colorectal cancer | ||
| Colorectum (HTA11) |  | AD: Adenomas |
| SER: Sessile serrated lesions | ||
| MSI-H: Microsatellite-high colorectal cancer | ||
| MSS: Microsatellite stable colorectal cancer | ||
| Endometrium |  | AEH: Atypical endometrial hyperplasia |
| EEC: Endometrioid Cancer | ||
| Esophagus | 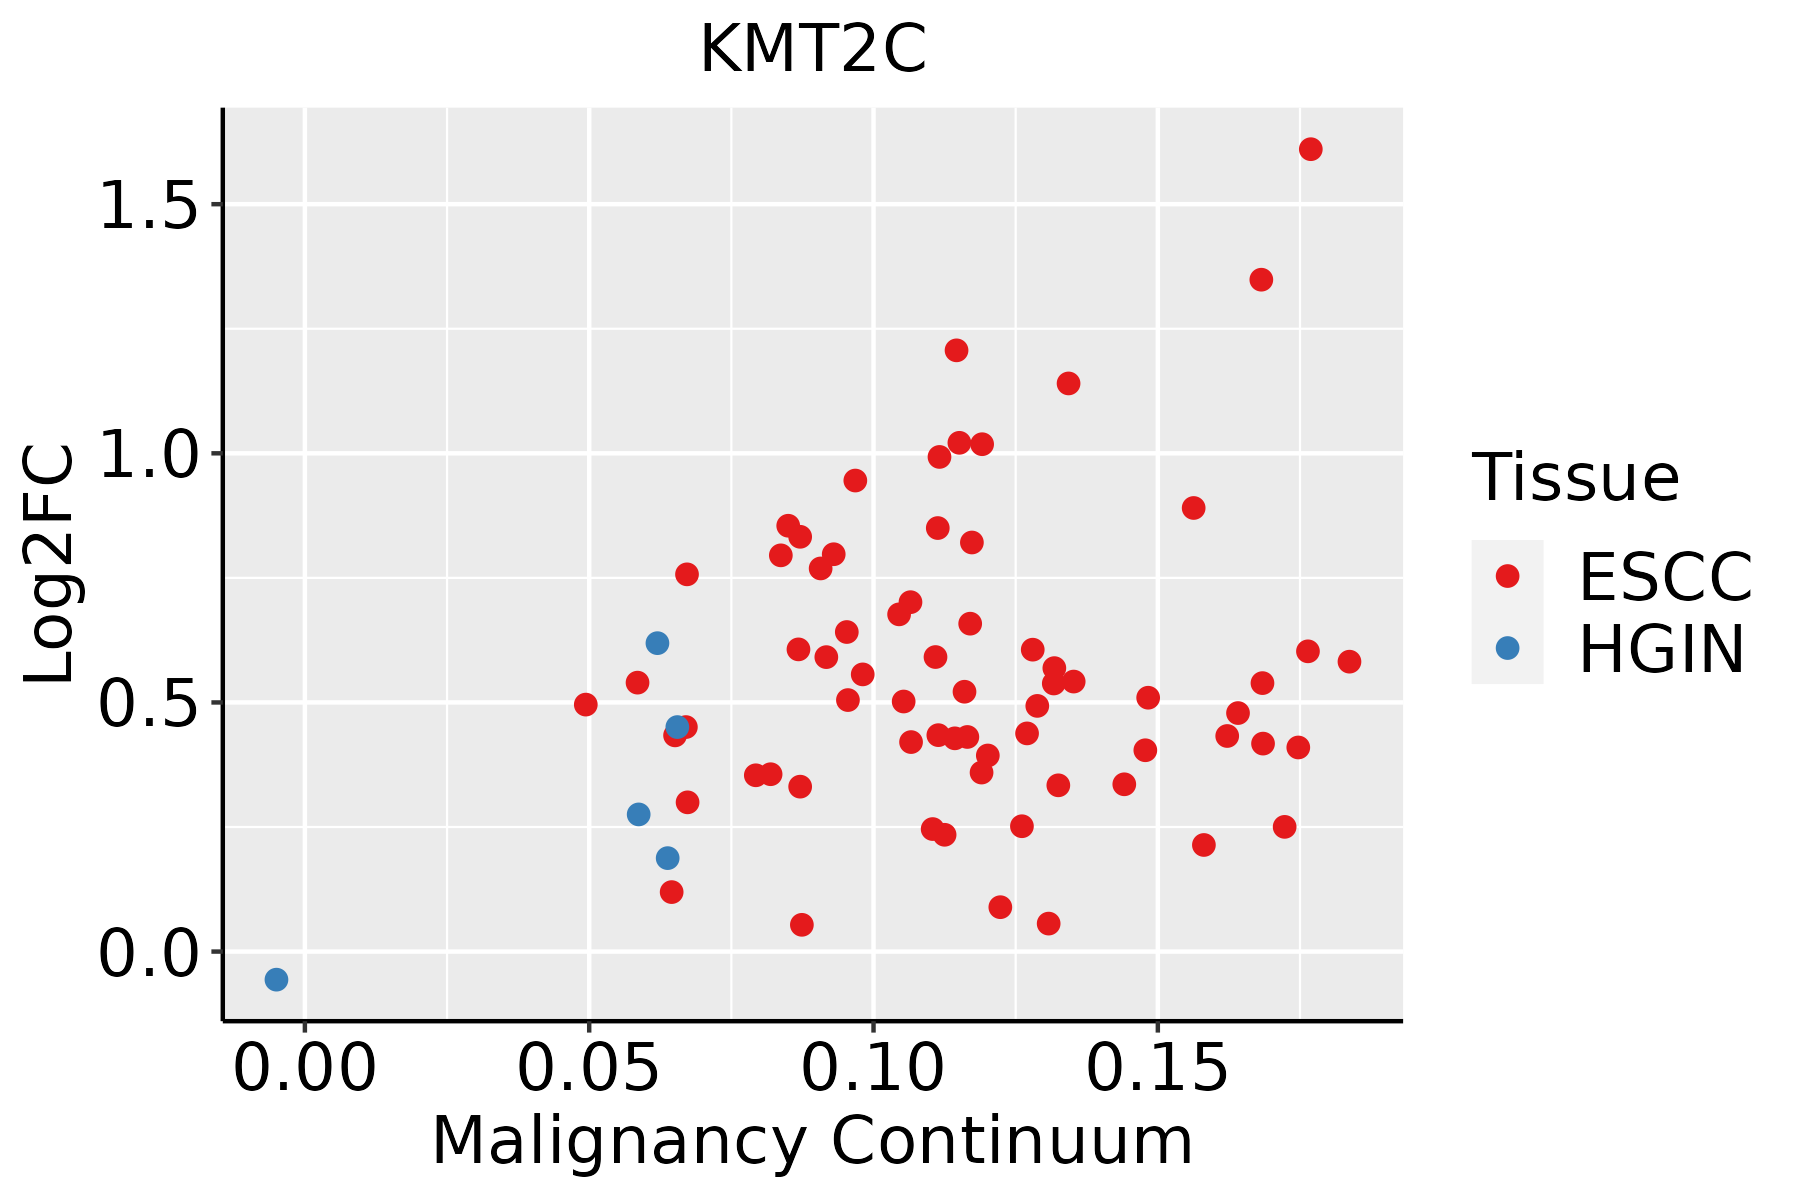 | ESCC: Esophageal squamous cell carcinoma |
| HGIN: High-grade intraepithelial neoplasias | ||
| LGIN: Low-grade intraepithelial neoplasias | ||
| GC |  | CAG: Chronic atrophic gastritis |
| CAG with IM: Chronic atrophic gastritis with intestinal metaplasia | ||
| CSG: Chronic superficial gastritis | ||
| GC: Gastric cancer | ||
| SIM: Severe intestinal metaplasia | ||
| WIM: Wild intestinal metaplasia | ||
| Liver | 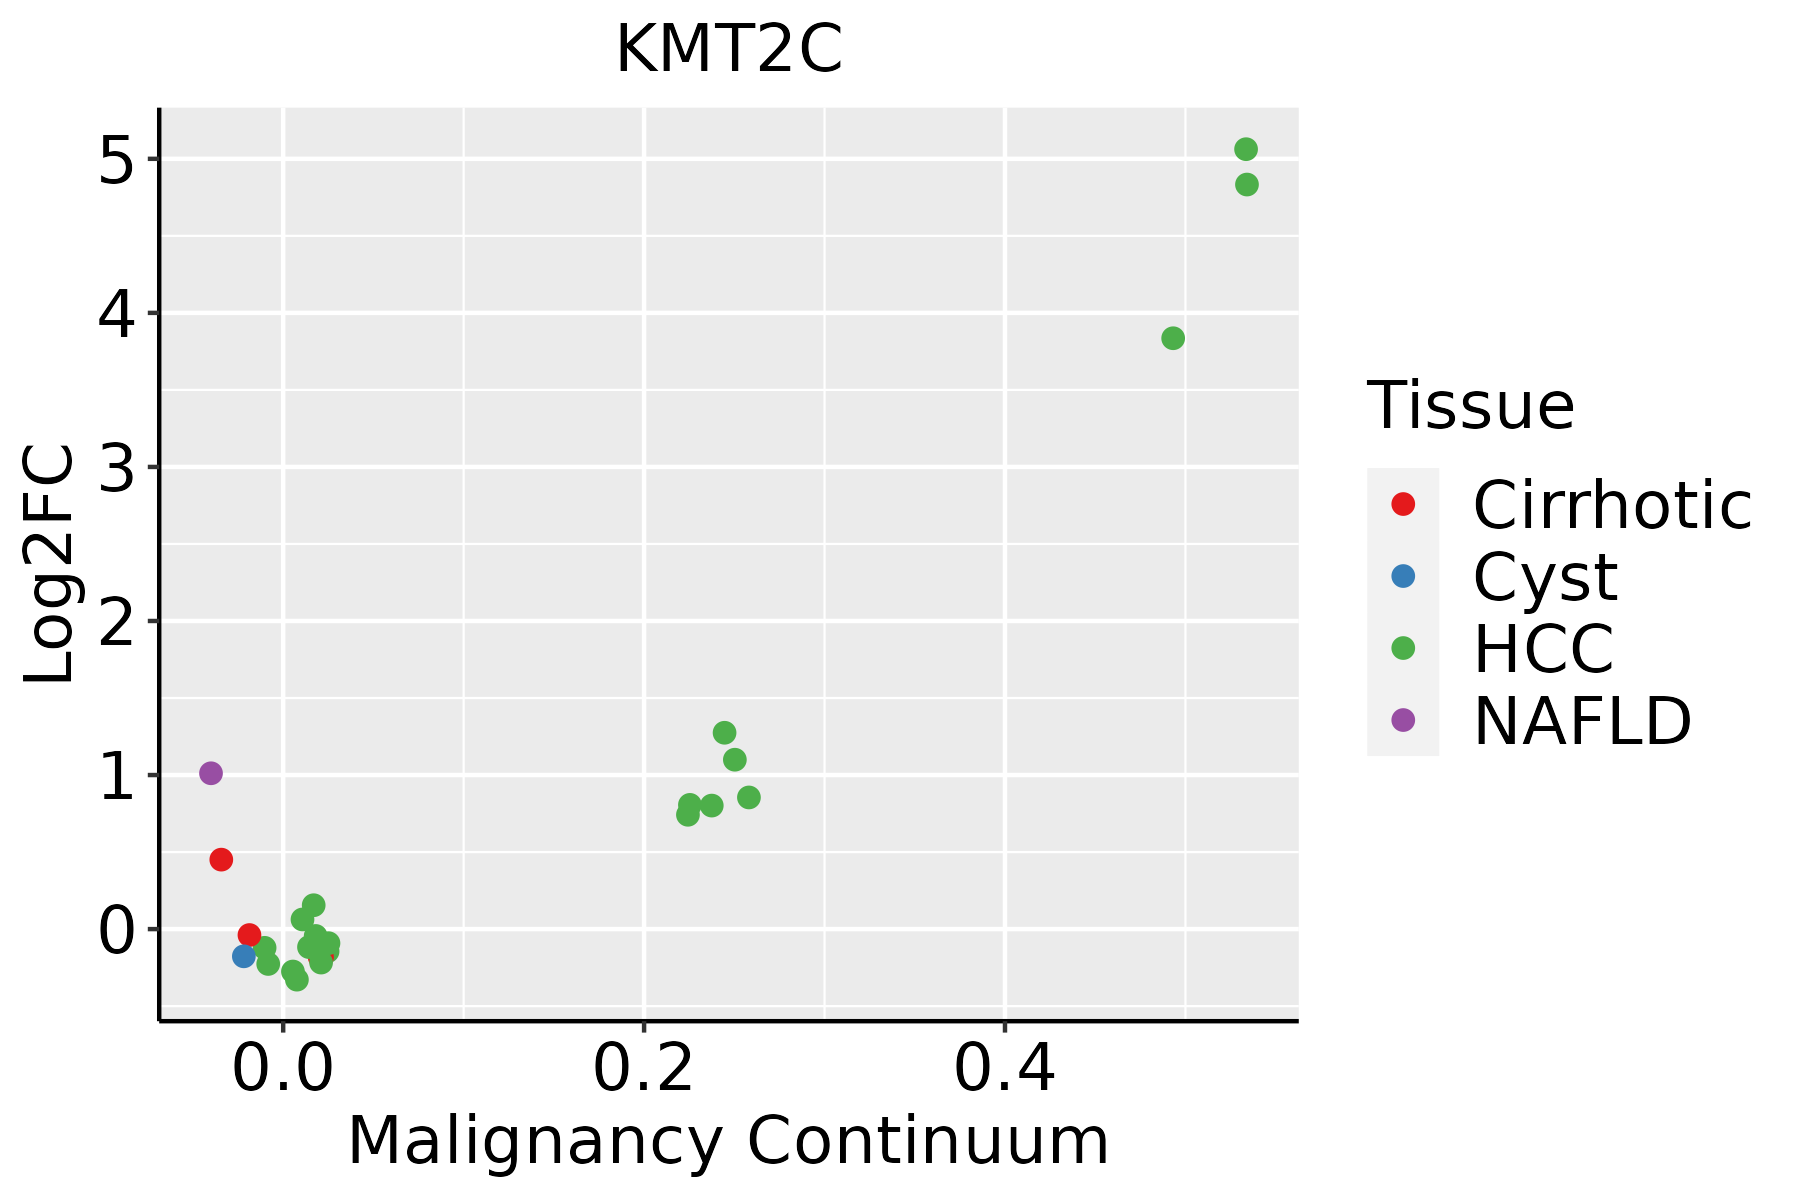 | HCC: Hepatocellular carcinoma |
| NAFLD: Non-alcoholic fatty liver disease | ||
| Lung | 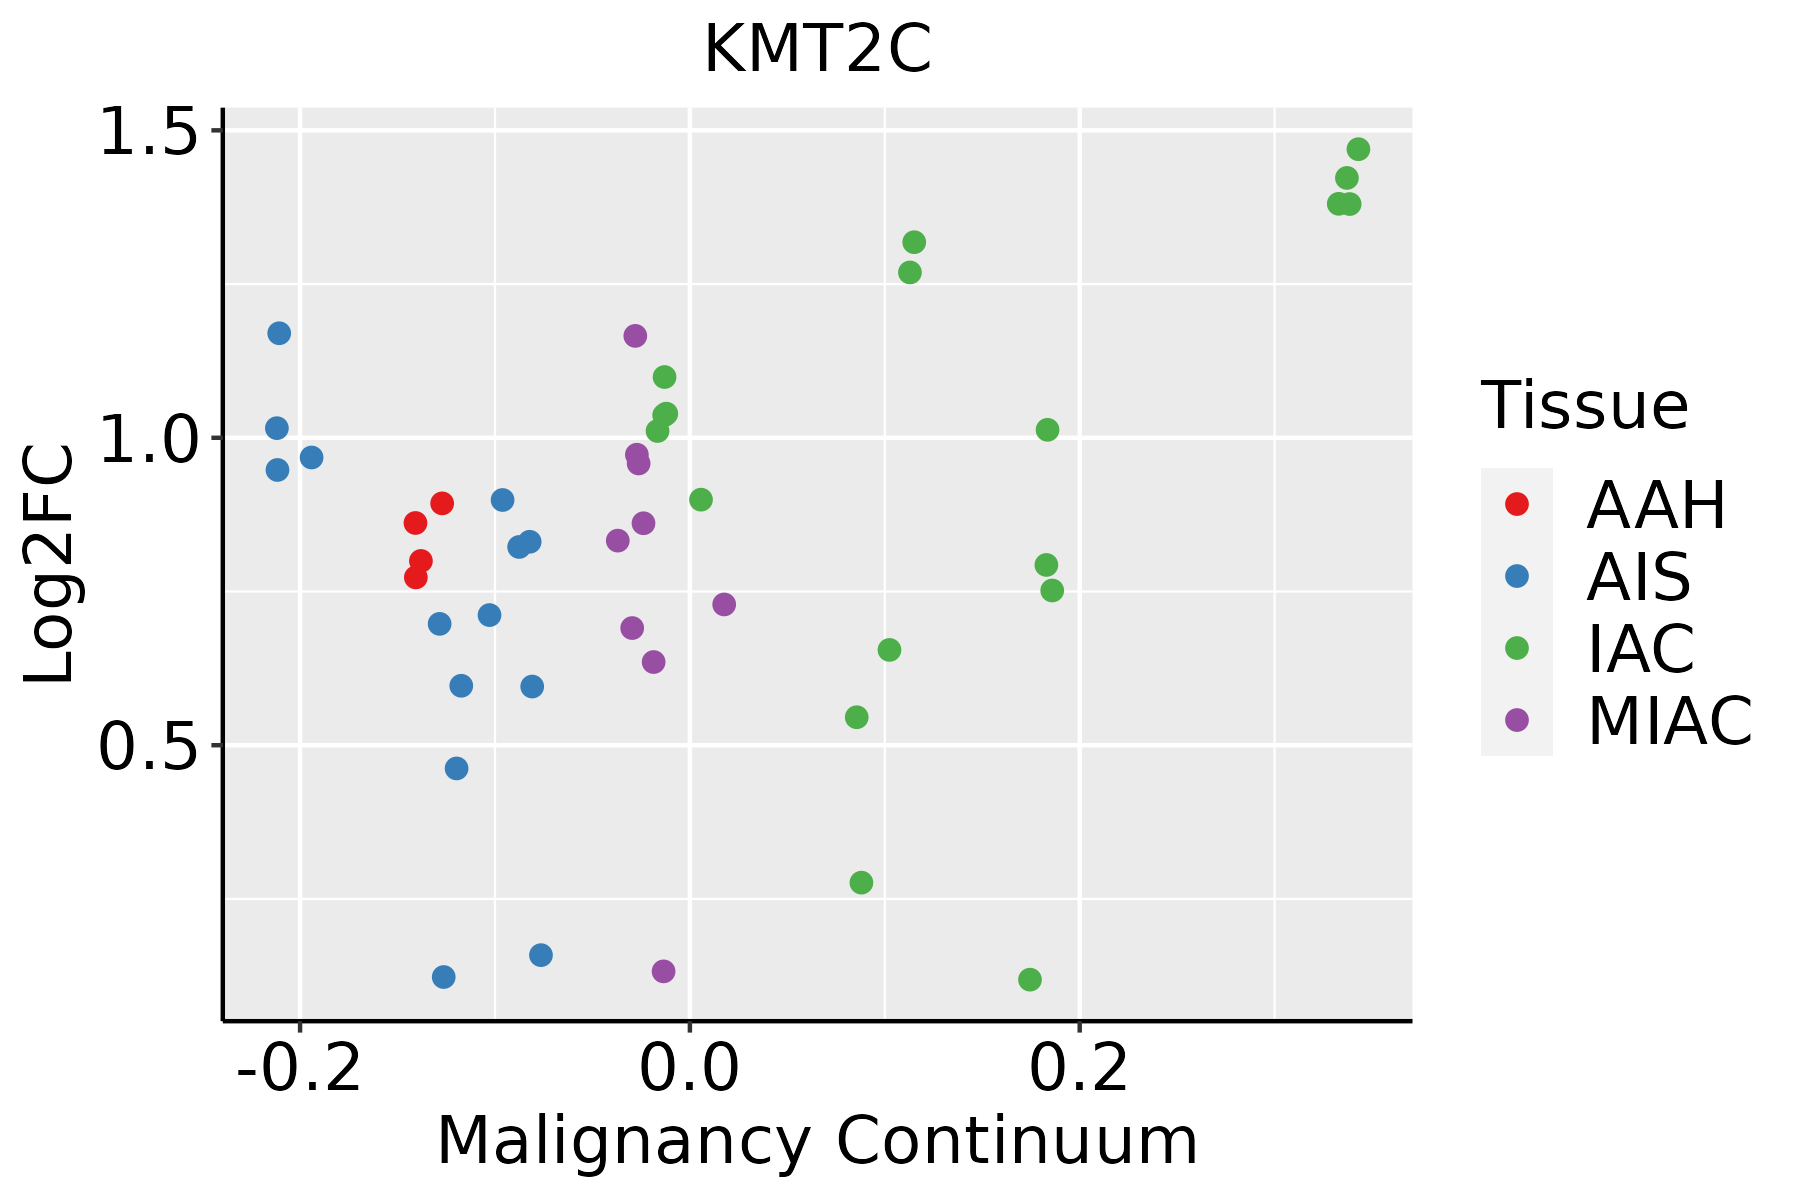 | AAH: Atypical adenomatous hyperplasia |
| AIS: Adenocarcinoma in situ | ||
| IAC: Invasive lung adenocarcinoma | ||
| MIA: Minimally invasive adenocarcinoma | ||
| Oral Cavity | 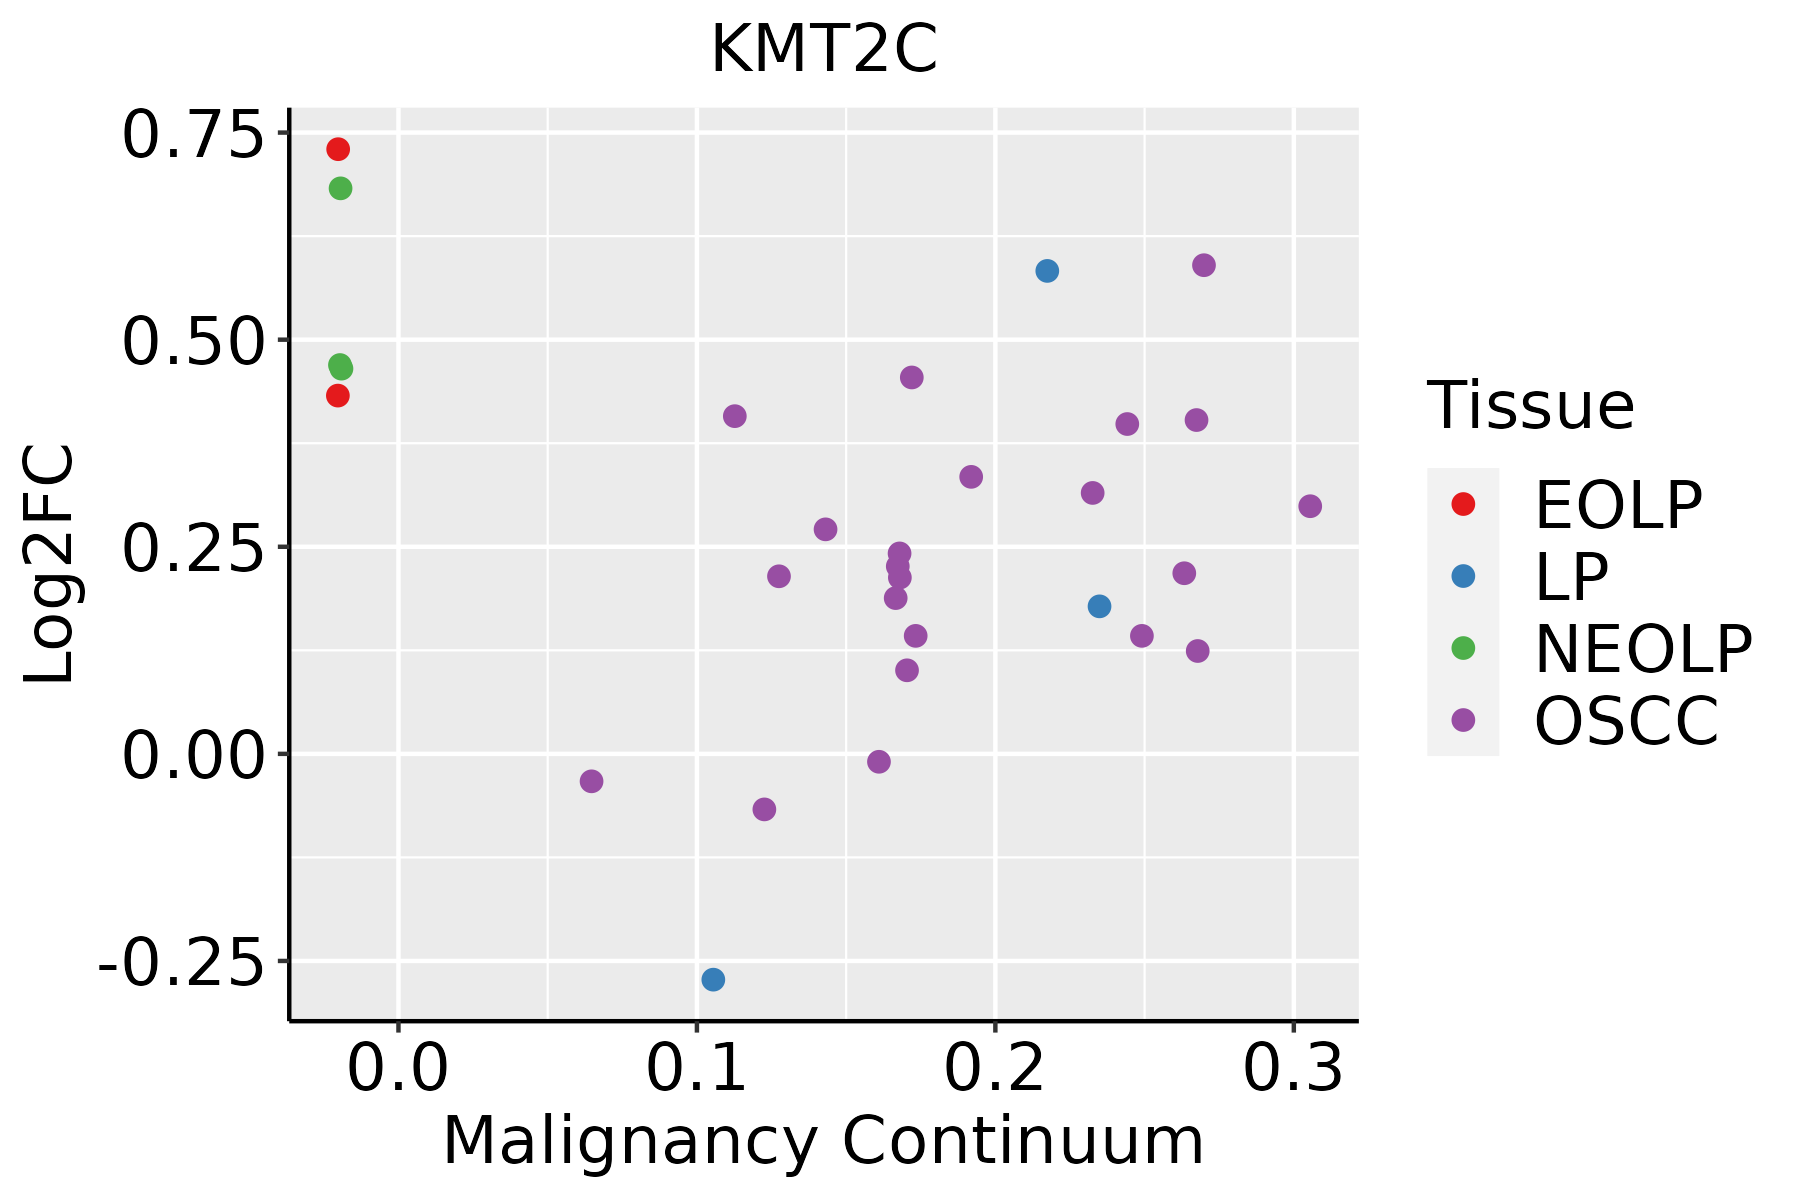 | EOLP: Erosive Oral lichen planus |
| LP: leukoplakia | ||
| NEOLP: Non-erosive oral lichen planus | ||
| OSCC: Oral squamous cell carcinoma | ||
| Prostate | 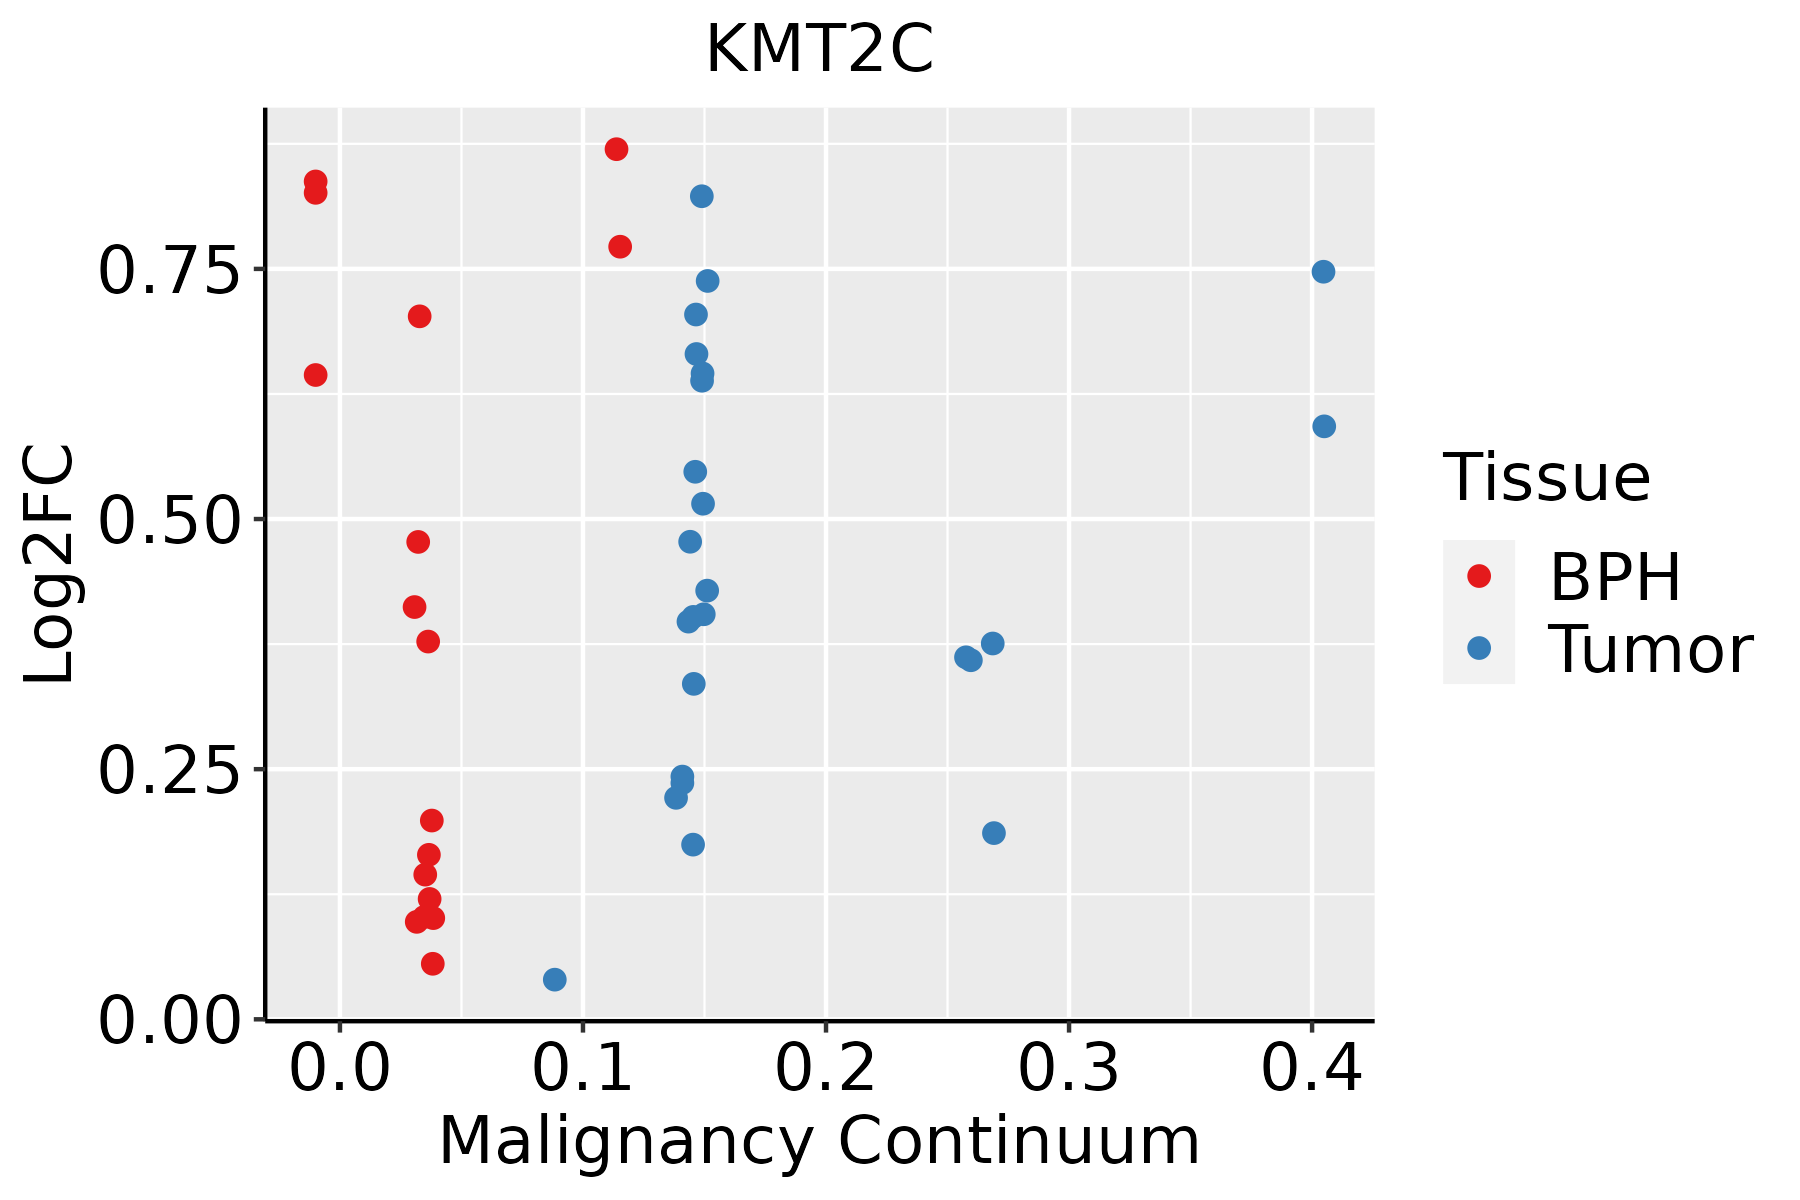 | BPH: Benign Prostatic Hyperplasia |
| Skin |  | AK: Actinic keratosis |
| cSCC: Cutaneous squamous cell carcinoma | ||
| SCCIS:squamous cell carcinoma in situ | ||
| Thyroid |  | ATC: Anaplastic thyroid cancer |
| HT: Hashimoto's thyroiditis | ||
| PTC: Papillary thyroid cancer |
| ∗log2FC in expression of this searched gene in stem-like cells from each diseased tissue sample relative to stem-like cells in normal samples in each tissue plotted against the malignancy continuum. Samples are colored based on if they are from different disease stage. |
Top |
Malignant transformation related pathway analysis |
| Find out the enriched GO biological processes and KEGG pathways involved in transition from healthy to precancer to cancer |
| Tissue | Disease Stage | Enriched GO biological Processes |
| Colorectum | AD |  |
| Colorectum | SER |  |
| Colorectum | MSS |  |
| Colorectum | MSI-H |  |
| Colorectum | FAP |  |
| ∗Top 15 enriched GO BP terms are showed in the bar plot of each disease state in each tissue. Each row represents a significant GO biological process which is colored according to the -log10(p.adjust). |
| Page: 1 2 3 4 5 6 7 8 9 |
| GO ID | Tissue | Disease Stage | Description | Gene Ratio | Bg Ratio | pvalue | p.adjust | Count |
| GO:00165705 | Cervix | CC | histone modification | 84/2311 | 463/18723 | 1.70e-04 | 2.01e-03 | 84 |
| GO:00349685 | Cervix | CC | histone lysine methylation | 27/2311 | 115/18723 | 6.61e-04 | 6.09e-03 | 27 |
| GO:00165715 | Cervix | CC | histone methylation | 30/2311 | 141/18723 | 1.88e-03 | 1.39e-02 | 30 |
| GO:00180224 | Cervix | CC | peptidyl-lysine methylation | 28/2311 | 131/18723 | 2.43e-03 | 1.71e-02 | 28 |
| GO:00064795 | Cervix | CC | protein methylation | 36/2311 | 181/18723 | 2.46e-03 | 1.71e-02 | 36 |
| GO:00082135 | Cervix | CC | protein alkylation | 36/2311 | 181/18723 | 2.46e-03 | 1.71e-02 | 36 |
| GO:00182054 | Cervix | CC | peptidyl-lysine modification | 62/2311 | 376/18723 | 1.04e-02 | 4.97e-02 | 62 |
| GO:0016570 | Colorectum | MSS | histone modification | 113/3467 | 463/18723 | 8.37e-04 | 8.68e-03 | 113 |
| GO:00165701 | Colorectum | FAP | histone modification | 94/2622 | 463/18723 | 1.06e-04 | 1.76e-03 | 94 |
| GO:0006479 | Colorectum | FAP | protein methylation | 39/2622 | 181/18723 | 3.60e-03 | 2.58e-02 | 39 |
| GO:0008213 | Colorectum | FAP | protein alkylation | 39/2622 | 181/18723 | 3.60e-03 | 2.58e-02 | 39 |
| GO:0034968 | Colorectum | FAP | histone lysine methylation | 27/2622 | 115/18723 | 4.23e-03 | 2.90e-02 | 27 |
| GO:0016571 | Colorectum | FAP | histone methylation | 31/2622 | 141/18723 | 6.47e-03 | 4.03e-02 | 31 |
| GO:00165702 | Colorectum | CRC | histone modification | 75/2078 | 463/18723 | 4.95e-04 | 7.06e-03 | 75 |
| GO:00182057 | Esophagus | HGIN | peptidyl-lysine modification | 88/2587 | 376/18723 | 2.99e-07 | 1.39e-05 | 88 |
| GO:00165708 | Esophagus | HGIN | histone modification | 92/2587 | 463/18723 | 1.70e-04 | 3.30e-03 | 92 |
| GO:00349688 | Esophagus | HGIN | histone lysine methylation | 27/2587 | 115/18723 | 3.51e-03 | 3.24e-02 | 27 |
| GO:00064798 | Esophagus | HGIN | protein methylation | 38/2587 | 181/18723 | 5.05e-03 | 4.22e-02 | 38 |
| GO:00082138 | Esophagus | HGIN | protein alkylation | 38/2587 | 181/18723 | 5.05e-03 | 4.22e-02 | 38 |
| GO:00180227 | Esophagus | HGIN | peptidyl-lysine methylation | 29/2587 | 131/18723 | 6.22e-03 | 4.95e-02 | 29 |
| Page: 1 2 3 4 5 6 7 8 |
| Pathway ID | Tissue | Disease Stage | Description | Gene Ratio | Bg Ratio | pvalue | p.adjust | qvalue | Count |
| hsa00310 | Colorectum | AD | Lysine degradation | 27/2092 | 63/8465 | 1.17e-03 | 7.75e-03 | 4.94e-03 | 27 |
| hsa003101 | Colorectum | AD | Lysine degradation | 27/2092 | 63/8465 | 1.17e-03 | 7.75e-03 | 4.94e-03 | 27 |
| hsa003102 | Colorectum | MSS | Lysine degradation | 24/1875 | 63/8465 | 2.94e-03 | 1.39e-02 | 8.50e-03 | 24 |
| hsa003103 | Colorectum | MSS | Lysine degradation | 24/1875 | 63/8465 | 2.94e-03 | 1.39e-02 | 8.50e-03 | 24 |
| hsa003104 | Colorectum | FAP | Lysine degradation | 23/1404 | 63/8465 | 1.04e-04 | 9.46e-04 | 5.76e-04 | 23 |
| hsa003105 | Colorectum | FAP | Lysine degradation | 23/1404 | 63/8465 | 1.04e-04 | 9.46e-04 | 5.76e-04 | 23 |
| hsa003106 | Colorectum | CRC | Lysine degradation | 18/1091 | 63/8465 | 7.21e-04 | 6.34e-03 | 4.30e-03 | 18 |
| hsa003107 | Colorectum | CRC | Lysine degradation | 18/1091 | 63/8465 | 7.21e-04 | 6.34e-03 | 4.30e-03 | 18 |
| hsa0031010 | Esophagus | ESCC | Lysine degradation | 41/4205 | 63/8465 | 9.63e-03 | 2.27e-02 | 1.16e-02 | 41 |
| hsa0031013 | Esophagus | ESCC | Lysine degradation | 41/4205 | 63/8465 | 9.63e-03 | 2.27e-02 | 1.16e-02 | 41 |
| hsa003108 | Liver | NAFLD | Lysine degradation | 21/1043 | 63/8465 | 1.09e-05 | 3.58e-04 | 2.89e-04 | 21 |
| hsa0031011 | Liver | NAFLD | Lysine degradation | 21/1043 | 63/8465 | 1.09e-05 | 3.58e-04 | 2.89e-04 | 21 |
| hsa0031021 | Liver | Cirrhotic | Lysine degradation | 29/2530 | 63/8465 | 4.81e-03 | 1.74e-02 | 1.07e-02 | 29 |
| hsa0031031 | Liver | Cirrhotic | Lysine degradation | 29/2530 | 63/8465 | 4.81e-03 | 1.74e-02 | 1.07e-02 | 29 |
| hsa0031041 | Liver | HCC | Lysine degradation | 47/4020 | 63/8465 | 1.02e-05 | 7.58e-05 | 4.22e-05 | 47 |
| hsa0031051 | Liver | HCC | Lysine degradation | 47/4020 | 63/8465 | 1.02e-05 | 7.58e-05 | 4.22e-05 | 47 |
| hsa003109 | Lung | IAC | Lysine degradation | 17/1053 | 63/8465 | 1.35e-03 | 8.63e-03 | 5.73e-03 | 17 |
| hsa0031012 | Lung | IAC | Lysine degradation | 17/1053 | 63/8465 | 1.35e-03 | 8.63e-03 | 5.73e-03 | 17 |
| hsa0031022 | Lung | AIS | Lysine degradation | 16/961 | 63/8465 | 1.41e-03 | 9.49e-03 | 6.07e-03 | 16 |
| hsa0031032 | Lung | AIS | Lysine degradation | 16/961 | 63/8465 | 1.41e-03 | 9.49e-03 | 6.07e-03 | 16 |
| Page: 1 2 |
Top |
Cell-cell communication analysis |
| Identification of potential cell-cell interactions between two cell types and their ligand-receptor pairs for different disease states |
| Ligand | Receptor | LRpair | Pathway | Tissue | Disease Stage |
| Page: 1 |
Top |
Single-cell gene regulatory network inference analysis |
| Find out the significant the regulons (TFs) and the target genes of each regulon across cell types for different disease states |
| TF | Cell Type | Tissue | Disease Stage | Target Gene | RSS | Regulon Activity |
| ∗The dot plots of a searched regulon are shown for all cell subpopulations in each disease state of each tissue based on the regulon specific score inferred using pySCENIC and by calculating the average expression. |
| Page: 1 |
Top |
Somatic mutation of malignant transformation related genes |
| Annotation of somatic variants for genes involved in malignant transformation |
| Hugo Symbol | Variant Class | Variant Classification | dbSNP RS | HGVSc | HGVSp | HGVSp Short | SWISSPROT | BIOTYPE | SIFT | PolyPhen | Tumor Sample Barcode | Tissue | Histology | Sex | Age | Stage | Therapy Types | Drugs | Outcome |
| KMT2C | SNV | Missense_Mutation | novel | c.4001C>G | p.Ser1334Cys | p.S1334C | Q8NEZ4 | protein_coding | deleterious(0.01) | possibly_damaging(0.707) | TCGA-3C-AALI-01 | Breast | breast invasive carcinoma | Female | <65 | I/II | Unspecific | Poly E | Complete Response |
| KMT2C | SNV | Missense_Mutation | c.8512G>A | p.Glu2838Lys | p.E2838K | Q8NEZ4 | protein_coding | tolerated(0.06) | benign(0.141) | TCGA-A1-A0SF-01 | Breast | breast invasive carcinoma | Female | <65 | I/II | Chemotherapy | tc | SD | |
| KMT2C | SNV | Missense_Mutation | c.5377C>T | p.Leu1793Phe | p.L1793F | Q8NEZ4 | protein_coding | tolerated(0.24) | possibly_damaging(0.548) | TCGA-A1-A0SF-01 | Breast | breast invasive carcinoma | Female | <65 | I/II | Chemotherapy | tc | SD | |
| KMT2C | SNV | Missense_Mutation | rs77325966 | c.2036N>A | p.Arg679Lys | p.R679K | Q8NEZ4 | protein_coding | tolerated(1) | benign(0) | TCGA-A1-A0SI-01 | Breast | breast invasive carcinoma | Female | <65 | I/II | Unknown | Unknown | SD |
| KMT2C | SNV | Missense_Mutation | c.1290N>C | p.Trp430Cys | p.W430C | Q8NEZ4 | protein_coding | deleterious(0) | probably_damaging(1) | TCGA-A1-A0SI-01 | Breast | breast invasive carcinoma | Female | <65 | I/II | Unknown | Unknown | SD | |
| KMT2C | SNV | Missense_Mutation | novel | c.4906A>C | p.Thr1636Pro | p.T1636P | Q8NEZ4 | protein_coding | deleterious(0) | possibly_damaging(0.499) | TCGA-A2-A0CQ-01 | Breast | breast invasive carcinoma | Female | <65 | I/II | Chemotherapy | adriamycin | SD |
| KMT2C | SNV | Missense_Mutation | c.4141N>G | p.Ile1381Val | p.I1381V | Q8NEZ4 | protein_coding | tolerated(0.28) | benign(0) | TCGA-A2-A0SV-01 | Breast | breast invasive carcinoma | Female | <65 | III/IV | Other, specify in notesBisphosphonate therapy | zometa | PD | |
| KMT2C | SNV | Missense_Mutation | c.754C>T | p.His252Tyr | p.H252Y | Q8NEZ4 | protein_coding | deleterious(0) | probably_damaging(0.994) | TCGA-A7-A5ZW-01 | Breast | breast invasive carcinoma | Female | <65 | I/II | Chemotherapy | cyclophosphamide | CR | |
| KMT2C | SNV | Missense_Mutation | novel | c.14433N>A | p.Asn4811Lys | p.N4811K | Q8NEZ4 | protein_coding | deleterious(0.03) | possibly_damaging(0.841) | TCGA-A7-A6VV-01 | Breast | breast invasive carcinoma | Female | <65 | I/II | Chemotherapy | cyclophosphamide | CR |
| KMT2C | SNV | Missense_Mutation | c.10571N>C | p.Val3524Ala | p.V3524A | Q8NEZ4 | protein_coding | tolerated(0.91) | benign(0) | TCGA-A8-A07R-01 | Breast | breast invasive carcinoma | Female | >=65 | III/IV | Ancillary | zoledronic | SD |
| Page: 1 2 3 4 5 6 7 8 9 10 11 12 13 14 15 16 17 18 19 20 21 22 23 24 25 26 27 28 29 30 31 32 33 34 35 36 37 38 39 40 41 42 43 44 45 46 47 48 49 50 51 52 53 54 55 56 57 58 59 |
Top |
Related drugs of malignant transformation related genes |
| Identification of chemicals and drugs interact with genes involved in malignant transfromation |
| (DGIdb 4.0) |
| Entrez ID | Symbol | Category | Interaction Types | Drug Claim Name | Drug Name | PMIDs |
| 58508 | KMT2C | ENZYME, CLINICALLY ACTIONABLE, METHYL TRANSFERASE, NUCLEAR HORMONE RECEPTOR, DRUG RESISTANCE | EXEMESTANE | EXEMESTANE | 29755131 | |
| 58508 | KMT2C | ENZYME, CLINICALLY ACTIONABLE, METHYL TRANSFERASE, NUCLEAR HORMONE RECEPTOR, DRUG RESISTANCE | LETROZOLE | LETROZOLE | 29755131 | |
| 58508 | KMT2C | ENZYME, CLINICALLY ACTIONABLE, METHYL TRANSFERASE, NUCLEAR HORMONE RECEPTOR, DRUG RESISTANCE | ANASTROZOLE | ANASTROZOLE | 29755131 |
| Page: 1 |

Copyright 2023-Present -The University of Texas Health Science Center at Houston |