
|
|||||
|
 | |
| |
| |
| |
| |
| |
|
Gene: KLRD1 |
Gene summary for KLRD1 |
| Gene information | Species | Human | Gene symbol | KLRD1 | Gene ID | 3824 |
| Gene name | killer cell lectin like receptor D1 | |
| Gene Alias | CD94 | |
| Cytomap | 12p13.2 | |
| Gene Type | protein-coding | GO ID | GO:0001906 | UniProtAcc | Q13241 |
Top |
Malignant transformation analysis |
| Identification of the aberrant gene expression in precancerous and cancerous lesions by comparing the gene expression of stem-like cells in diseased tissues with normal stem cells |
| Entrez ID | Symbol | Replicates | Species | Organ | Tissue | Adj P-value | Log2FC | Malignancy |
| 3824 | KLRD1 | HCC1_Meng | Human | Liver | HCC | 9.68e-04 | -1.32e-01 | 0.0246 |
| 3824 | KLRD1 | HCC1 | Human | Liver | HCC | 5.03e-05 | 1.26e+00 | 0.5336 |
| 3824 | KLRD1 | HCC2 | Human | Liver | HCC | 2.45e-16 | 1.60e+00 | 0.5341 |
| 3824 | KLRD1 | HCC5 | Human | Liver | HCC | 5.54e-07 | 1.15e+00 | 0.4932 |
| Page: 1 |
| Tissue | Expression Dynamics | Abbreviation |
| Liver | 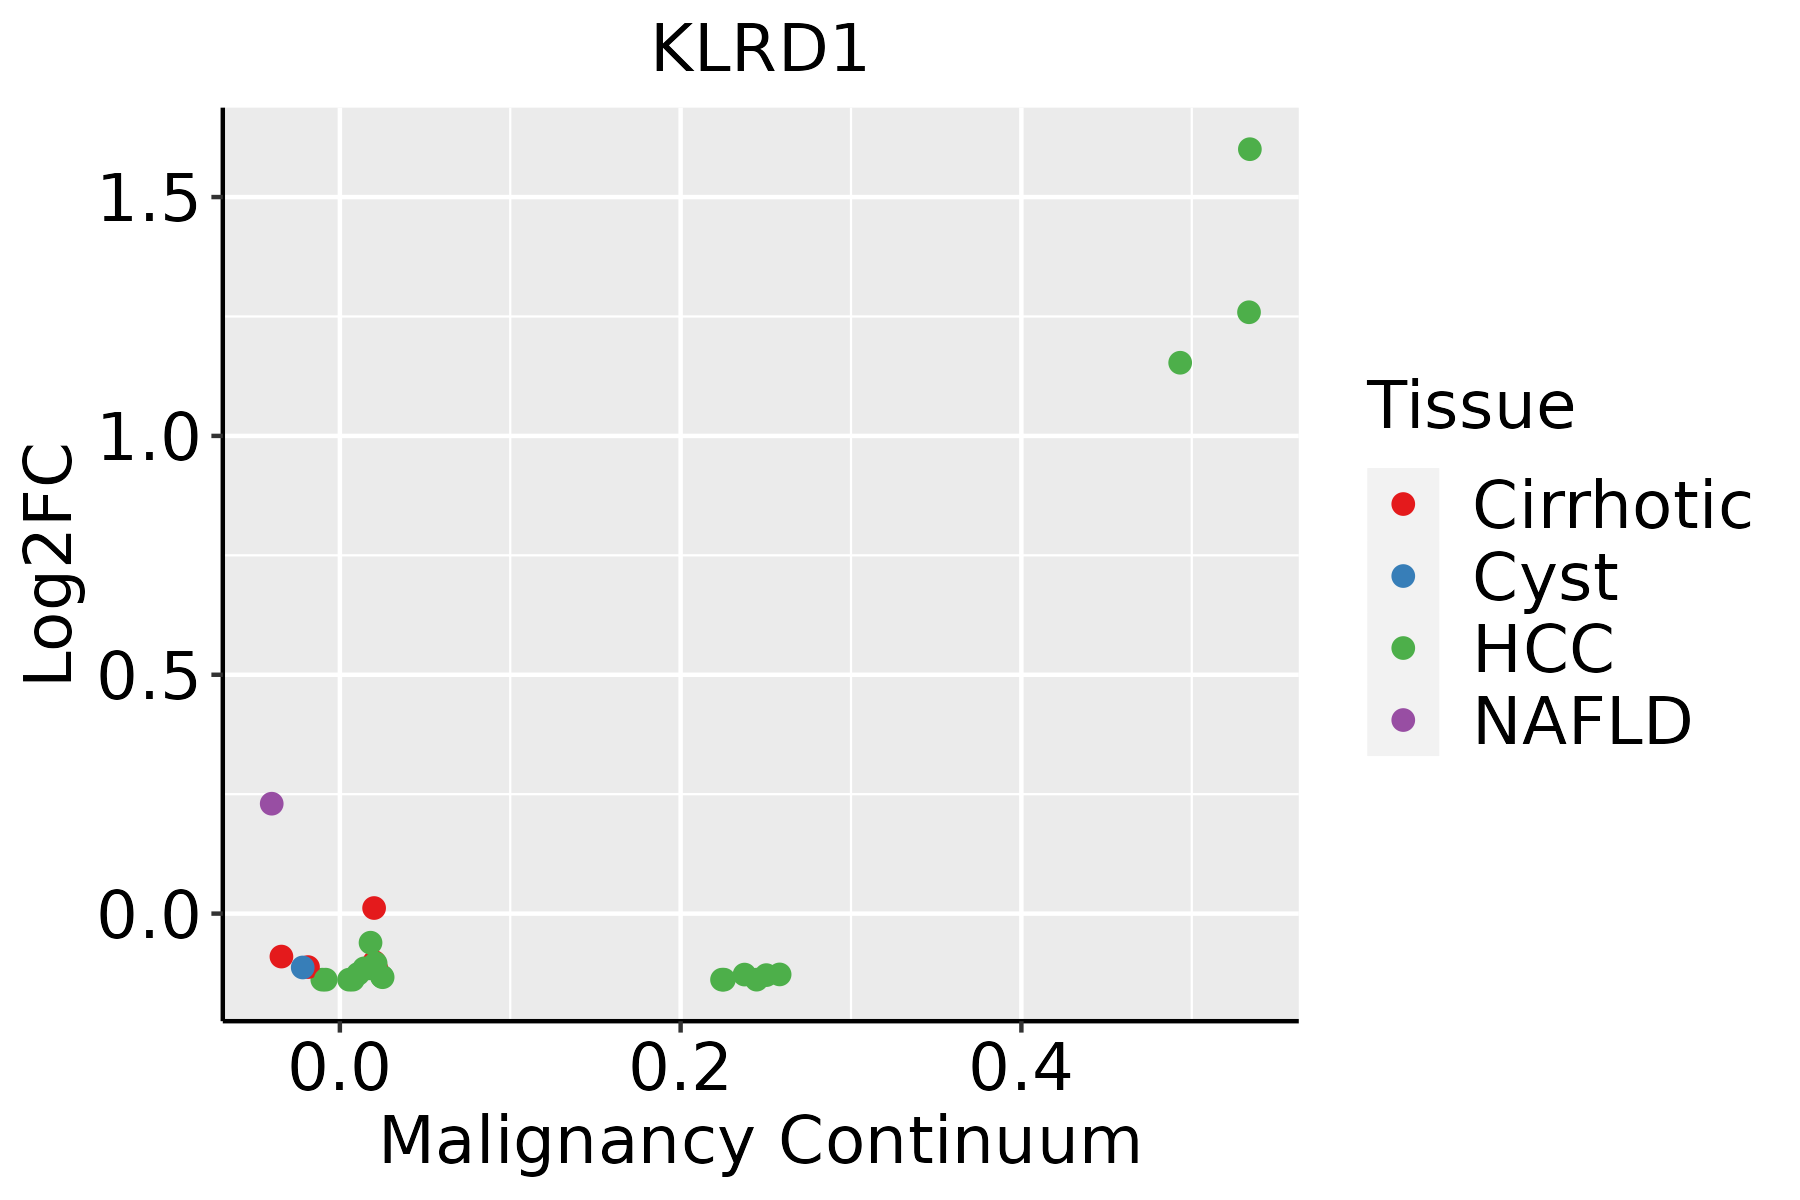 | HCC: Hepatocellular carcinoma |
| NAFLD: Non-alcoholic fatty liver disease |
| ∗log2FC in expression of this searched gene in stem-like cells from each diseased tissue sample relative to stem-like cells in normal samples in each tissue plotted against the malignancy continuum. Samples are colored based on if they are from different disease stage. |
Top |
Malignant transformation related pathway analysis |
| Find out the enriched GO biological processes and KEGG pathways involved in transition from healthy to precancer to cancer |
| Tissue | Disease Stage | Enriched GO biological Processes |
| Colorectum | AD |  |
| Colorectum | SER |  |
| Colorectum | MSS |  |
| Colorectum | MSI-H |  |
| Colorectum | FAP |  |
| ∗Top 15 enriched GO BP terms are showed in the bar plot of each disease state in each tissue. Each row represents a significant GO biological process which is colored according to the -log10(p.adjust). |
| Page: 1 2 3 4 5 6 7 8 9 |
| GO ID | Tissue | Disease Stage | Description | Gene Ratio | Bg Ratio | pvalue | p.adjust | Count |
| GO:00028321 | Liver | HCC | negative regulation of response to biotic stimulus | 66/7958 | 108/18723 | 7.24e-05 | 6.50e-04 | 66 |
| GO:00028312 | Liver | HCC | regulation of response to biotic stimulus | 173/7958 | 327/18723 | 8.55e-05 | 7.48e-04 | 173 |
| GO:00450881 | Liver | HCC | regulation of innate immune response | 113/7958 | 218/18723 | 3.27e-03 | 1.50e-02 | 113 |
| GO:00458241 | Liver | HCC | negative regulation of innate immune response | 42/7958 | 71/18723 | 3.41e-03 | 1.55e-02 | 42 |
| GO:0002218 | Liver | HCC | activation of innate immune response | 32/7958 | 52/18723 | 4.35e-03 | 1.89e-02 | 32 |
| GO:0050777 | Liver | HCC | negative regulation of immune response | 101/7958 | 194/18723 | 4.40e-03 | 1.90e-02 | 101 |
| Page: 1 |
| Pathway ID | Tissue | Disease Stage | Description | Gene Ratio | Bg Ratio | pvalue | p.adjust | qvalue | Count |
| Page: 1 |
Top |
Cell-cell communication analysis |
| Identification of potential cell-cell interactions between two cell types and their ligand-receptor pairs for different disease states |
| Ligand | Receptor | LRpair | Pathway | Tissue | Disease Stage |
| Page: 1 |
Top |
Single-cell gene regulatory network inference analysis |
| Find out the significant the regulons (TFs) and the target genes of each regulon across cell types for different disease states |
| TF | Cell Type | Tissue | Disease Stage | Target Gene | RSS | Regulon Activity |
| ∗The dot plots of a searched regulon are shown for all cell subpopulations in each disease state of each tissue based on the regulon specific score inferred using pySCENIC and by calculating the average expression. |
| Page: 1 |
Top |
Somatic mutation of malignant transformation related genes |
| Annotation of somatic variants for genes involved in malignant transformation |
| Hugo Symbol | Variant Class | Variant Classification | dbSNP RS | HGVSc | HGVSp | HGVSp Short | SWISSPROT | BIOTYPE | SIFT | PolyPhen | Tumor Sample Barcode | Tissue | Histology | Sex | Age | Stage | Therapy Types | Drugs | Outcome |
| KLRD1 | SNV | Missense_Mutation | c.38N>G | p.Ser13Cys | p.S13C | Q13241 | protein_coding | deleterious(0) | probably_damaging(0.999) | TCGA-BH-A0B6-01 | Breast | breast invasive carcinoma | Female | <65 | I/II | Unknown | Unknown | SD | |
| KLRD1 | SNV | Missense_Mutation | c.22N>G | p.Leu8Val | p.L8V | Q13241 | protein_coding | tolerated(0.51) | benign(0.05) | TCGA-GM-A2D9-01 | Breast | breast invasive carcinoma | Female | >=65 | I/II | Hormone Therapy | arimidex | SD | |
| KLRD1 | SNV | Missense_Mutation | c.247N>G | p.Asn83Asp | p.N83D | Q13241 | protein_coding | tolerated(0.34) | benign(0.078) | TCGA-IR-A3LA-01 | Cervix | cervical & endocervical cancer | Female | <65 | I/II | Chemotherapy | cisplatin | CR | |
| KLRD1 | SNV | Missense_Mutation | c.214N>C | p.Cys72Arg | p.C72R | Q13241 | protein_coding | deleterious(0) | probably_damaging(0.999) | TCGA-AA-3977-01 | Colorectum | colon adenocarcinoma | Male | >=65 | I/II | Unknown | Unknown | SD | |
| KLRD1 | SNV | Missense_Mutation | rs201683513 | c.77C>T | p.Thr26Met | p.T26M | Q13241 | protein_coding | deleterious(0) | probably_damaging(0.948) | TCGA-G4-6302-01 | Colorectum | colon adenocarcinoma | Female | >=65 | I/II | Unknown | Unknown | SD |
| KLRD1 | SNV | Missense_Mutation | rs755827000 | c.65C>T | p.Ser22Leu | p.S22L | Q13241 | protein_coding | tolerated(1) | benign(0) | TCGA-EI-6917-01 | Colorectum | rectum adenocarcinoma | Male | <65 | III/IV | Chemotherapy | 5fluorouracil+oxaciplatina+l-folinian | SD |
| KLRD1 | insertion | Frame_Shift_Ins | novel | c.237_238insA | p.Thr81AsnfsTer24 | p.T81Nfs*24 | Q13241 | protein_coding | TCGA-AA-3815-01 | Colorectum | colon adenocarcinoma | Female | >=65 | I/II | Unknown | Unknown | SD | ||
| KLRD1 | insertion | Frame_Shift_Ins | novel | c.187_188insA | p.Trp65MetfsTer14 | p.W65Mfs*14 | Q13241 | protein_coding | TCGA-CK-5916-01 | Colorectum | colon adenocarcinoma | Female | >=65 | I/II | Unknown | Unknown | PD | ||
| KLRD1 | SNV | Missense_Mutation | novel | c.20N>A | p.Thr7Asn | p.T7N | Q13241 | protein_coding | tolerated(0.07) | benign(0.221) | TCGA-A5-A0G1-01 | Endometrium | uterine corpus endometrioid carcinoma | Female | >=65 | I/II | Unknown | Unknown | SD |
| KLRD1 | SNV | Missense_Mutation | novel | c.508N>C | p.Asn170His | p.N170H | Q13241 | protein_coding | tolerated(0.08) | possibly_damaging(0.458) | TCGA-AJ-A3EL-01 | Endometrium | uterine corpus endometrioid carcinoma | Female | <65 | I/II | Unknown | Unknown | SD |
| Page: 1 2 3 |
Top |
Related drugs of malignant transformation related genes |
| Identification of chemicals and drugs interact with genes involved in malignant transfromation |
| (DGIdb 4.0) |
| Entrez ID | Symbol | Category | Interaction Types | Drug Claim Name | Drug Name | PMIDs |
| 3824 | KLRD1 | EXTERNAL SIDE OF PLASMA MEMBRANE, DRUGGABLE GENOME | adalimumab | ADALIMUMAB | 26453102 | |
| 3824 | KLRD1 | EXTERNAL SIDE OF PLASMA MEMBRANE, DRUGGABLE GENOME | methotrexate | METHOTREXATE | 26453102 | |
| 3824 | KLRD1 | EXTERNAL SIDE OF PLASMA MEMBRANE, DRUGGABLE GENOME | infliximab | INFLIXIMAB | 26453102 | |
| 3824 | KLRD1 | EXTERNAL SIDE OF PLASMA MEMBRANE, DRUGGABLE GENOME | etanercept | ETANERCEPT | 26453102 | |
| 3824 | KLRD1 | EXTERNAL SIDE OF PLASMA MEMBRANE, DRUGGABLE GENOME | glucocorticoids | 26453102 | ||
| 3824 | KLRD1 | EXTERNAL SIDE OF PLASMA MEMBRANE, DRUGGABLE GENOME | certolizumab pegol | 26453102 |
| Page: 1 |

Copyright 2023-Present -The University of Texas Health Science Center at Houston |