
|
|||||
|
 | |
| |
| |
| |
| |
| |
|
Gene: KLK7 |
Gene summary for KLK7 |
| Gene information | Species | Human | Gene symbol | KLK7 | Gene ID | 5650 |
| Gene name | kallikrein related peptidase 7 | |
| Gene Alias | PRSS6 | |
| Cytomap | 19q13.41 | |
| Gene Type | protein-coding | GO ID | GO:0002225 | UniProtAcc | P49862 |
Top |
Malignant transformation analysis |
| Identification of the aberrant gene expression in precancerous and cancerous lesions by comparing the gene expression of stem-like cells in diseased tissues with normal stem cells |
| Entrez ID | Symbol | Replicates | Species | Organ | Tissue | Adj P-value | Log2FC | Malignancy |
| 5650 | KLK7 | P5T-E | Human | Esophagus | ESCC | 3.94e-02 | 1.04e-01 | 0.1327 |
| 5650 | KLK7 | P28T-E | Human | Esophagus | ESCC | 2.88e-02 | 1.25e-01 | 0.1149 |
| 5650 | KLK7 | P49T-E | Human | Esophagus | ESCC | 5.36e-06 | 8.55e-01 | 0.1768 |
| 5650 | KLK7 | P74T-E | Human | Esophagus | ESCC | 9.40e-31 | 1.19e+00 | 0.1479 |
| 5650 | KLK7 | P91T-E | Human | Esophagus | ESCC | 5.93e-08 | 4.50e-01 | 0.1828 |
| 5650 | KLK7 | P107T-E | Human | Esophagus | ESCC | 1.60e-08 | 2.41e-01 | 0.171 |
| Page: 1 |
| Tissue | Expression Dynamics | Abbreviation |
| Esophagus | 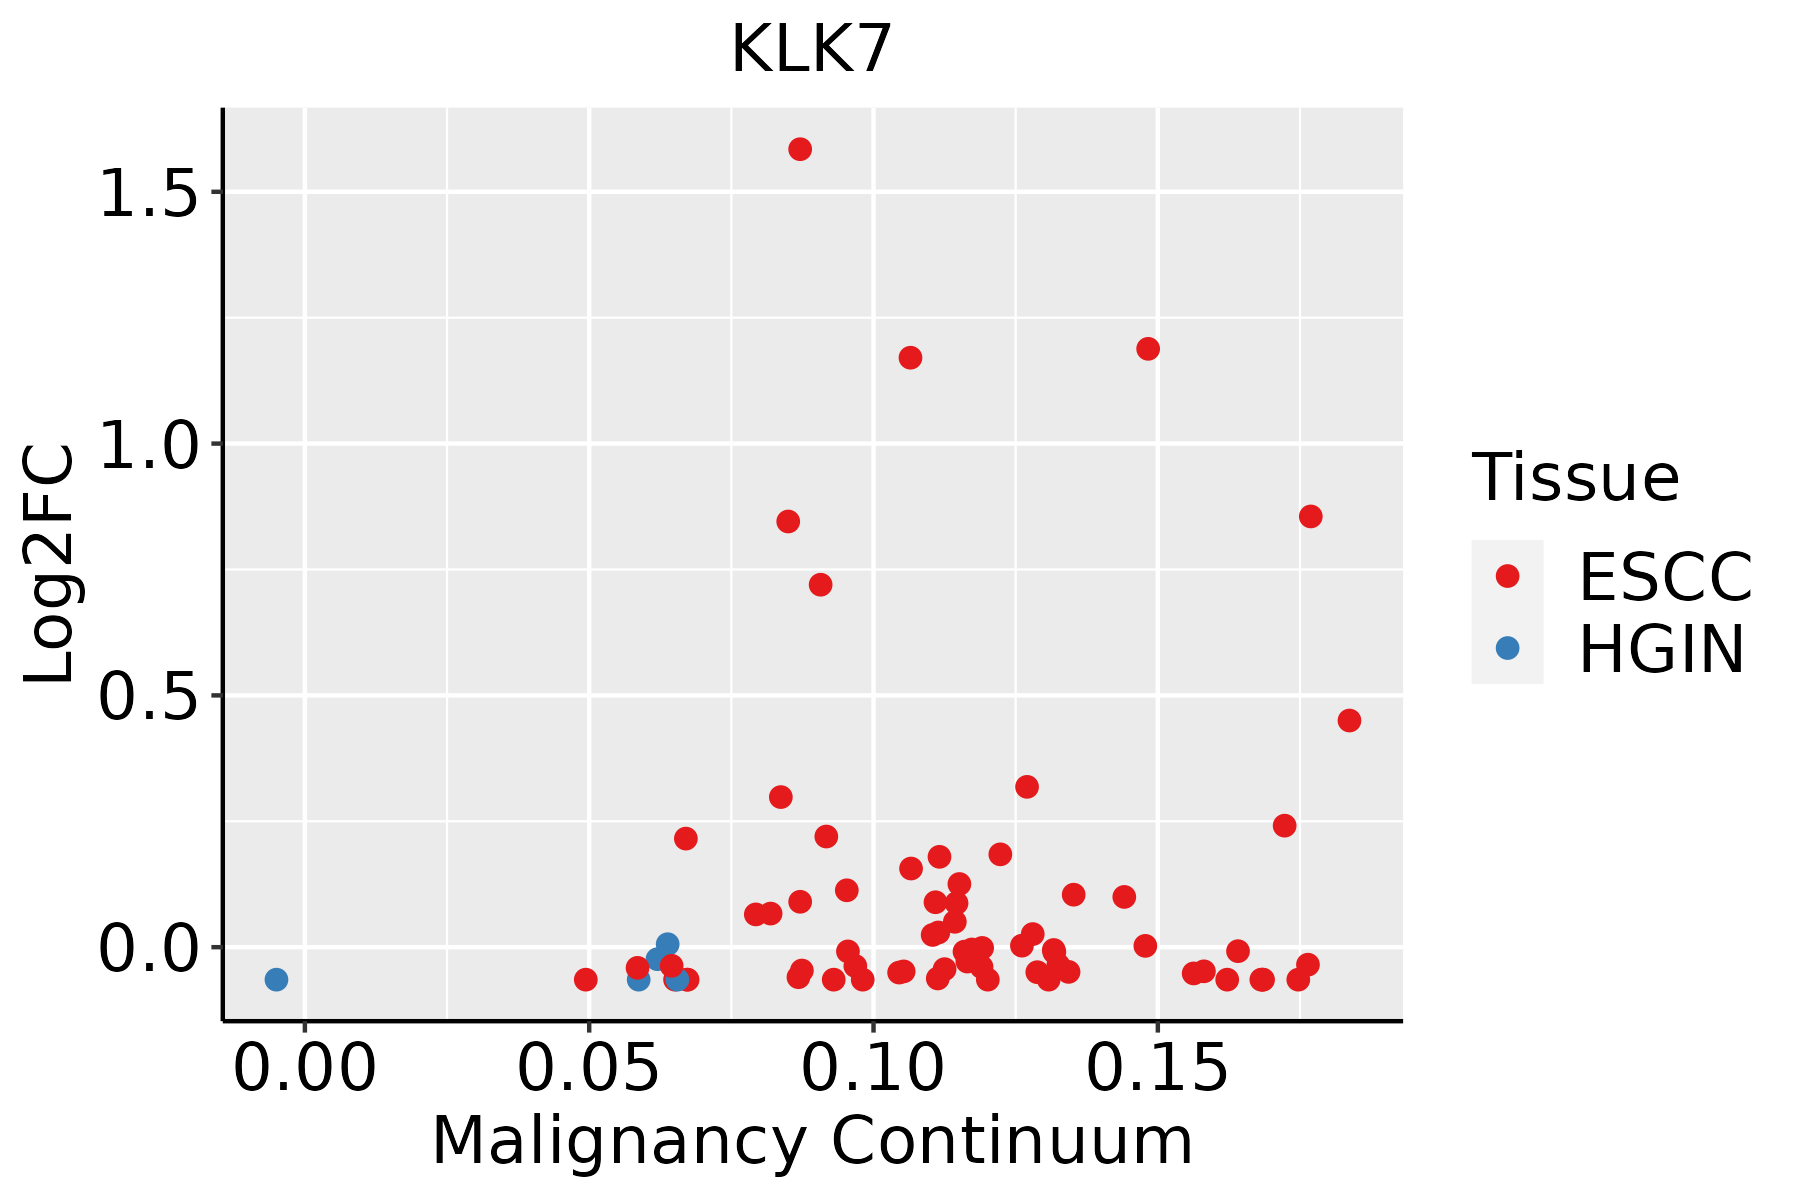 | ESCC: Esophageal squamous cell carcinoma |
| HGIN: High-grade intraepithelial neoplasias | ||
| LGIN: Low-grade intraepithelial neoplasias |
| ∗log2FC in expression of this searched gene in stem-like cells from each diseased tissue sample relative to stem-like cells in normal samples in each tissue plotted against the malignancy continuum. Samples are colored based on if they are from different disease stage. |
Top |
Malignant transformation related pathway analysis |
| Find out the enriched GO biological processes and KEGG pathways involved in transition from healthy to precancer to cancer |
| Tissue | Disease Stage | Enriched GO biological Processes |
| Colorectum | AD |  |
| Colorectum | SER |  |
| Colorectum | MSS |  |
| Colorectum | MSI-H |  |
| Colorectum | FAP |  |
| ∗Top 15 enriched GO BP terms are showed in the bar plot of each disease state in each tissue. Each row represents a significant GO biological process which is colored according to the -log10(p.adjust). |
| Page: 1 2 3 4 5 6 7 8 9 |
| GO ID | Tissue | Disease Stage | Description | Gene Ratio | Bg Ratio | pvalue | p.adjust | Count |
| GO:0022411111 | Esophagus | ESCC | cellular component disassembly | 305/8552 | 443/18723 | 1.94e-23 | 4.57e-21 | 305 |
| GO:000854410 | Esophagus | ESCC | epidermis development | 193/8552 | 324/18723 | 2.87e-07 | 4.19e-06 | 193 |
| GO:00028318 | Esophagus | ESCC | regulation of response to biotic stimulus | 191/8552 | 327/18723 | 2.12e-06 | 2.45e-05 | 191 |
| GO:00301984 | Esophagus | ESCC | extracellular matrix organization | 171/8552 | 301/18723 | 6.08e-05 | 4.67e-04 | 171 |
| GO:00430624 | Esophagus | ESCC | extracellular structure organization | 171/8552 | 302/18723 | 7.73e-05 | 5.76e-04 | 171 |
| GO:00452294 | Esophagus | ESCC | external encapsulating structure organization | 172/8552 | 304/18723 | 7.80e-05 | 5.80e-04 | 172 |
| GO:00226172 | Esophagus | ESCC | extracellular matrix disassembly | 39/8552 | 63/18723 | 6.92e-03 | 2.52e-02 | 39 |
| Page: 1 |
| Pathway ID | Tissue | Disease Stage | Description | Gene Ratio | Bg Ratio | pvalue | p.adjust | qvalue | Count |
| Page: 1 |
Top |
Cell-cell communication analysis |
| Identification of potential cell-cell interactions between two cell types and their ligand-receptor pairs for different disease states |
| Ligand | Receptor | LRpair | Pathway | Tissue | Disease Stage |
| Page: 1 |
Top |
Single-cell gene regulatory network inference analysis |
| Find out the significant the regulons (TFs) and the target genes of each regulon across cell types for different disease states |
| TF | Cell Type | Tissue | Disease Stage | Target Gene | RSS | Regulon Activity |
| ∗The dot plots of a searched regulon are shown for all cell subpopulations in each disease state of each tissue based on the regulon specific score inferred using pySCENIC and by calculating the average expression. |
| Page: 1 |
Top |
Somatic mutation of malignant transformation related genes |
| Annotation of somatic variants for genes involved in malignant transformation |
| Hugo Symbol | Variant Class | Variant Classification | dbSNP RS | HGVSc | HGVSp | HGVSp Short | SWISSPROT | BIOTYPE | SIFT | PolyPhen | Tumor Sample Barcode | Tissue | Histology | Sex | Age | Stage | Therapy Types | Drugs | Outcome |
| KLK7 | SNV | Missense_Mutation | rs200158151 | c.251N>T | p.Thr84Met | p.T84M | P49862 | protein_coding | tolerated(0.15) | benign(0.078) | TCGA-E2-A14T-01 | Breast | breast invasive carcinoma | Female | <65 | I/II | Chemotherapy | doxorubicin | SD |
| KLK7 | insertion | Frame_Shift_Ins | novel | c.684_685insGGGGTCCCACAGGGGTCTGCCAGAAGTAAGCAAACAGTGC | p.Pro229GlyfsTer16 | p.P229Gfs*16 | P49862 | protein_coding | TCGA-A8-A08X-01 | Breast | breast invasive carcinoma | Female | <65 | III/IV | Chemotherapy | doxorubicin | PD | ||
| KLK7 | SNV | Missense_Mutation | novel | c.571G>A | p.Ala191Thr | p.A191T | P49862 | protein_coding | deleterious(0.02) | probably_damaging(1) | TCGA-EA-A410-01 | Cervix | cervical & endocervical cancer | Female | <65 | I/II | Unknown | Unknown | SD |
| KLK7 | SNV | Missense_Mutation | rs754525282 | c.677N>A | p.Cys226Tyr | p.C226Y | P49862 | protein_coding | deleterious(0) | probably_damaging(1) | TCGA-VS-A8EK-01 | Cervix | cervical & endocervical cancer | Female | >=65 | I/II | Chemotherapy | cisplatin | PD |
| KLK7 | SNV | Missense_Mutation | c.667N>C | p.Thr223Pro | p.T223P | P49862 | protein_coding | tolerated(0.2) | benign(0.006) | TCGA-AA-3710-01 | Colorectum | colon adenocarcinoma | Female | >=65 | I/II | Unknown | Unknown | SD | |
| KLK7 | SNV | Missense_Mutation | rs772780663 | c.298N>T | p.Arg100Cys | p.R100C | P49862 | protein_coding | tolerated(0.1) | probably_damaging(0.975) | TCGA-AZ-4315-01 | Colorectum | colon adenocarcinoma | Male | <65 | I/II | Unknown | Unknown | SD |
| KLK7 | SNV | Missense_Mutation | novel | c.559T>G | p.Ser187Ala | p.S187A | P49862 | protein_coding | tolerated(0.2) | possibly_damaging(0.658) | TCGA-F5-6814-01 | Colorectum | rectum adenocarcinoma | Male | <65 | I/II | Unknown | Unknown | SD |
| KLK7 | SNV | Missense_Mutation | novel | c.628G>A | p.Val210Met | p.V210M | P49862 | protein_coding | tolerated(0.45) | possibly_damaging(0.756) | TCGA-A5-A0G1-01 | Endometrium | uterine corpus endometrioid carcinoma | Female | >=65 | I/II | Unknown | Unknown | SD |
| KLK7 | SNV | Missense_Mutation | rs780230799 | c.259G>A | p.Asp87Asn | p.D87N | P49862 | protein_coding | tolerated(0.14) | probably_damaging(0.921) | TCGA-AJ-A3EK-01 | Endometrium | uterine corpus endometrioid carcinoma | Female | <65 | I/II | Chemotherapy | carboplatin | CR |
| KLK7 | SNV | Missense_Mutation | c.337N>A | p.Leu113Ile | p.L113I | P49862 | protein_coding | tolerated(1) | benign(0.345) | TCGA-AP-A051-01 | Endometrium | uterine corpus endometrioid carcinoma | Female | >=65 | I/II | Unknown | Unknown | SD |
| Page: 1 2 3 |
Top |
Related drugs of malignant transformation related genes |
| Identification of chemicals and drugs interact with genes involved in malignant transfromation |
| (DGIdb 4.0) |
| Entrez ID | Symbol | Category | Interaction Types | Drug Claim Name | Drug Name | PMIDs |
| 5650 | KLK7 | ENZYME, PROTEASE, DRUGGABLE GENOME | inhibitor | 252166696 | ||
| 5650 | KLK7 | ENZYME, PROTEASE, DRUGGABLE GENOME | inhibitor | 252166691 | ||
| 5650 | KLK7 | ENZYME, PROTEASE, DRUGGABLE GENOME | CASTANIN | CASTANIN |
| Page: 1 |

Copyright 2023-Present -The University of Texas Health Science Center at Houston |