
|
|||||
|
 | |
| |
| |
| |
| |
| |
|
Gene: KLK6 |
Gene summary for KLK6 |
| Gene information | Species | Human | Gene symbol | KLK6 | Gene ID | 5653 |
| Gene name | kallikrein related peptidase 6 | |
| Gene Alias | Bssp | |
| Cytomap | 19q13.41 | |
| Gene Type | protein-coding | GO ID | GO:0006508 | UniProtAcc | A0A024R4J8 |
Top |
Malignant transformation analysis |
| Identification of the aberrant gene expression in precancerous and cancerous lesions by comparing the gene expression of stem-like cells in diseased tissues with normal stem cells |
| Entrez ID | Symbol | Replicates | Species | Organ | Tissue | Adj P-value | Log2FC | Malignancy |
| 5653 | KLK6 | LZE22T | Human | Esophagus | ESCC | 1.18e-02 | 8.82e-01 | 0.068 |
| 5653 | KLK6 | P2T-E | Human | Esophagus | ESCC | 1.15e-02 | 1.51e-01 | 0.1177 |
| 5653 | KLK6 | P15T-E | Human | Esophagus | ESCC | 1.19e-23 | 6.39e-01 | 0.1149 |
| 5653 | KLK6 | P16T-E | Human | Esophagus | ESCC | 1.79e-70 | 1.65e+00 | 0.1153 |
| 5653 | KLK6 | P21T-E | Human | Esophagus | ESCC | 3.50e-02 | 1.10e-01 | 0.1617 |
| 5653 | KLK6 | P22T-E | Human | Esophagus | ESCC | 2.86e-20 | 4.61e-01 | 0.1236 |
| 5653 | KLK6 | P31T-E | Human | Esophagus | ESCC | 4.40e-09 | 5.17e-01 | 0.1251 |
| 5653 | KLK6 | P37T-E | Human | Esophagus | ESCC | 3.70e-03 | 1.59e-01 | 0.1371 |
| 5653 | KLK6 | P47T-E | Human | Esophagus | ESCC | 3.89e-12 | 5.70e-01 | 0.1067 |
| 5653 | KLK6 | P49T-E | Human | Esophagus | ESCC | 1.61e-16 | 1.35e+00 | 0.1768 |
| 5653 | KLK6 | P56T-E | Human | Esophagus | ESCC | 6.85e-08 | 1.30e+00 | 0.1613 |
| 5653 | KLK6 | P61T-E | Human | Esophagus | ESCC | 1.62e-06 | 2.44e-01 | 0.099 |
| 5653 | KLK6 | P74T-E | Human | Esophagus | ESCC | 1.73e-25 | 8.22e-01 | 0.1479 |
| 5653 | KLK6 | P76T-E | Human | Esophagus | ESCC | 1.42e-30 | 8.30e-01 | 0.1207 |
| 5653 | KLK6 | P82T-E | Human | Esophagus | ESCC | 8.16e-03 | 1.11e+00 | 0.1072 |
| 5653 | KLK6 | P126T-E | Human | Esophagus | ESCC | 5.74e-05 | 4.96e-01 | 0.1125 |
| Page: 1 |
| Tissue | Expression Dynamics | Abbreviation |
| Esophagus | 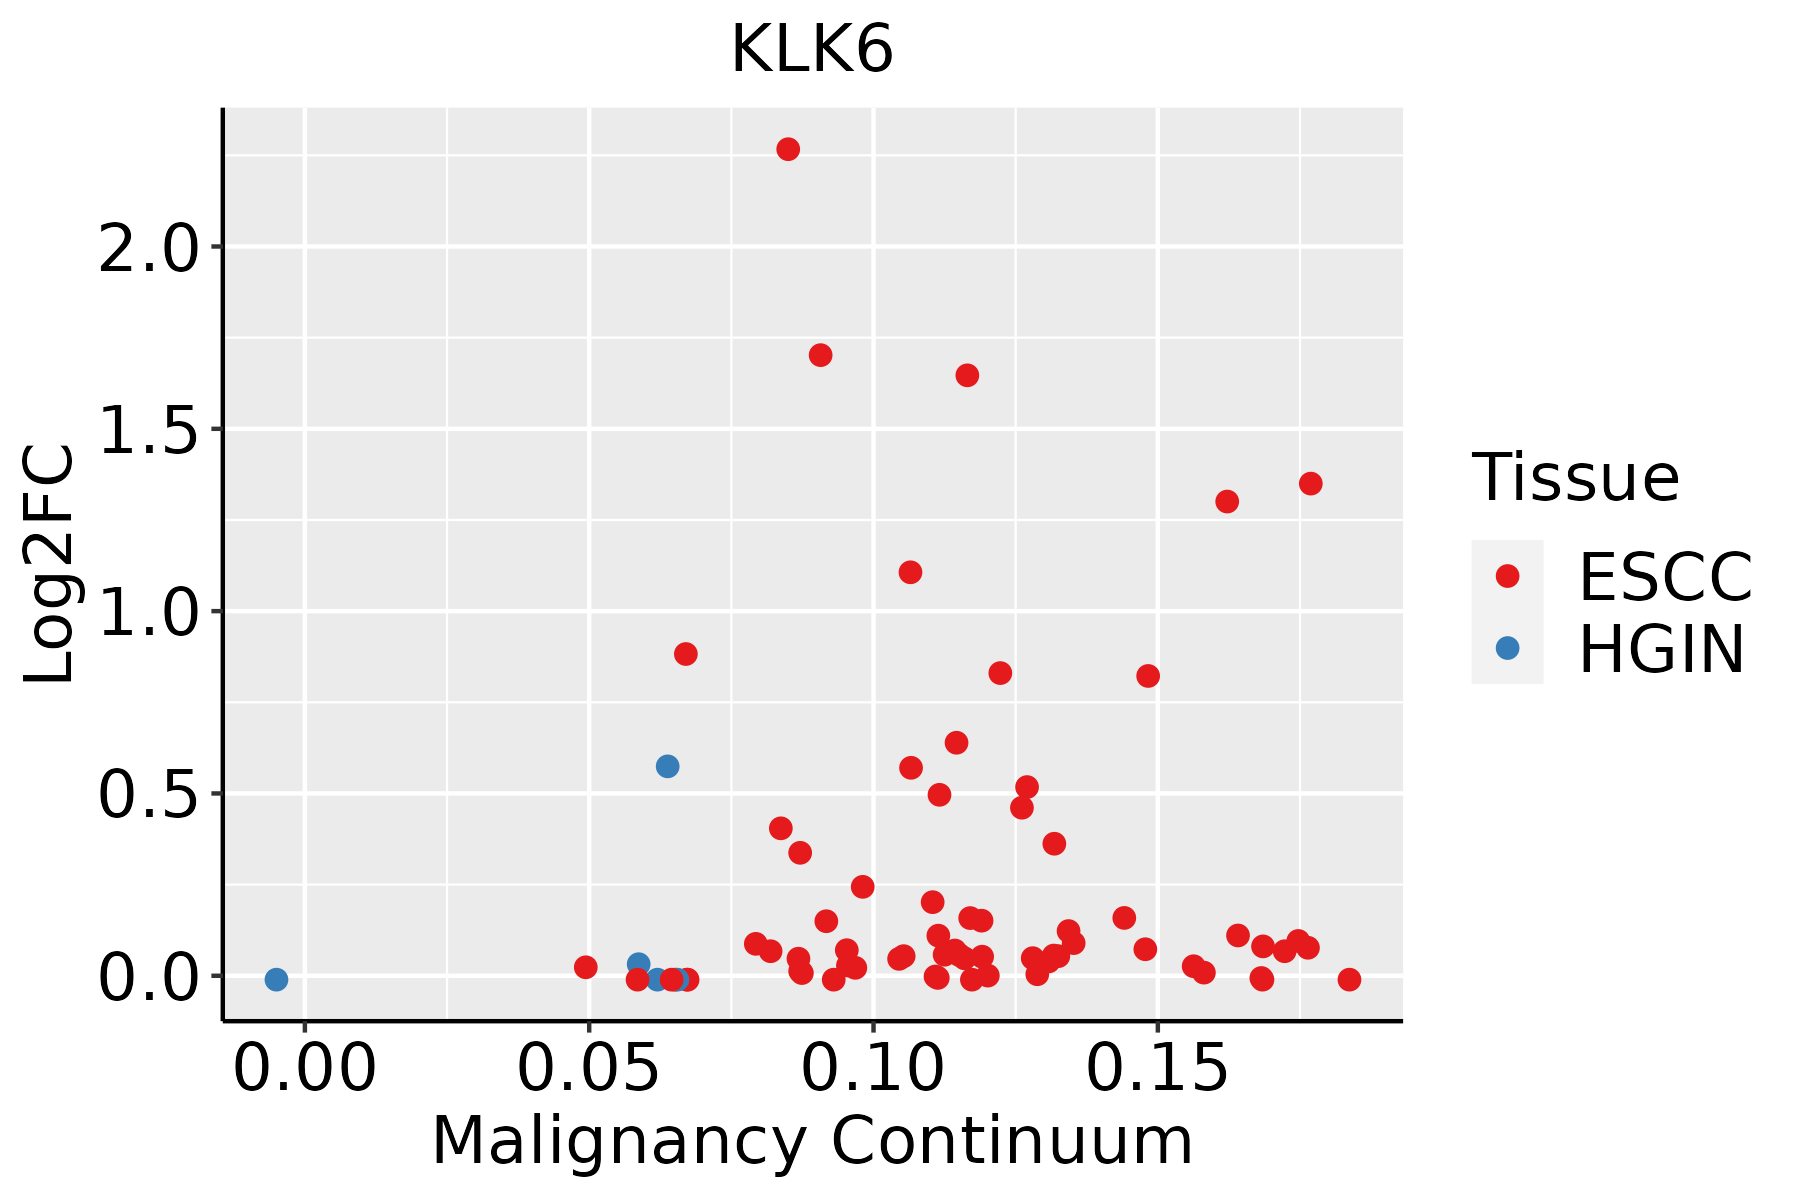 | ESCC: Esophageal squamous cell carcinoma |
| HGIN: High-grade intraepithelial neoplasias | ||
| LGIN: Low-grade intraepithelial neoplasias |
| ∗log2FC in expression of this searched gene in stem-like cells from each diseased tissue sample relative to stem-like cells in normal samples in each tissue plotted against the malignancy continuum. Samples are colored based on if they are from different disease stage. |
Top |
Malignant transformation related pathway analysis |
| Find out the enriched GO biological processes and KEGG pathways involved in transition from healthy to precancer to cancer |
| Tissue | Disease Stage | Enriched GO biological Processes |
| Colorectum | AD |  |
| Colorectum | SER |  |
| Colorectum | MSS |  |
| Colorectum | MSI-H |  |
| Colorectum | FAP |  |
| ∗Top 15 enriched GO BP terms are showed in the bar plot of each disease state in each tissue. Each row represents a significant GO biological process which is colored according to the -log10(p.adjust). |
| Page: 1 2 3 4 5 6 7 8 9 |
| GO ID | Tissue | Disease Stage | Description | Gene Ratio | Bg Ratio | pvalue | p.adjust | Count |
| GO:005160418 | Esophagus | ESCC | protein maturation | 189/8552 | 294/18723 | 7.64e-11 | 2.39e-09 | 189 |
| GO:003109910 | Esophagus | ESCC | regeneration | 122/8552 | 198/18723 | 4.26e-06 | 4.57e-05 | 122 |
| GO:001648514 | Esophagus | ESCC | protein processing | 134/8552 | 225/18723 | 1.81e-05 | 1.60e-04 | 134 |
| GO:00425524 | Esophagus | ESCC | myelination | 85/8552 | 134/18723 | 2.51e-05 | 2.13e-04 | 85 |
| GO:00072724 | Esophagus | ESCC | ensheathment of neurons | 86/8552 | 136/18723 | 2.68e-05 | 2.24e-04 | 86 |
| GO:00083664 | Esophagus | ESCC | axon ensheathment | 86/8552 | 136/18723 | 2.68e-05 | 2.24e-04 | 86 |
| GO:001097516 | Esophagus | ESCC | regulation of neuron projection development | 240/8552 | 445/18723 | 2.48e-04 | 1.53e-03 | 240 |
| GO:00329631 | Esophagus | ESCC | collagen metabolic process | 62/8552 | 104/18723 | 2.90e-03 | 1.22e-02 | 62 |
| Page: 1 |
| Pathway ID | Tissue | Disease Stage | Description | Gene Ratio | Bg Ratio | pvalue | p.adjust | qvalue | Count |
| Page: 1 |
Top |
Cell-cell communication analysis |
| Identification of potential cell-cell interactions between two cell types and their ligand-receptor pairs for different disease states |
| Ligand | Receptor | LRpair | Pathway | Tissue | Disease Stage |
| Page: 1 |
Top |
Single-cell gene regulatory network inference analysis |
| Find out the significant the regulons (TFs) and the target genes of each regulon across cell types for different disease states |
| TF | Cell Type | Tissue | Disease Stage | Target Gene | RSS | Regulon Activity |
| ∗The dot plots of a searched regulon are shown for all cell subpopulations in each disease state of each tissue based on the regulon specific score inferred using pySCENIC and by calculating the average expression. |
| Page: 1 |
Top |
Somatic mutation of malignant transformation related genes |
| Annotation of somatic variants for genes involved in malignant transformation |
| Hugo Symbol | Variant Class | Variant Classification | dbSNP RS | HGVSc | HGVSp | HGVSp Short | SWISSPROT | BIOTYPE | SIFT | PolyPhen | Tumor Sample Barcode | Tissue | Histology | Sex | Age | Stage | Therapy Types | Drugs | Outcome |
| KLK6 | SNV | Missense_Mutation | c.358N>A | p.Glu120Lys | p.E120K | Q92876 | protein_coding | tolerated(0.73) | benign(0.003) | TCGA-A8-A09G-01 | Breast | breast invasive carcinoma | Female | >=65 | III/IV | Unknown | Unknown | SD | |
| KLK6 | insertion | In_Frame_Ins | novel | c.463_464insCCTCCTCTCCCTCCTCCTCCTCGTCTTCCCCCTCCTCCTCCTCCT | p.Ile155delinsThrSerSerProSerSerSerSerSerSerProSerSerSerSerPhe | p.I155delinsTSSPSSSSSSPSSSSF | Q92876 | protein_coding | TCGA-AN-A04C-01 | Breast | breast invasive carcinoma | Female | <65 | I/II | Unknown | Unknown | SD | ||
| KLK6 | SNV | Missense_Mutation | c.19G>C | p.Val7Leu | p.V7L | Q92876 | protein_coding | tolerated(0.36) | benign(0.003) | TCGA-A6-2681-01 | Colorectum | colon adenocarcinoma | Female | >=65 | I/II | Unknown | Unknown | PD | |
| KLK6 | SNV | Missense_Mutation | rs765571984 | c.92N>T | p.Thr31Ile | p.T31I | Q92876 | protein_coding | tolerated(0.05) | benign(0.027) | TCGA-CK-6748-01 | Colorectum | colon adenocarcinoma | Female | <65 | III/IV | Unknown | Unknown | SD |
| KLK6 | SNV | Missense_Mutation | c.85N>T | p.Asp29Tyr | p.D29Y | Q92876 | protein_coding | deleterious(0.03) | benign(0.02) | TCGA-G4-6317-01 | Colorectum | colon adenocarcinoma | Female | <65 | III/IV | Chemotherapy | fluorouracil | PD | |
| KLK6 | SNV | Missense_Mutation | c.679T>C | p.Tyr227His | p.Y227H | Q92876 | protein_coding | deleterious(0) | probably_damaging(1) | TCGA-NH-A50T-01 | Colorectum | colon adenocarcinoma | Female | >=65 | I/II | Unknown | Unknown | SD | |
| KLK6 | SNV | Missense_Mutation | novel | c.464T>C | p.Ile155Thr | p.I155T | Q92876 | protein_coding | deleterious(0) | benign(0.067) | TCGA-F5-6814-01 | Colorectum | rectum adenocarcinoma | Male | <65 | I/II | Unknown | Unknown | SD |
| KLK6 | SNV | Missense_Mutation | novel | c.197C>T | p.Pro66Leu | p.P66L | Q92876 | protein_coding | tolerated(0.06) | benign(0.036) | TCGA-A5-A0G1-01 | Endometrium | uterine corpus endometrioid carcinoma | Female | >=65 | I/II | Unknown | Unknown | SD |
| KLK6 | SNV | Missense_Mutation | novel | c.178N>T | p.Ala60Ser | p.A60S | Q92876 | protein_coding | deleterious(0) | probably_damaging(0.928) | TCGA-A5-A1OF-01 | Endometrium | uterine corpus endometrioid carcinoma | Female | <65 | I/II | Unknown | Unknown | SD |
| KLK6 | SNV | Missense_Mutation | novel | c.73N>T | p.Gly25Cys | p.G25C | Q92876 | protein_coding | deleterious(0) | probably_damaging(1) | TCGA-A5-A1OF-01 | Endometrium | uterine corpus endometrioid carcinoma | Female | <65 | I/II | Unknown | Unknown | SD |
| Page: 1 2 3 4 |
Top |
Related drugs of malignant transformation related genes |
| Identification of chemicals and drugs interact with genes involved in malignant transfromation |
| (DGIdb 4.0) |
| Entrez ID | Symbol | Category | Interaction Types | Drug Claim Name | Drug Name | PMIDs |
| 5653 | KLK6 | PROTEASE, ENZYME, DRUGGABLE GENOME | inhibitor | 404859022 | ||
| 5653 | KLK6 | PROTEASE, ENZYME, DRUGGABLE GENOME | inhibitor | 404859023 | ||
| 5653 | KLK6 | PROTEASE, ENZYME, DRUGGABLE GENOME | inhibitor | 252166855 |
| Page: 1 |

Copyright 2023-Present -The University of Texas Health Science Center at Houston |