
|
|||||
|
 | |
| |
| |
| |
| |
| |
|
Gene: KLK5 |
Gene summary for KLK5 |
| Gene information | Species | Human | Gene symbol | KLK5 | Gene ID | 25818 |
| Gene name | kallikrein related peptidase 5 | |
| Gene Alias | KLK-L2 | |
| Cytomap | 19q13.41 | |
| Gene Type | protein-coding | GO ID | GO:0002225 | UniProtAcc | Q9Y337 |
Top |
Malignant transformation analysis |
| Identification of the aberrant gene expression in precancerous and cancerous lesions by comparing the gene expression of stem-like cells in diseased tissues with normal stem cells |
| Entrez ID | Symbol | Replicates | Species | Organ | Tissue | Adj P-value | Log2FC | Malignancy |
| 25818 | KLK5 | GSM4909281 | Human | Breast | IDC | 1.52e-09 | 5.20e-01 | 0.21 |
| 25818 | KLK5 | GSM4909285 | Human | Breast | IDC | 1.72e-05 | -1.40e-01 | 0.21 |
| 25818 | KLK5 | GSM4909286 | Human | Breast | IDC | 7.79e-05 | -1.43e-01 | 0.1081 |
| 25818 | KLK5 | GSM4909290 | Human | Breast | IDC | 5.07e-03 | -1.44e-01 | 0.2096 |
| 25818 | KLK5 | GSM4909294 | Human | Breast | IDC | 2.56e-02 | -1.28e-01 | 0.2022 |
| 25818 | KLK5 | GSM4909299 | Human | Breast | IDC | 8.13e-05 | 3.63e-01 | 0.035 |
| 25818 | KLK5 | GSM4909301 | Human | Breast | IDC | 3.66e-05 | -1.44e-01 | 0.1577 |
| 25818 | KLK5 | GSM4909304 | Human | Breast | IDC | 7.79e-05 | -1.44e-01 | 0.1636 |
| 25818 | KLK5 | GSM4909308 | Human | Breast | IDC | 3.00e-04 | -1.44e-01 | 0.158 |
| 25818 | KLK5 | GSM4909312 | Human | Breast | IDC | 1.72e-05 | -1.44e-01 | 0.1552 |
| 25818 | KLK5 | GSM4909319 | Human | Breast | IDC | 3.51e-04 | -1.44e-01 | 0.1563 |
| 25818 | KLK5 | GSM4909321 | Human | Breast | IDC | 7.79e-05 | -1.44e-01 | 0.1559 |
| 25818 | KLK5 | brca1 | Human | Breast | Precancer | 7.91e-25 | 7.61e-01 | -0.0338 |
| 25818 | KLK5 | brca10 | Human | Breast | Precancer | 4.88e-04 | -1.44e-01 | -0.0029 |
| 25818 | KLK5 | NCCBC5 | Human | Breast | DCIS | 2.81e-03 | -1.44e-01 | 0.2046 |
| 25818 | KLK5 | P1 | Human | Breast | IDC | 4.96e-03 | -1.20e-01 | 0.1527 |
| 25818 | KLK5 | DCIS2 | Human | Breast | DCIS | 5.40e-51 | 7.35e-01 | 0.0085 |
| 25818 | KLK5 | LZE22T | Human | Esophagus | ESCC | 1.34e-10 | 1.85e+00 | 0.068 |
| 25818 | KLK5 | LZE6T | Human | Esophagus | ESCC | 1.29e-05 | 2.50e-01 | 0.0845 |
| 25818 | KLK5 | P10T-E | Human | Esophagus | ESCC | 4.78e-10 | 7.36e-01 | 0.116 |
| Page: 1 2 3 |
| Tissue | Expression Dynamics | Abbreviation |
| Breast | 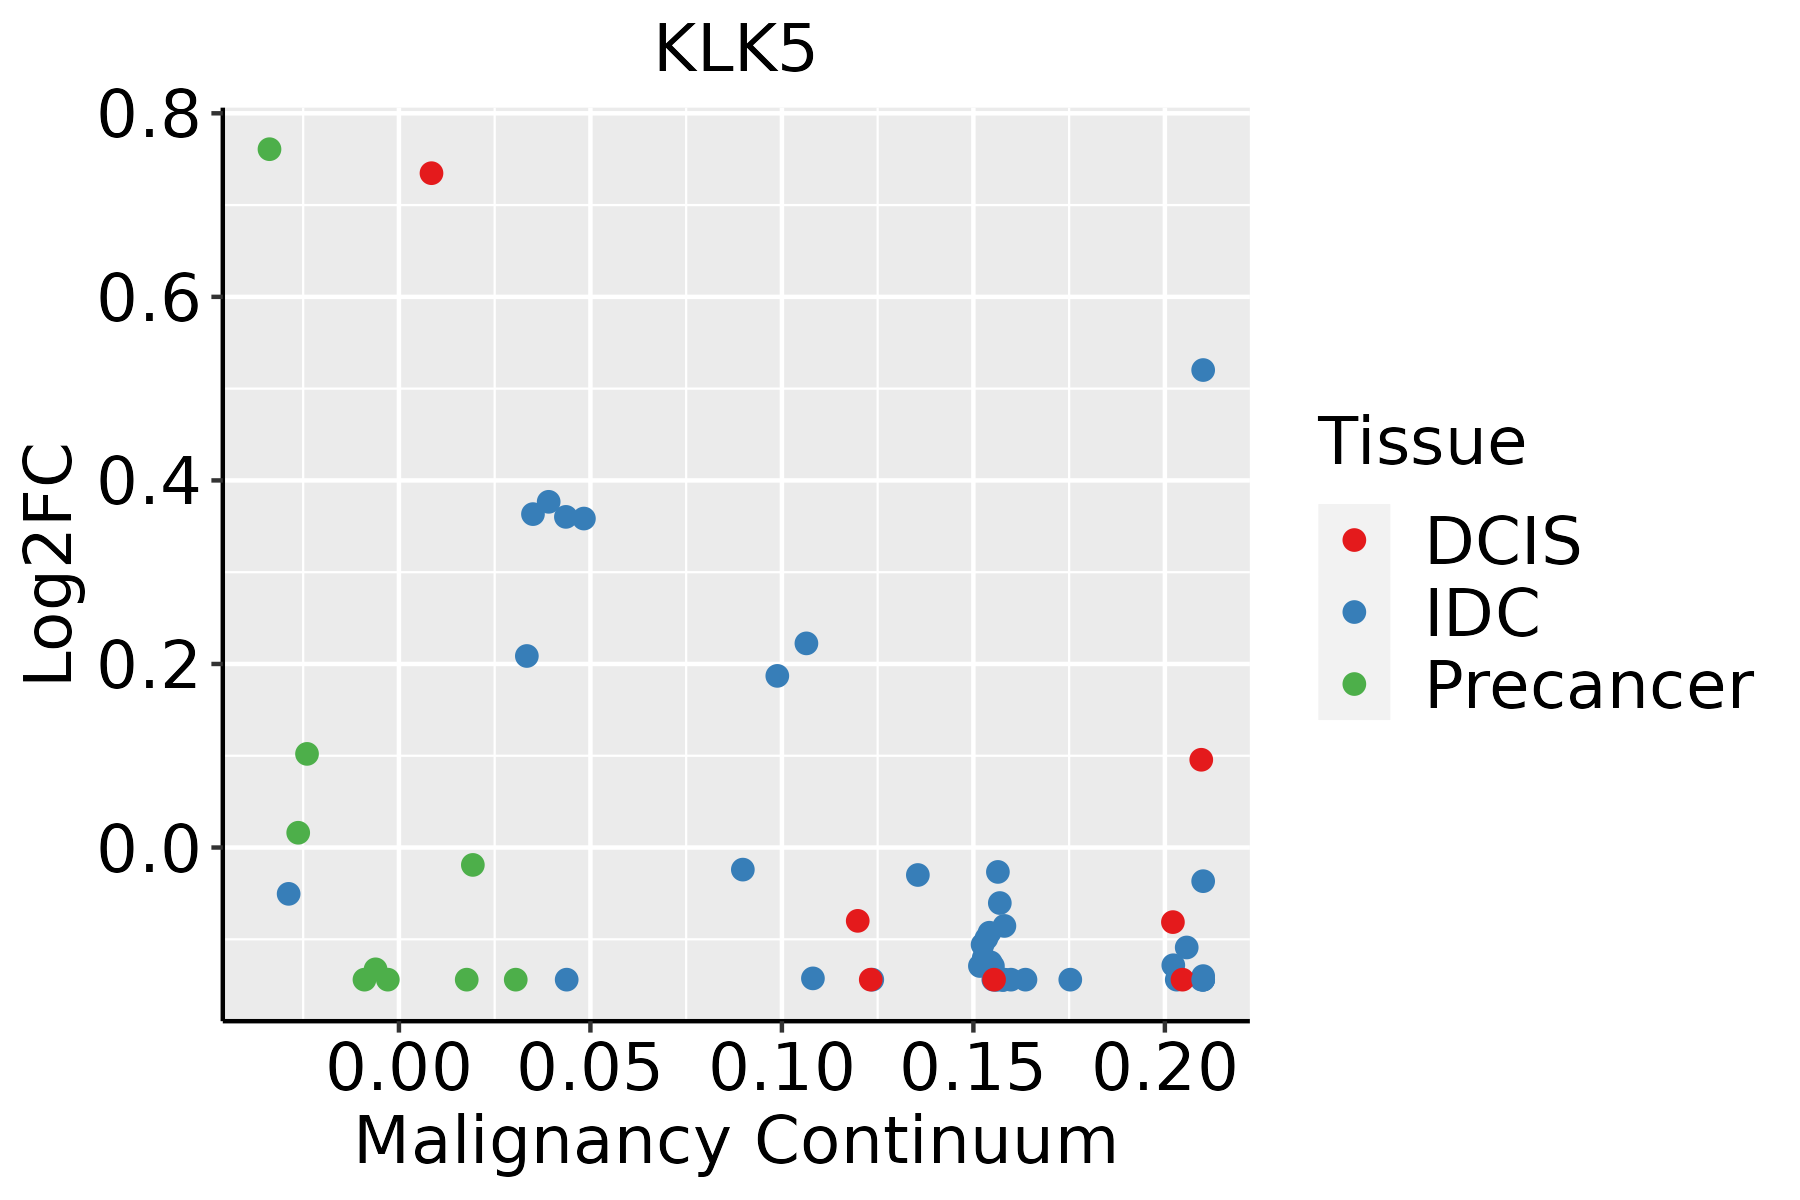 | IDC: Invasive ductal carcinoma |
| DCIS: Ductal carcinoma in situ | ||
| Precancer(BRCA1-mut): Precancerous lesion from BRCA1 mutation carriers | ||
| Esophagus | 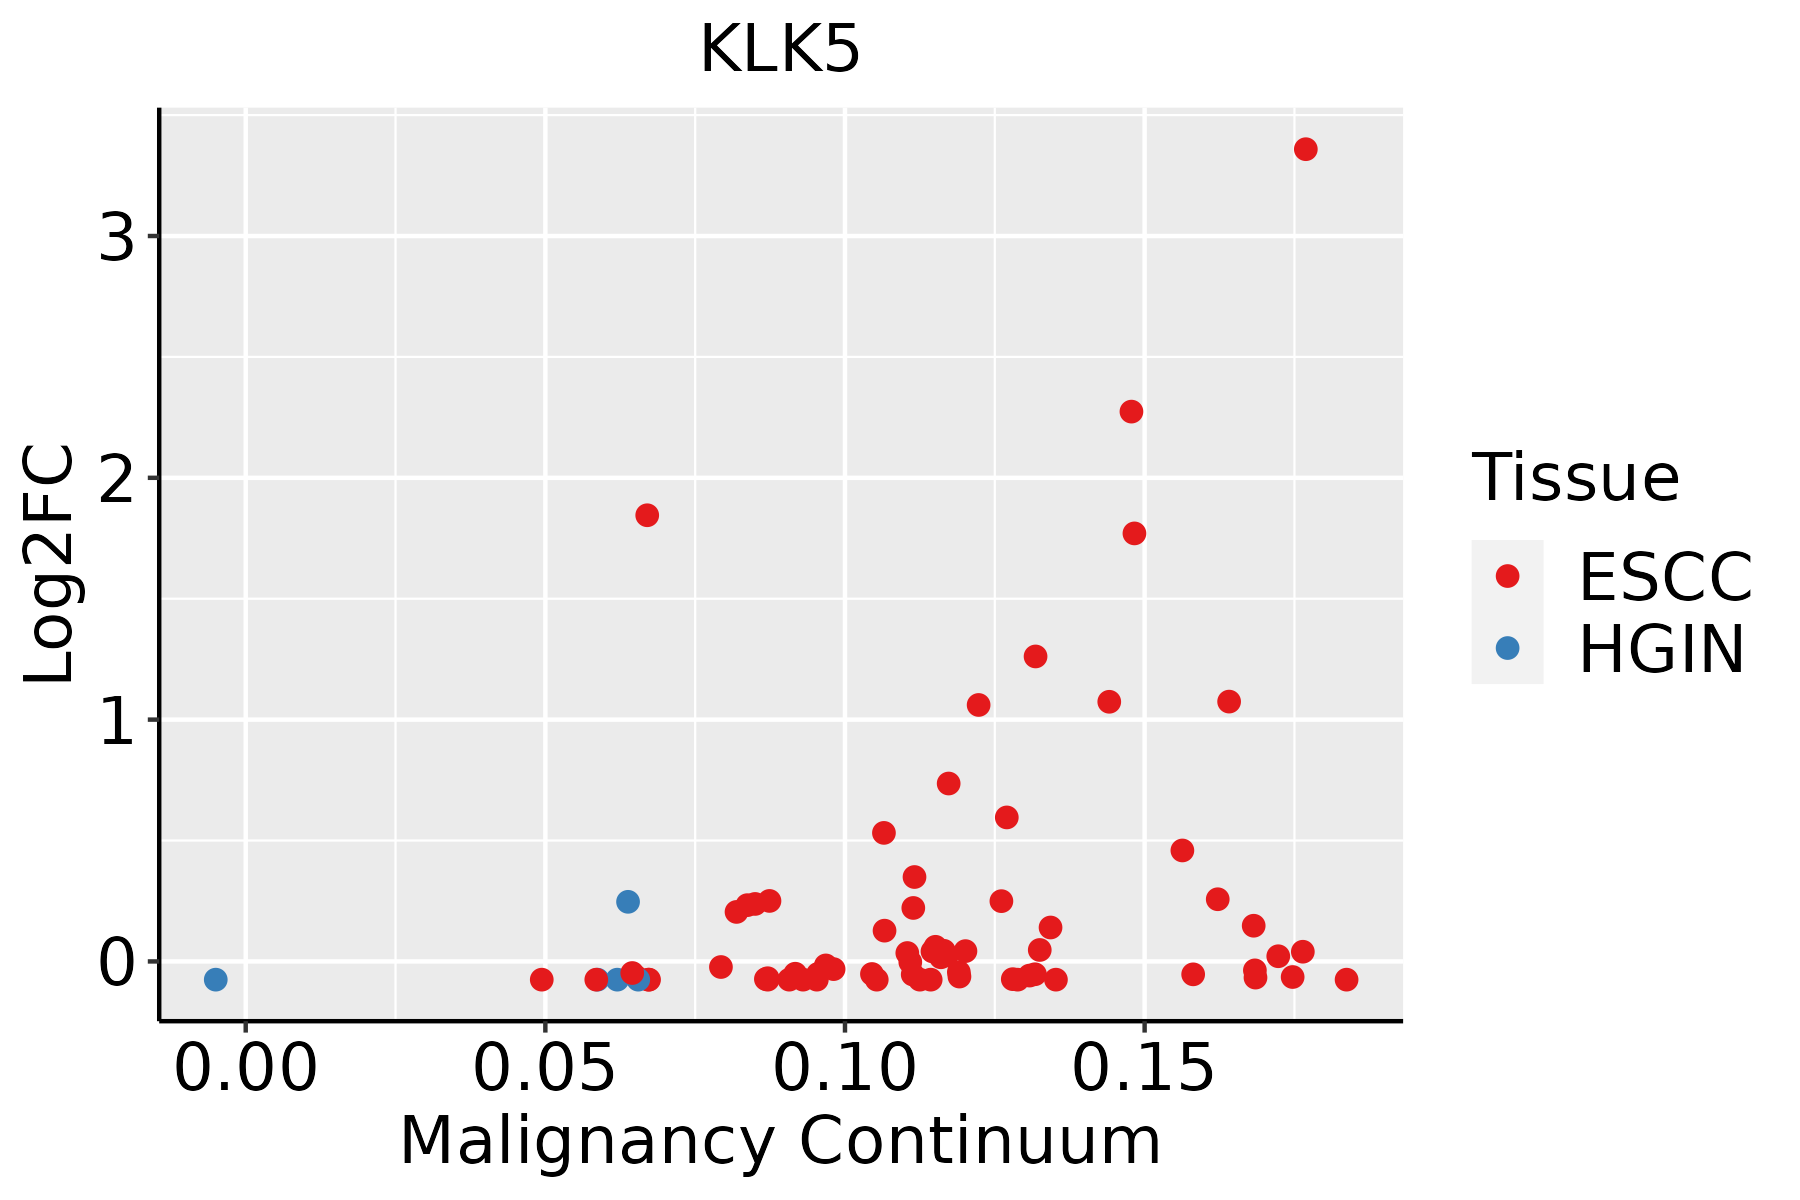 | ESCC: Esophageal squamous cell carcinoma |
| HGIN: High-grade intraepithelial neoplasias | ||
| LGIN: Low-grade intraepithelial neoplasias | ||
| Oral Cavity | 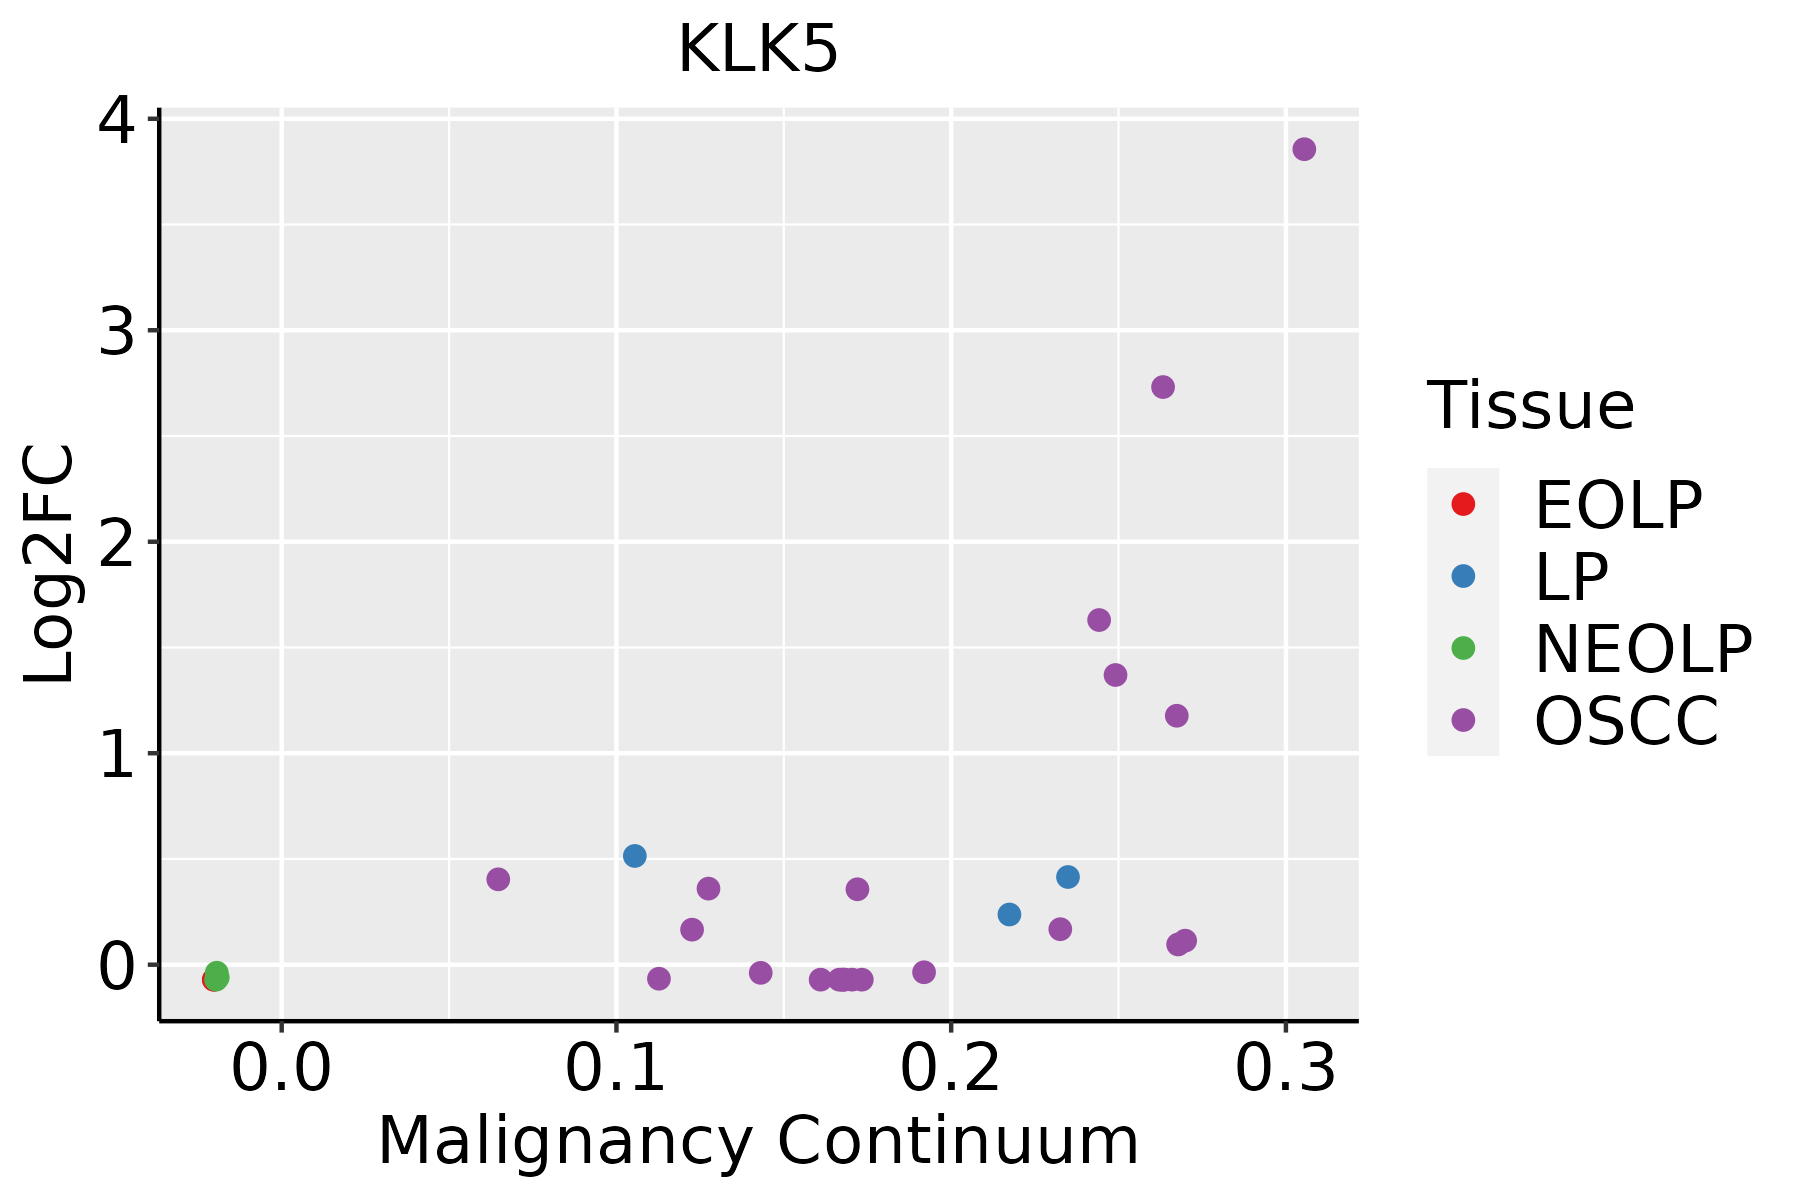 | EOLP: Erosive Oral lichen planus |
| LP: leukoplakia | ||
| NEOLP: Non-erosive oral lichen planus | ||
| OSCC: Oral squamous cell carcinoma | ||
| Skin | 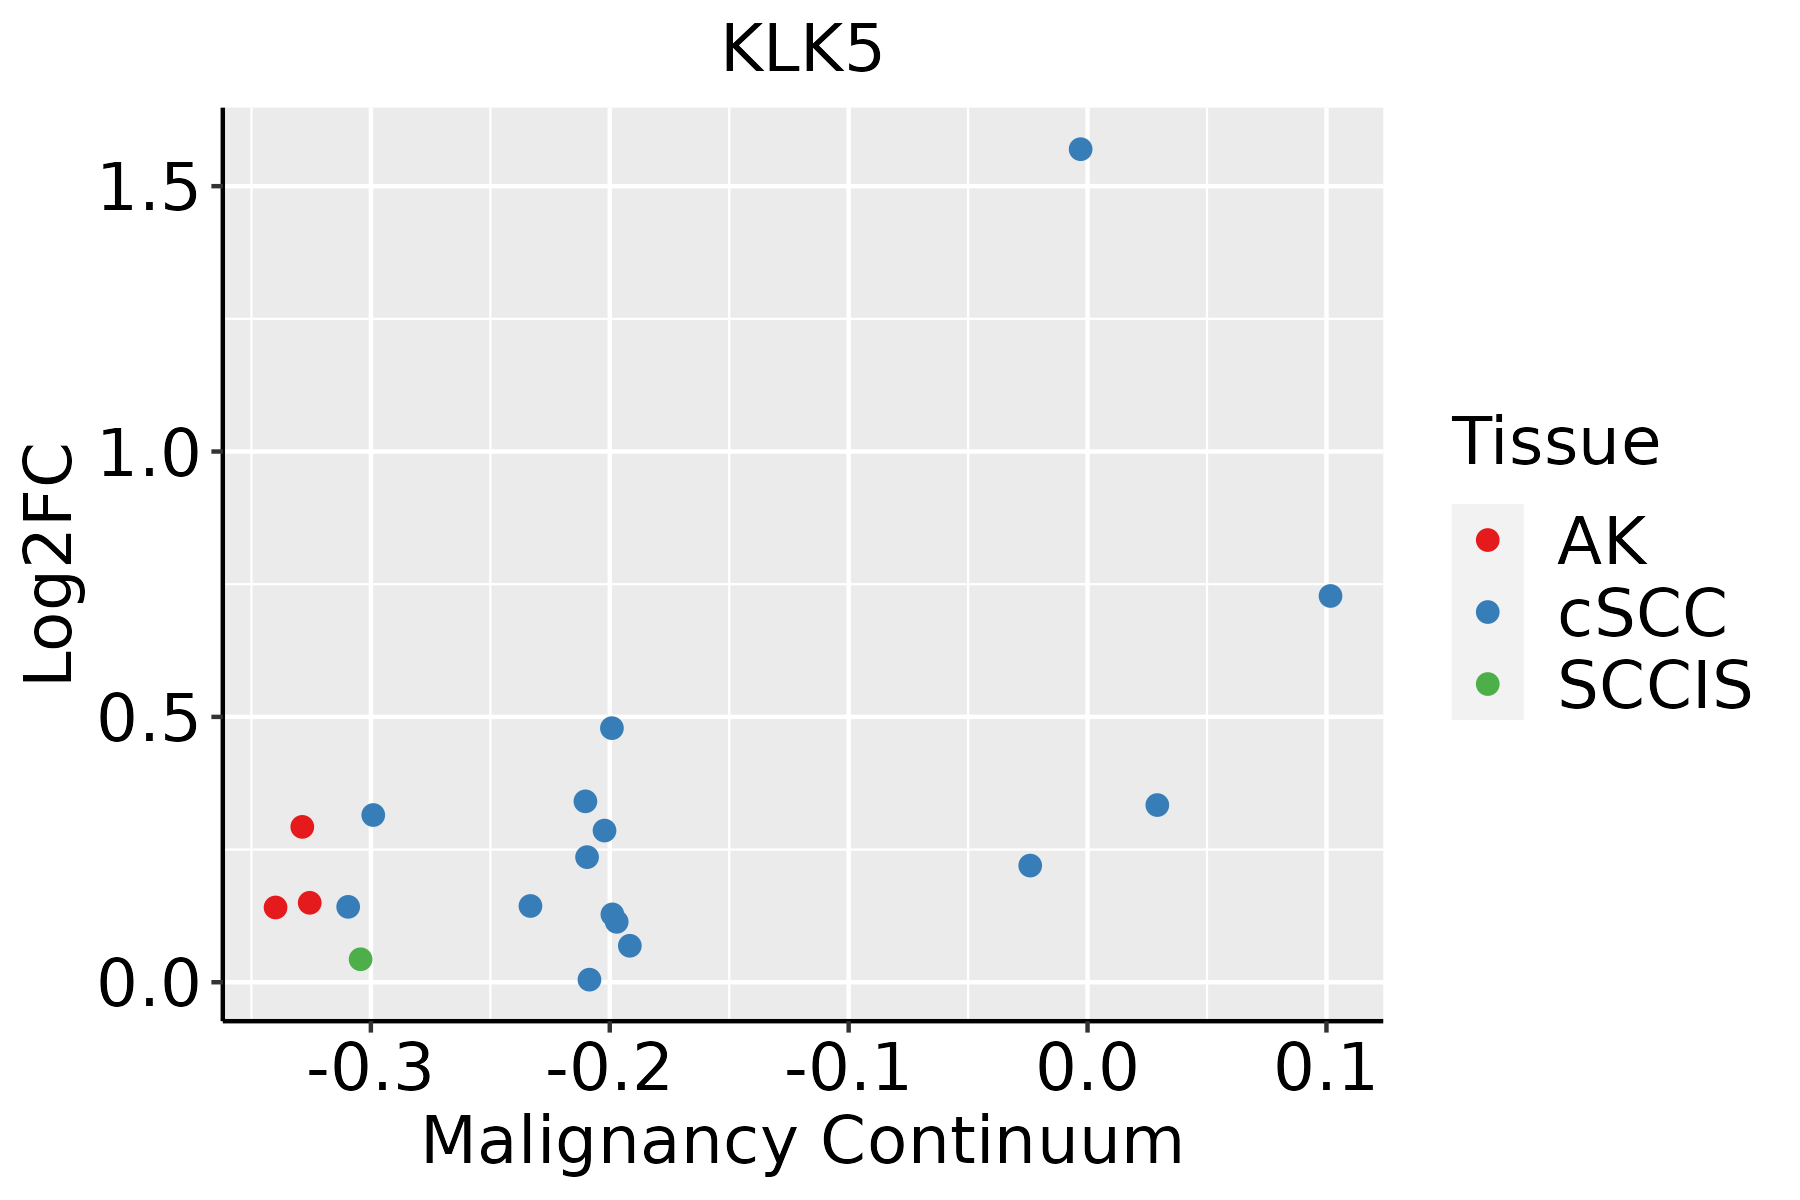 | AK: Actinic keratosis |
| cSCC: Cutaneous squamous cell carcinoma | ||
| SCCIS:squamous cell carcinoma in situ |
| ∗log2FC in expression of this searched gene in stem-like cells from each diseased tissue sample relative to stem-like cells in normal samples in each tissue plotted against the malignancy continuum. Samples are colored based on if they are from different disease stage. |
Top |
Malignant transformation related pathway analysis |
| Find out the enriched GO biological processes and KEGG pathways involved in transition from healthy to precancer to cancer |
| Tissue | Disease Stage | Enriched GO biological Processes |
| Colorectum | AD |  |
| Colorectum | SER |  |
| Colorectum | MSS |  |
| Colorectum | MSI-H |  |
| Colorectum | FAP |  |
| ∗Top 15 enriched GO BP terms are showed in the bar plot of each disease state in each tissue. Each row represents a significant GO biological process which is colored according to the -log10(p.adjust). |
| Page: 1 2 3 4 5 6 7 8 9 |
| GO ID | Tissue | Disease Stage | Description | Gene Ratio | Bg Ratio | pvalue | p.adjust | Count |
| GO:00321034 | Breast | Precancer | positive regulation of response to external stimulus | 46/1080 | 427/18723 | 3.41e-05 | 7.40e-04 | 46 |
| GO:00313493 | Breast | Precancer | positive regulation of defense response | 33/1080 | 278/18723 | 6.79e-05 | 1.36e-03 | 33 |
| GO:00197307 | Breast | Precancer | antimicrobial humoral response | 19/1080 | 122/18723 | 7.02e-05 | 1.40e-03 | 19 |
| GO:00618446 | Breast | Precancer | antimicrobial humoral immune response mediated by antimicrobial peptide | 14/1080 | 79/18723 | 1.53e-04 | 2.61e-03 | 14 |
| GO:00085445 | Breast | Precancer | epidermis development | 35/1080 | 324/18723 | 2.71e-04 | 3.96e-03 | 35 |
| GO:00224119 | Breast | Precancer | cellular component disassembly | 44/1080 | 443/18723 | 3.17e-04 | 4.51e-03 | 44 |
| GO:00099136 | Breast | Precancer | epidermal cell differentiation | 23/1080 | 202/18723 | 1.43e-03 | 1.50e-02 | 23 |
| GO:00302163 | Breast | Precancer | keratinocyte differentiation | 17/1080 | 139/18723 | 2.71e-03 | 2.39e-02 | 17 |
| GO:001973011 | Breast | IDC | antimicrobial humoral response | 23/1434 | 122/18723 | 4.67e-05 | 1.04e-03 | 23 |
| GO:00313491 | Breast | IDC | positive regulation of defense response | 39/1434 | 278/18723 | 1.74e-04 | 2.95e-03 | 39 |
| GO:003210311 | Breast | IDC | positive regulation of response to external stimulus | 54/1434 | 427/18723 | 1.85e-04 | 3.07e-03 | 54 |
| GO:006184411 | Breast | IDC | antimicrobial humoral immune response mediated by antimicrobial peptide | 16/1434 | 79/18723 | 2.75e-04 | 4.24e-03 | 16 |
| GO:000854412 | Breast | IDC | epidermis development | 41/1434 | 324/18723 | 1.03e-03 | 1.14e-02 | 41 |
| GO:00069596 | Breast | IDC | humoral immune response | 40/1434 | 317/18723 | 1.25e-03 | 1.33e-02 | 40 |
| GO:000991312 | Breast | IDC | epidermal cell differentiation | 28/1434 | 202/18723 | 1.62e-03 | 1.60e-02 | 28 |
| GO:00302161 | Breast | IDC | keratinocyte differentiation | 21/1434 | 139/18723 | 2.06e-03 | 1.95e-02 | 21 |
| GO:00435883 | Breast | IDC | skin development | 33/1434 | 263/18723 | 3.46e-03 | 2.87e-02 | 33 |
| GO:003210321 | Breast | DCIS | positive regulation of response to external stimulus | 54/1390 | 427/18723 | 8.34e-05 | 1.58e-03 | 54 |
| GO:00313492 | Breast | DCIS | positive regulation of defense response | 38/1390 | 278/18723 | 1.91e-04 | 3.08e-03 | 38 |
| GO:001973021 | Breast | DCIS | antimicrobial humoral response | 21/1390 | 122/18723 | 2.40e-04 | 3.75e-03 | 21 |
| Page: 1 2 3 4 |
| Pathway ID | Tissue | Disease Stage | Description | Gene Ratio | Bg Ratio | pvalue | p.adjust | qvalue | Count |
| Page: 1 |
Top |
Cell-cell communication analysis |
| Identification of potential cell-cell interactions between two cell types and their ligand-receptor pairs for different disease states |
| Ligand | Receptor | LRpair | Pathway | Tissue | Disease Stage |
| Page: 1 |
Top |
Single-cell gene regulatory network inference analysis |
| Find out the significant the regulons (TFs) and the target genes of each regulon across cell types for different disease states |
| TF | Cell Type | Tissue | Disease Stage | Target Gene | RSS | Regulon Activity |
| ∗The dot plots of a searched regulon are shown for all cell subpopulations in each disease state of each tissue based on the regulon specific score inferred using pySCENIC and by calculating the average expression. |
| Page: 1 |
Top |
Somatic mutation of malignant transformation related genes |
| Annotation of somatic variants for genes involved in malignant transformation |
| Hugo Symbol | Variant Class | Variant Classification | dbSNP RS | HGVSc | HGVSp | HGVSp Short | SWISSPROT | BIOTYPE | SIFT | PolyPhen | Tumor Sample Barcode | Tissue | Histology | Sex | Age | Stage | Therapy Types | Drugs | Outcome |
| KLK5 | SNV | Missense_Mutation | novel | c.229N>C | p.Thr77Pro | p.T77P | Q9Y337 | protein_coding | deleterious(0) | benign(0.313) | TCGA-A2-A0YE-01 | Breast | breast invasive carcinoma | Female | <65 | I/II | Unspecific | Taxotere | SD |
| KLK5 | SNV | Missense_Mutation | c.48N>G | p.Ile16Met | p.I16M | Q9Y337 | protein_coding | tolerated(0.12) | benign(0.025) | TCGA-AC-A23H-01 | Breast | breast invasive carcinoma | Female | >=65 | I/II | Unknown | Unknown | PD | |
| KLK5 | SNV | Missense_Mutation | rs748294116 | c.490N>T | p.Arg164Cys | p.R164C | Q9Y337 | protein_coding | tolerated(0.21) | benign(0.218) | TCGA-AN-A046-01 | Breast | breast invasive carcinoma | Female | >=65 | I/II | Unknown | Unknown | SD |
| KLK5 | SNV | Missense_Mutation | c.615N>T | p.Gln205His | p.Q205H | Q9Y337 | protein_coding | deleterious(0) | probably_damaging(0.999) | TCGA-C8-A12L-01 | Breast | breast invasive carcinoma | Female | >=65 | I/II | Unknown | Unknown | SD | |
| KLK5 | insertion | Frame_Shift_Ins | novel | c.409_410insG | p.Val137GlyfsTer16 | p.V137Gfs*16 | Q9Y337 | protein_coding | TCGA-AN-A0AK-01 | Breast | breast invasive carcinoma | Female | >=65 | I/II | Unknown | Unknown | SD | ||
| KLK5 | SNV | Missense_Mutation | novel | c.715N>T | p.Asp239Tyr | p.D239Y | Q9Y337 | protein_coding | deleterious(0) | probably_damaging(1) | TCGA-2W-A8YY-01 | Cervix | cervical & endocervical cancer | Female | <65 | I/II | Chemotherapy | cisplatin | CR |
| KLK5 | SNV | Missense_Mutation | novel | c.179N>T | p.Ser60Leu | p.S60L | Q9Y337 | protein_coding | deleterious(0.03) | benign(0.028) | TCGA-C5-A1BI-01 | Cervix | cervical & endocervical cancer | Female | <65 | III/IV | Chemotherapy | cisplatin | SD |
| KLK5 | SNV | Missense_Mutation | c.529N>G | p.His177Asp | p.H177D | Q9Y337 | protein_coding | tolerated(0.5) | benign(0) | TCGA-IR-A3LK-01 | Cervix | cervical & endocervical cancer | Female | >=65 | I/II | Chemotherapy | cisplatin | PD | |
| KLK5 | SNV | Missense_Mutation | novel | c.800N>T | p.Ala267Val | p.A267V | Q9Y337 | protein_coding | deleterious(0) | benign(0.131) | TCGA-A6-2672-01 | Colorectum | colon adenocarcinoma | Female | >=65 | III/IV | Unknown | Unknown | SD |
| KLK5 | SNV | Missense_Mutation | c.610C>A | p.Leu204Ile | p.L204I | Q9Y337 | protein_coding | deleterious(0) | probably_damaging(0.916) | TCGA-AA-3977-01 | Colorectum | colon adenocarcinoma | Male | >=65 | I/II | Unknown | Unknown | SD |
| Page: 1 2 3 4 5 |
Top |
Related drugs of malignant transformation related genes |
| Identification of chemicals and drugs interact with genes involved in malignant transfromation |
| (DGIdb 4.0) |
| Entrez ID | Symbol | Category | Interaction Types | Drug Claim Name | Drug Name | PMIDs |
| 25818 | KLK5 | PROTEASE, DRUGGABLE GENOME, ENZYME | inhibitor | 252166696 | ||
| 25818 | KLK5 | PROTEASE, DRUGGABLE GENOME, ENZYME | inhibitor | 252166691 |
| Page: 1 |

Copyright 2023-Present -The University of Texas Health Science Center at Houston |