
|
|||||
|
 | |
| |
| |
| |
| |
| |
|
Gene: KLK2 |
Gene summary for KLK2 |
| Gene information | Species | Human | Gene symbol | KLK2 | Gene ID | 3817 |
| Gene name | kallikrein related peptidase 2 | |
| Gene Alias | KLK2A2 | |
| Cytomap | 19q13.33 | |
| Gene Type | protein-coding | GO ID | GO:0003008 | UniProtAcc | A0A024R4N3 |
Top |
Malignant transformation analysis |
| Identification of the aberrant gene expression in precancerous and cancerous lesions by comparing the gene expression of stem-like cells in diseased tissues with normal stem cells |
| Entrez ID | Symbol | Replicates | Species | Organ | Tissue | Adj P-value | Log2FC | Malignancy |
| 3817 | KLK2 | GSM5252134_BPH511PrG_Fcol_3GEX | Human | Prostate | BPH | 2.09e-04 | 8.92e-01 | -0.1433 |
| 3817 | KLK2 | 047563_1562-all-cells | Human | Prostate | BPH | 3.17e-18 | 7.23e-01 | 0.0791 |
| 3817 | KLK2 | 048752_1579-all-cells | Human | Prostate | BPH | 1.71e-81 | 1.03e+00 | 0.1008 |
| 3817 | KLK2 | 052097_1595-all-cells | Human | Prostate | BPH | 7.90e-21 | 5.00e-01 | 0.0972 |
| 3817 | KLK2 | 052099_1652-all-cells | Human | Prostate | BPH | 8.65e-41 | 7.52e-01 | 0.1038 |
| 3817 | KLK2 | Dong_P1 | Human | Prostate | Tumor | 4.60e-03 | 9.90e-02 | 0.035 |
| 3817 | KLK2 | Dong_P4 | Human | Prostate | Tumor | 1.99e-11 | 4.77e-01 | 0.0292 |
| 3817 | KLK2 | P7 | Human | Prostate | Tumor | 2.88e-09 | 9.89e-01 | -0.1025 |
| 3817 | KLK2 | P10 | Human | Prostate | Tumor | 4.92e-19 | 1.15e+00 | -0.0902 |
| 3817 | KLK2 | GSM5353224_PA_PR5186_Pool_1_2_3_S27_L001 | Human | Prostate | Tumor | 3.07e-07 | 6.35e-01 | 0.1621 |
| Page: 1 |
| Tissue | Expression Dynamics | Abbreviation |
| Prostate | 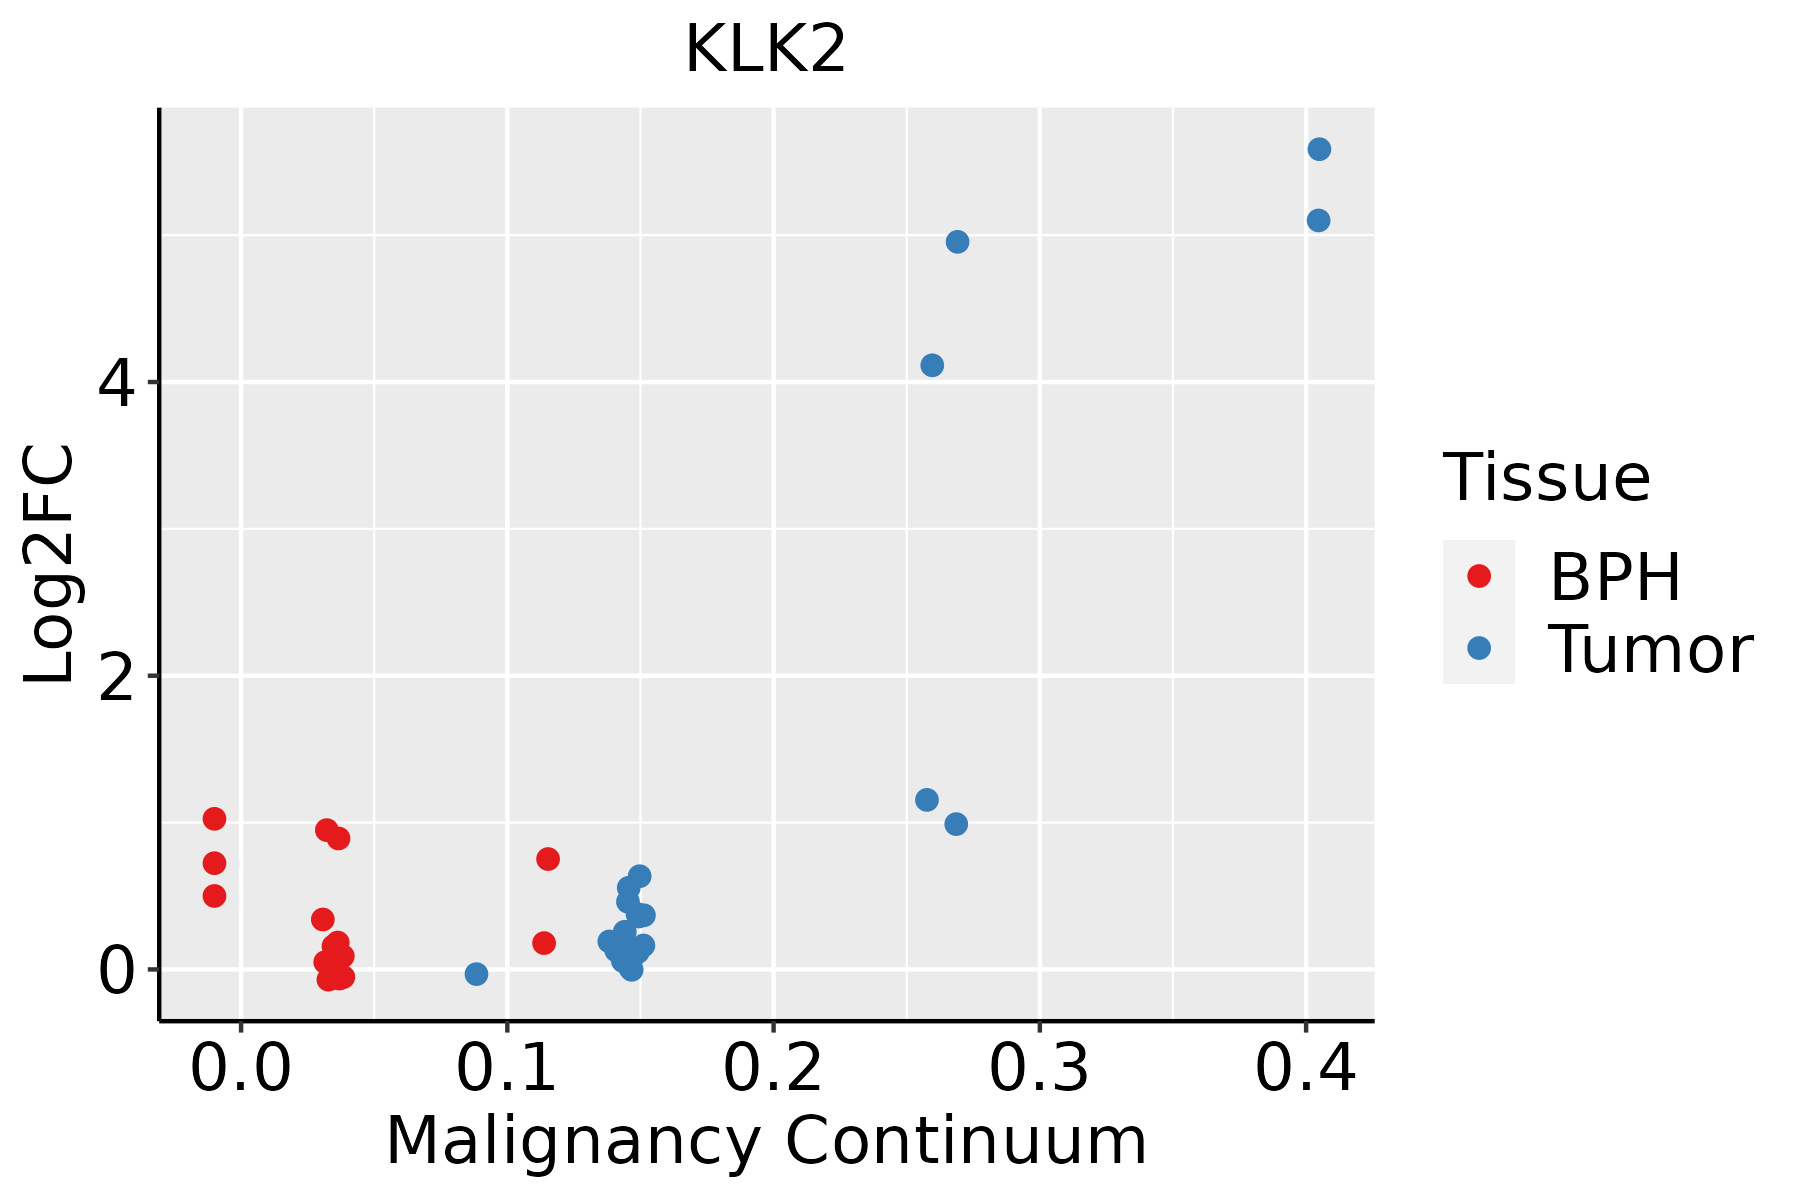 | BPH: Benign Prostatic Hyperplasia |
| ∗log2FC in expression of this searched gene in stem-like cells from each diseased tissue sample relative to stem-like cells in normal samples in each tissue plotted against the malignancy continuum. Samples are colored based on if they are from different disease stage. |
Top |
Malignant transformation related pathway analysis |
| Find out the enriched GO biological processes and KEGG pathways involved in transition from healthy to precancer to cancer |
| Tissue | Disease Stage | Enriched GO biological Processes |
| Colorectum | AD |  |
| Colorectum | SER |  |
| Colorectum | MSS |  |
| Colorectum | MSI-H |  |
| Colorectum | FAP |  |
| ∗Top 15 enriched GO BP terms are showed in the bar plot of each disease state in each tissue. Each row represents a significant GO biological process which is colored according to the -log10(p.adjust). |
| Page: 1 2 3 4 5 6 7 8 9 |
| GO ID | Tissue | Disease Stage | Description | Gene Ratio | Bg Ratio | pvalue | p.adjust | Count |
| GO:00516049 | Prostate | BPH | protein maturation | 80/3107 | 294/18723 | 2.64e-06 | 4.23e-05 | 80 |
| GO:00164855 | Prostate | BPH | protein processing | 62/3107 | 225/18723 | 2.22e-05 | 2.67e-04 | 62 |
| GO:005160415 | Prostate | Tumor | protein maturation | 81/3246 | 294/18723 | 7.58e-06 | 1.13e-04 | 81 |
| GO:001648512 | Prostate | Tumor | protein processing | 63/3246 | 225/18723 | 4.40e-05 | 4.98e-04 | 63 |
| Page: 1 |
| Pathway ID | Tissue | Disease Stage | Description | Gene Ratio | Bg Ratio | pvalue | p.adjust | qvalue | Count |
| hsa0496112 | Prostate | BPH | Endocrine and other factor-regulated calcium reabsorption | 18/1718 | 53/8465 | 1.39e-02 | 4.05e-02 | 2.51e-02 | 18 |
| hsa0496113 | Prostate | BPH | Endocrine and other factor-regulated calcium reabsorption | 18/1718 | 53/8465 | 1.39e-02 | 4.05e-02 | 2.51e-02 | 18 |
| Page: 1 |
Top |
Cell-cell communication analysis |
| Identification of potential cell-cell interactions between two cell types and their ligand-receptor pairs for different disease states |
| Ligand | Receptor | LRpair | Pathway | Tissue | Disease Stage |
| Page: 1 |
Top |
Single-cell gene regulatory network inference analysis |
| Find out the significant the regulons (TFs) and the target genes of each regulon across cell types for different disease states |
| TF | Cell Type | Tissue | Disease Stage | Target Gene | RSS | Regulon Activity |
| ∗The dot plots of a searched regulon are shown for all cell subpopulations in each disease state of each tissue based on the regulon specific score inferred using pySCENIC and by calculating the average expression. |
| Page: 1 |
Top |
Somatic mutation of malignant transformation related genes |
| Annotation of somatic variants for genes involved in malignant transformation |
| Hugo Symbol | Variant Class | Variant Classification | dbSNP RS | HGVSc | HGVSp | HGVSp Short | SWISSPROT | BIOTYPE | SIFT | PolyPhen | Tumor Sample Barcode | Tissue | Histology | Sex | Age | Stage | Therapy Types | Drugs | Outcome |
| KLK2 | SNV | Missense_Mutation | c.719N>T | p.Pro240Leu | p.P240L | P20151 | protein_coding | deleterious(0) | probably_damaging(0.995) | TCGA-A8-A097-01 | Breast | breast invasive carcinoma | Female | >=65 | I/II | Hormone Therapy | tamoxiphen | SD | |
| KLK2 | SNV | Missense_Mutation | novel | c.335N>A | p.Arg112Lys | p.R112K | P20151 | protein_coding | tolerated(0.94) | benign(0.003) | TCGA-AN-A046-01 | Breast | breast invasive carcinoma | Female | >=65 | I/II | Unknown | Unknown | SD |
| KLK2 | SNV | Missense_Mutation | c.454N>C | p.Cys152Arg | p.C152R | P20151 | protein_coding | deleterious(0) | probably_damaging(1) | TCGA-D8-A27N-01 | Breast | breast invasive carcinoma | Female | <65 | III/IV | Chemotherapy | taxol+adriamycin+cyclophosphamide+herceptin | SD | |
| KLK2 | SNV | Missense_Mutation | rs572630957 | c.460N>A | p.Ala154Thr | p.A154T | P20151 | protein_coding | tolerated(0.21) | benign(0.165) | TCGA-W8-A86G-01 | Breast | breast invasive carcinoma | Female | >=65 | I/II | Hormone Therapy | arimidex | SD |
| KLK2 | SNV | Missense_Mutation | rs371591640 | c.481N>A | p.Glu161Lys | p.E161K | P20151 | protein_coding | tolerated(0.57) | benign(0.006) | TCGA-C5-A1BQ-01 | Cervix | cervical & endocervical cancer | Female | >=65 | III/IV | Chemotherapy | cisplatin | CR |
| KLK2 | SNV | Missense_Mutation | rs371591640 | c.481N>A | p.Glu161Lys | p.E161K | P20151 | protein_coding | tolerated(0.57) | benign(0.006) | TCGA-C5-A3HL-01 | Cervix | cervical & endocervical cancer | Female | >=65 | I/II | Unknown | Unknown | SD |
| KLK2 | SNV | Missense_Mutation | rs536878458 | c.619N>A | p.Asp207Asn | p.D207N | P20151 | protein_coding | deleterious(0.04) | possibly_damaging(0.476) | TCGA-EK-A2RN-01 | Cervix | cervical & endocervical cancer | Female | <65 | I/II | Unknown | Unknown | SD |
| KLK2 | SNV | Missense_Mutation | novel | c.79G>A | p.Gly27Arg | p.G27R | P20151 | protein_coding | deleterious(0.04) | probably_damaging(0.993) | TCGA-G4-6627-01 | Colorectum | colon adenocarcinoma | Male | >=65 | I/II | Unknown | Unknown | PD |
| KLK2 | SNV | Missense_Mutation | c.608C>T | p.Thr203Ile | p.T203I | P20151 | protein_coding | deleterious(0.01) | benign(0.092) | TCGA-A5-A0VP-01 | Endometrium | uterine corpus endometrioid carcinoma | Female | >=65 | I/II | Unknown | Unknown | SD | |
| KLK2 | SNV | Missense_Mutation | novel | c.506N>T | p.Arg169Met | p.R169M | P20151 | protein_coding | deleterious(0.03) | benign(0.375) | TCGA-A5-A1OF-01 | Endometrium | uterine corpus endometrioid carcinoma | Female | <65 | I/II | Unknown | Unknown | SD |
| Page: 1 2 3 4 |
Top |
Related drugs of malignant transformation related genes |
| Identification of chemicals and drugs interact with genes involved in malignant transfromation |
| (DGIdb 4.0) |
| Entrez ID | Symbol | Category | Interaction Types | Drug Claim Name | Drug Name | PMIDs |
| 3817 | KLK2 | PROTEASE, DRUGGABLE GENOME, ENZYME, CLINICALLY ACTIONABLE | inhibitor | 252166692 | ||
| 3817 | KLK2 | PROTEASE, DRUGGABLE GENOME, ENZYME, CLINICALLY ACTIONABLE | inhibitor | 252166872 | ||
| 3817 | KLK2 | PROTEASE, DRUGGABLE GENOME, ENZYME, CLINICALLY ACTIONABLE | Avoralstat | AVORALSTAT |
| Page: 1 |

Copyright 2023-Present -The University of Texas Health Science Center at Houston |