
|
|||||
|
 | |
| |
| |
| |
| |
| |
|
Gene: KLK11 |
Gene summary for KLK11 |
| Gene information | Species | Human | Gene symbol | KLK11 | Gene ID | 11012 |
| Gene name | kallikrein related peptidase 11 | |
| Gene Alias | PRSS20 | |
| Cytomap | 19q13.41 | |
| Gene Type | protein-coding | GO ID | GO:0006508 | UniProtAcc | A0A1R3UDR5 |
Top |
Malignant transformation analysis |
| Identification of the aberrant gene expression in precancerous and cancerous lesions by comparing the gene expression of stem-like cells in diseased tissues with normal stem cells |
| Entrez ID | Symbol | Replicates | Species | Organ | Tissue | Adj P-value | Log2FC | Malignancy |
| 11012 | KLK11 | GSM4909281 | Human | Breast | IDC | 8.33e-40 | 8.50e-01 | 0.21 |
| 11012 | KLK11 | GSM4909286 | Human | Breast | IDC | 1.98e-45 | 7.29e-01 | 0.1081 |
| 11012 | KLK11 | GSM4909287 | Human | Breast | IDC | 5.00e-02 | -6.75e-02 | 0.2057 |
| 11012 | KLK11 | GSM4909293 | Human | Breast | IDC | 7.06e-63 | 1.03e+00 | 0.1581 |
| 11012 | KLK11 | GSM4909315 | Human | Breast | IDC | 4.19e-12 | 5.06e-01 | 0.21 |
| 11012 | KLK11 | GSM4909316 | Human | Breast | IDC | 2.40e-23 | 1.18e+00 | 0.21 |
| 11012 | KLK11 | LZE2D | Human | Esophagus | HGIN | 1.54e-03 | 7.58e-01 | 0.0642 |
| 11012 | KLK11 | LZE5T | Human | Esophagus | ESCC | 3.28e-18 | 1.91e+00 | 0.0514 |
| 11012 | KLK11 | LZE8T | Human | Esophagus | ESCC | 2.33e-04 | 2.27e-01 | 0.067 |
| 11012 | KLK11 | LZE22D1 | Human | Esophagus | HGIN | 1.08e-05 | 4.59e-01 | 0.0595 |
| 11012 | KLK11 | LZE22T | Human | Esophagus | ESCC | 2.44e-07 | 1.10e+00 | 0.068 |
| 11012 | KLK11 | LZE24T | Human | Esophagus | ESCC | 7.96e-51 | 2.62e+00 | 0.0596 |
| 11012 | KLK11 | LZE21T | Human | Esophagus | ESCC | 2.02e-09 | 1.06e+00 | 0.0655 |
| 11012 | KLK11 | P2T-E | Human | Esophagus | ESCC | 2.59e-02 | 1.33e-01 | 0.1177 |
| 11012 | KLK11 | P4T-E | Human | Esophagus | ESCC | 5.68e-19 | 6.15e-01 | 0.1323 |
| 11012 | KLK11 | P5T-E | Human | Esophagus | ESCC | 2.00e-02 | -4.38e-02 | 0.1327 |
| 11012 | KLK11 | P8T-E | Human | Esophagus | ESCC | 1.50e-119 | 3.77e+00 | 0.0889 |
| 11012 | KLK11 | P9T-E | Human | Esophagus | ESCC | 1.12e-19 | 5.13e-01 | 0.1131 |
| 11012 | KLK11 | P10T-E | Human | Esophagus | ESCC | 3.10e-02 | 1.97e-01 | 0.116 |
| 11012 | KLK11 | P15T-E | Human | Esophagus | ESCC | 4.94e-15 | 6.32e-01 | 0.1149 |
| Page: 1 2 3 4 5 |
| Tissue | Expression Dynamics | Abbreviation |
| Breast | 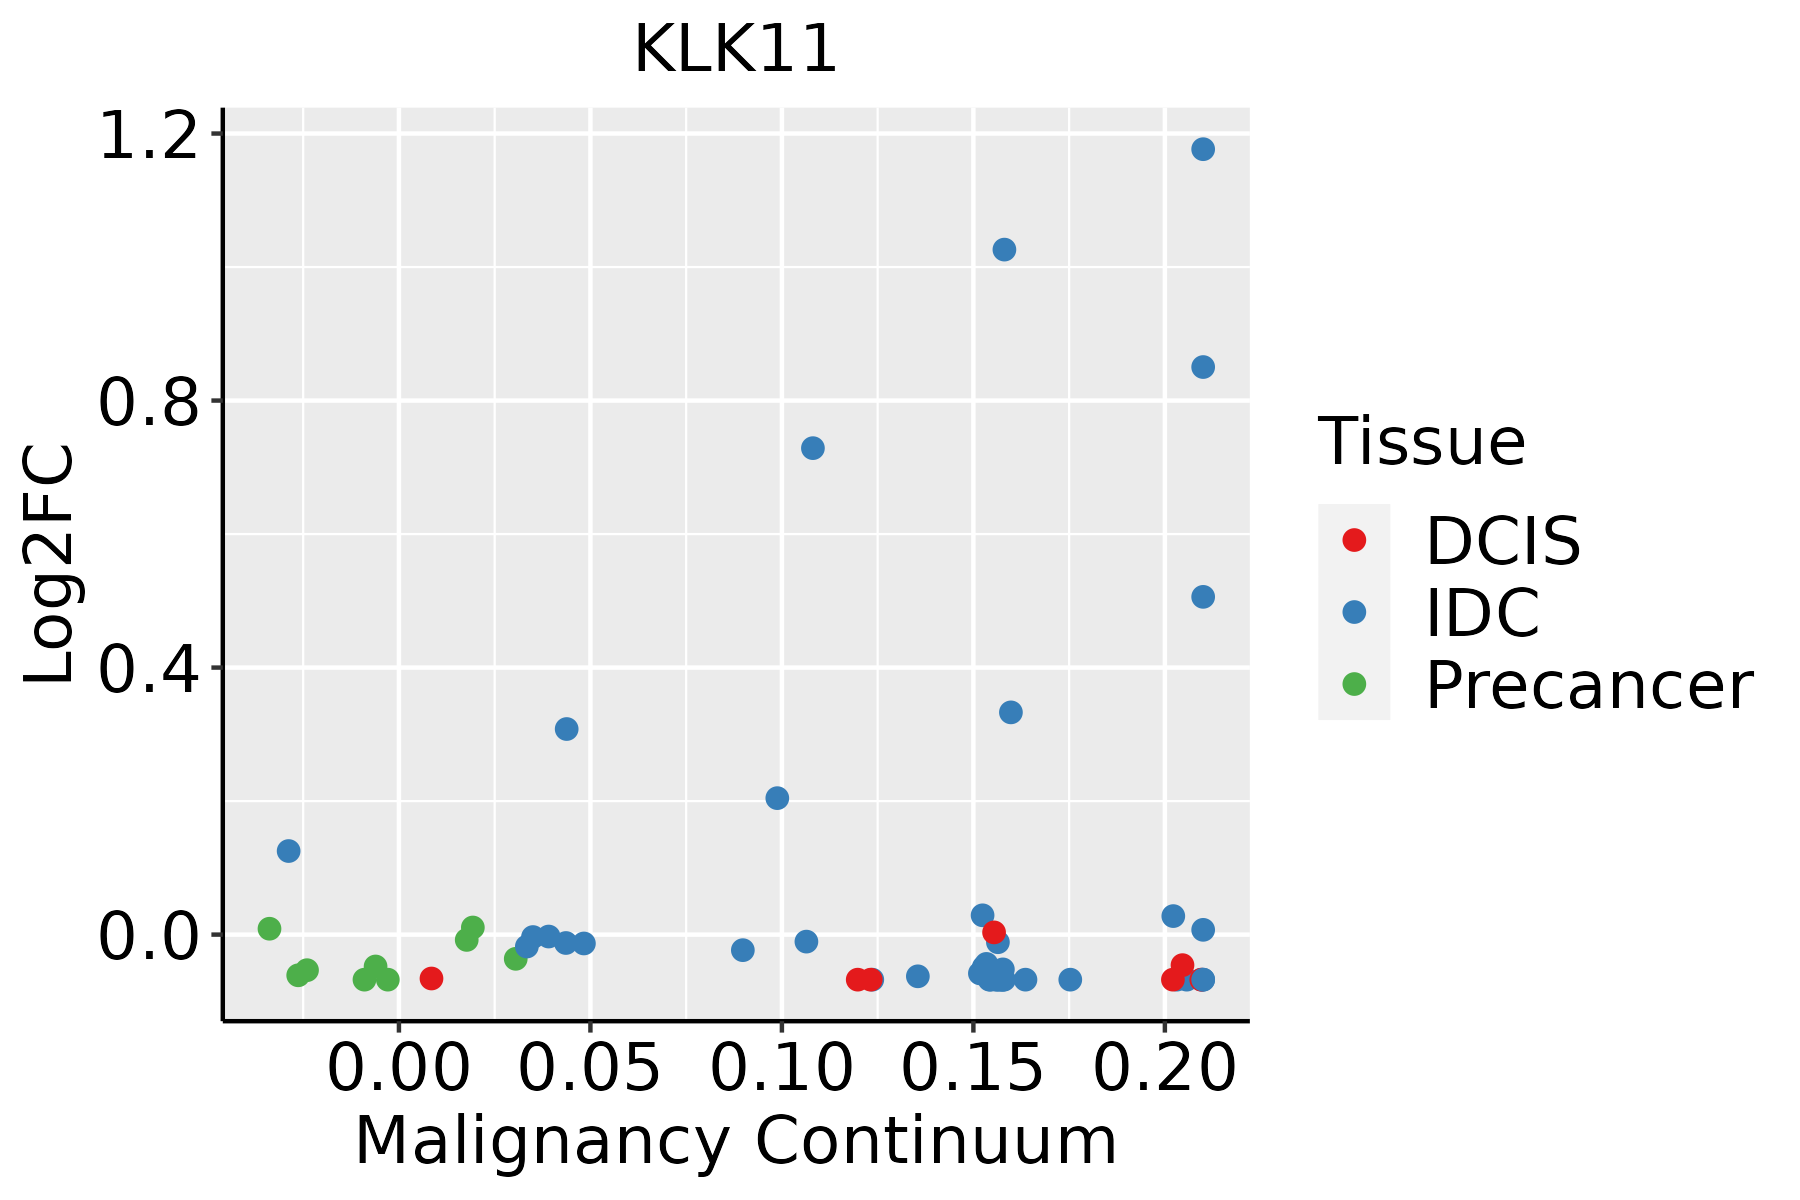 | IDC: Invasive ductal carcinoma |
| DCIS: Ductal carcinoma in situ | ||
| Precancer(BRCA1-mut): Precancerous lesion from BRCA1 mutation carriers | ||
| Esophagus | 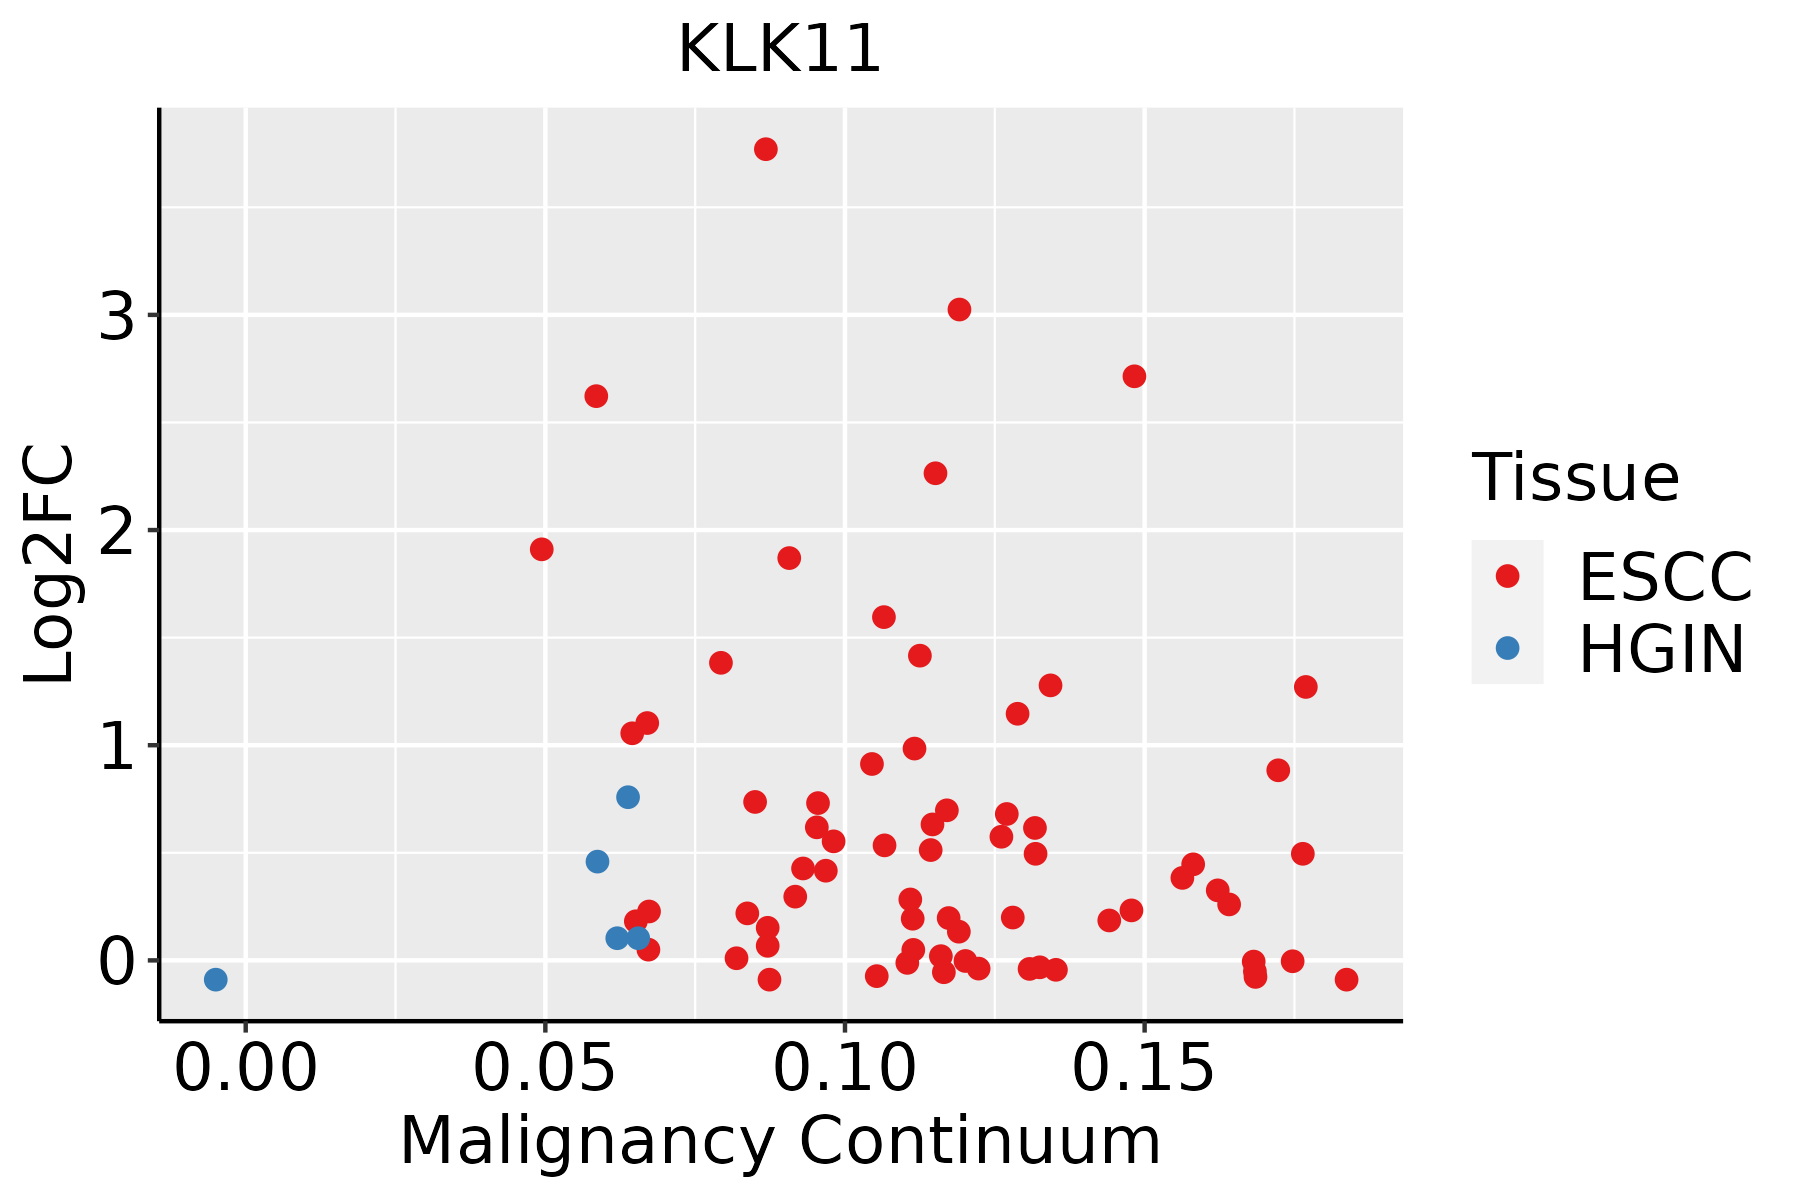 | ESCC: Esophageal squamous cell carcinoma |
| HGIN: High-grade intraepithelial neoplasias | ||
| LGIN: Low-grade intraepithelial neoplasias | ||
| Liver | 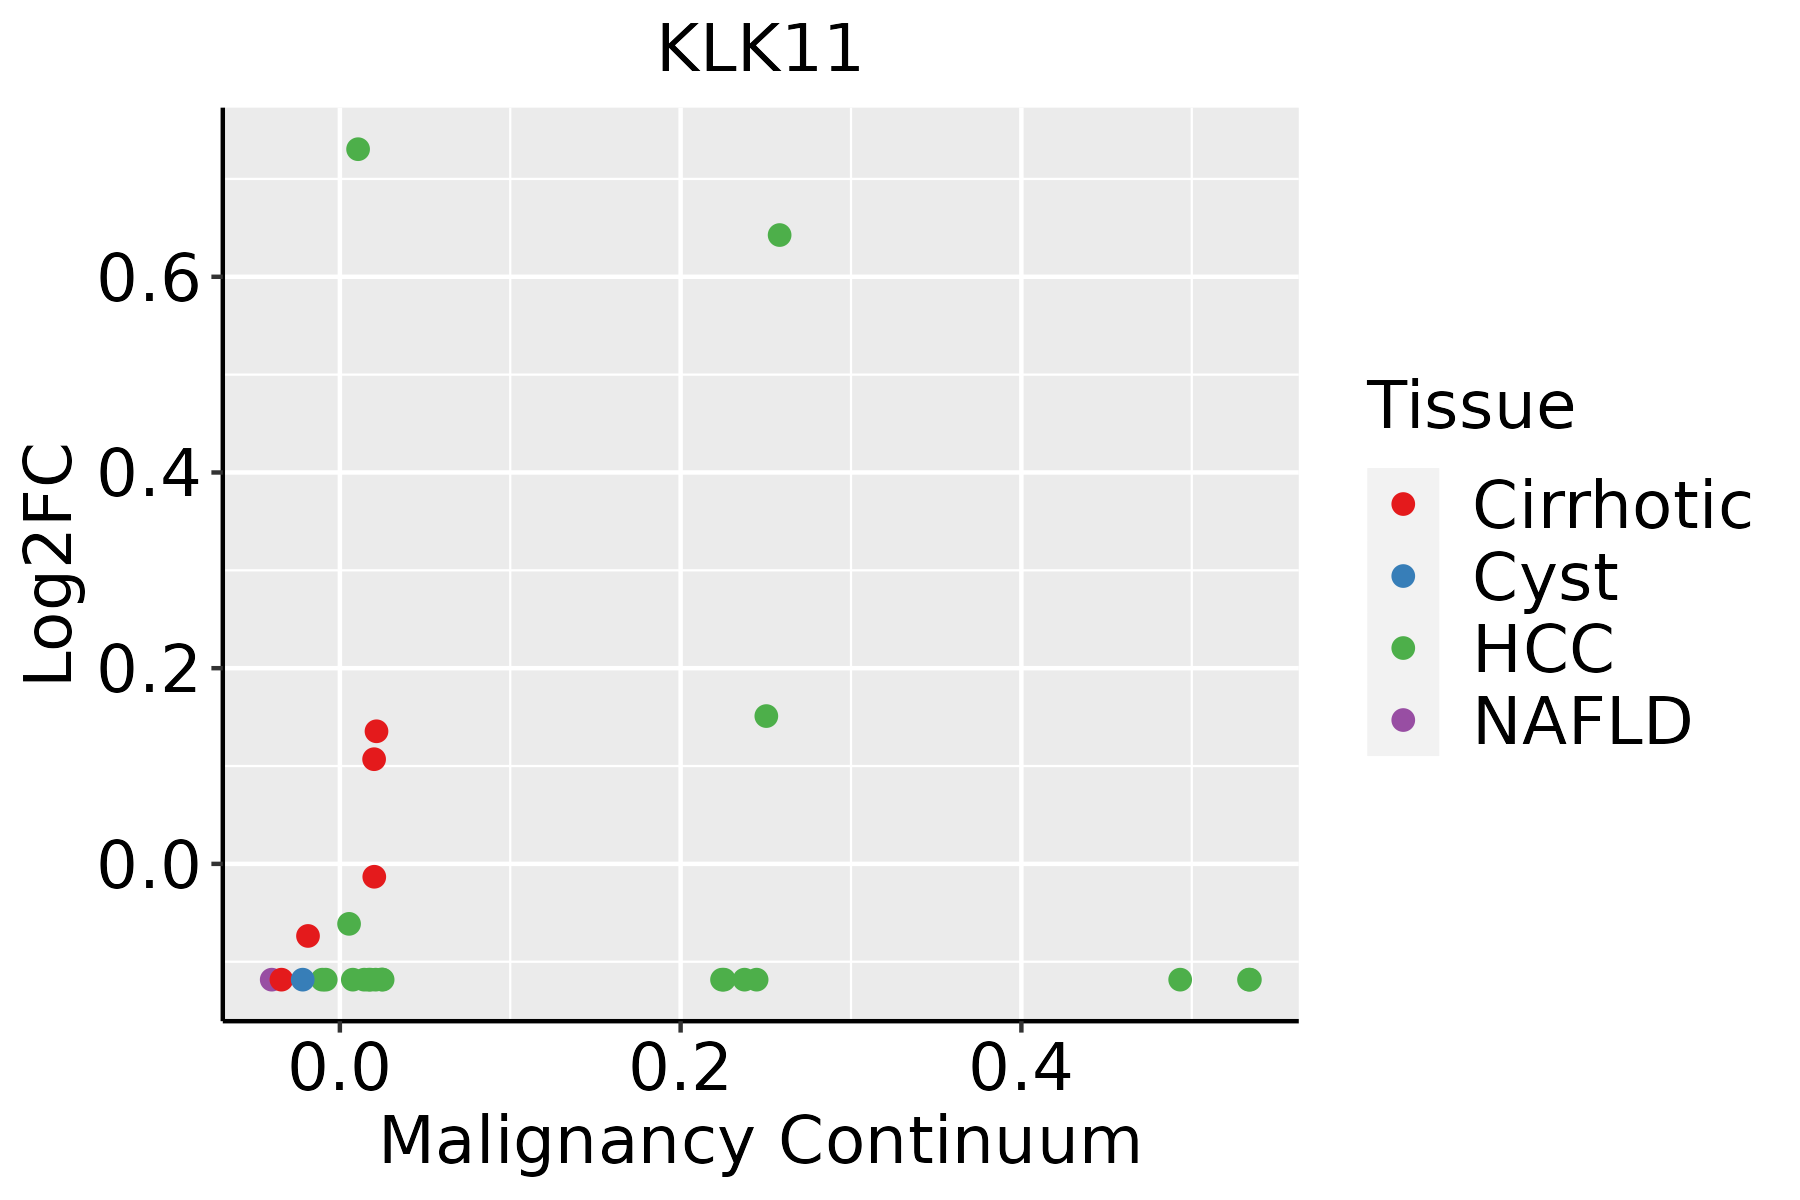 | HCC: Hepatocellular carcinoma |
| NAFLD: Non-alcoholic fatty liver disease | ||
| Oral Cavity | 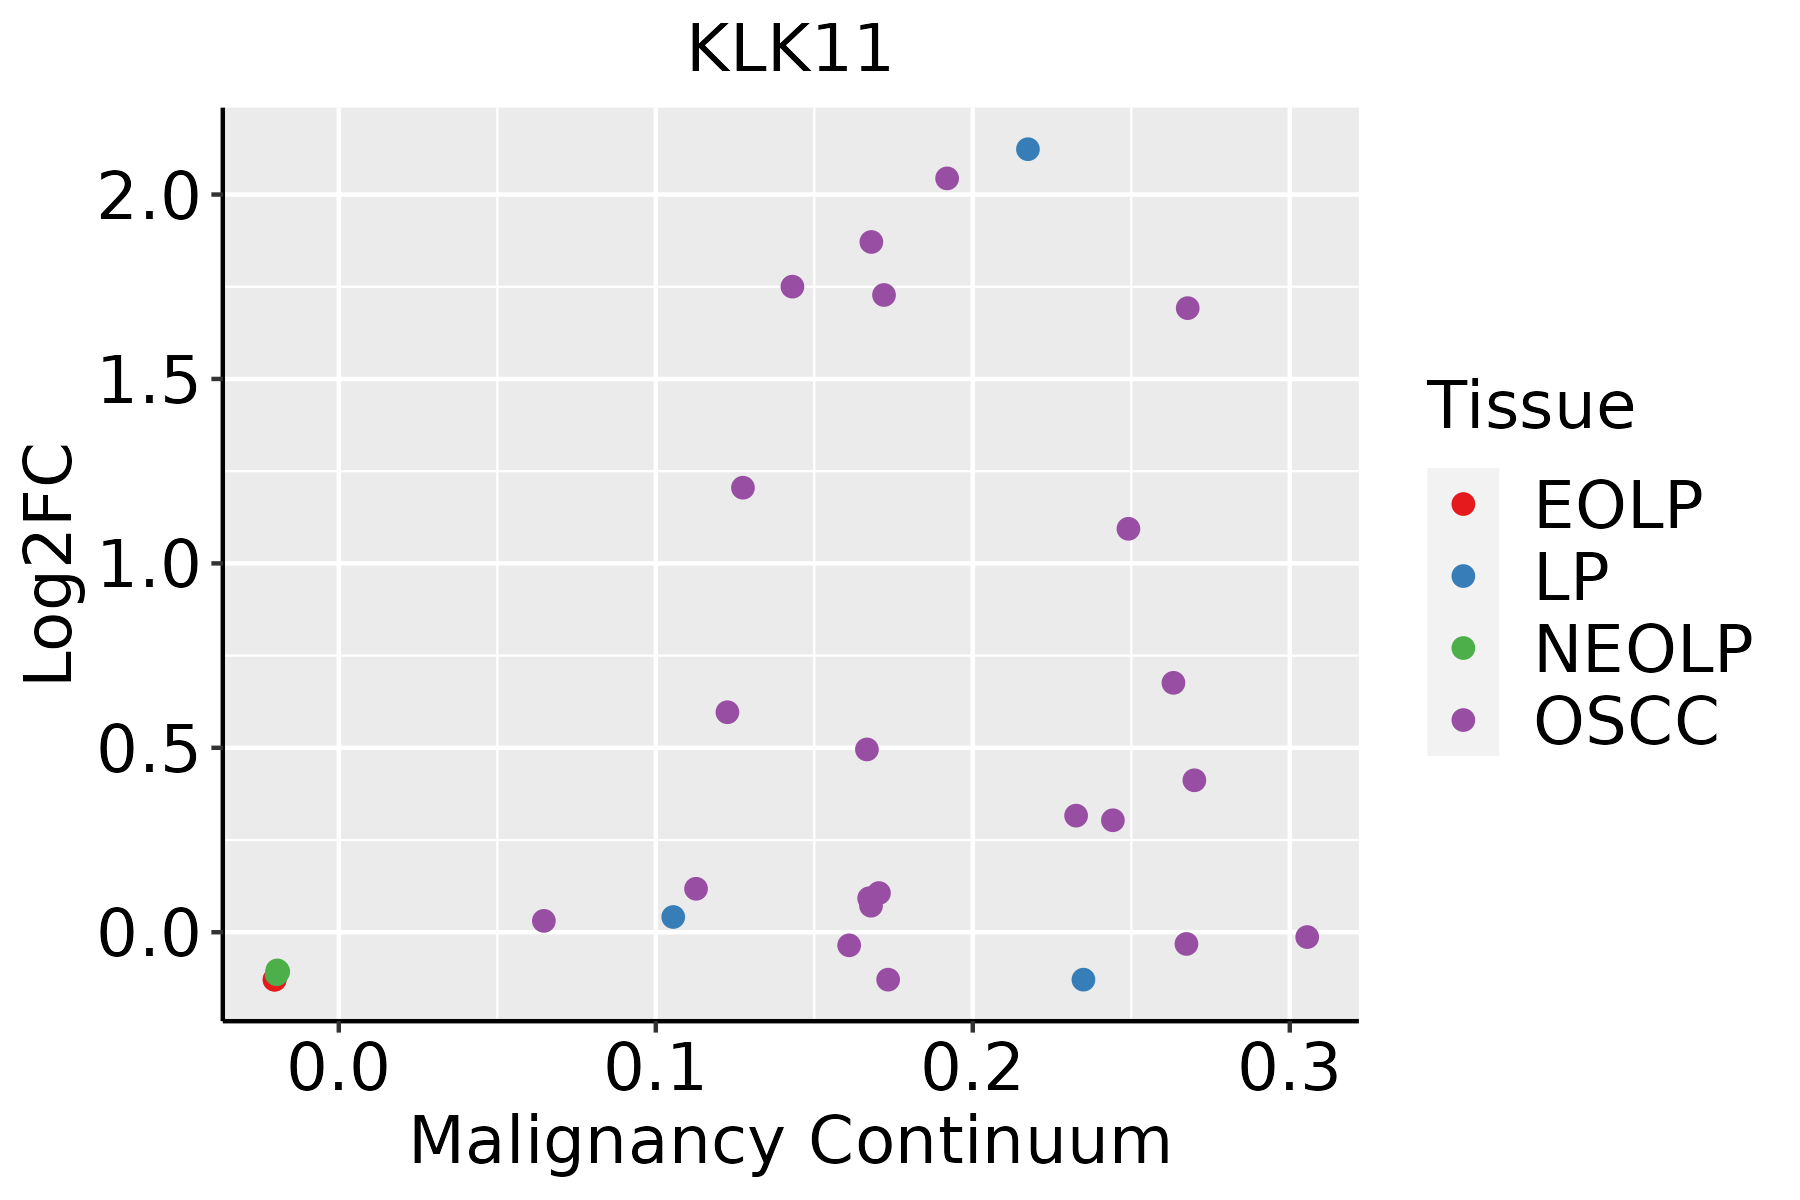 | EOLP: Erosive Oral lichen planus |
| LP: leukoplakia | ||
| NEOLP: Non-erosive oral lichen planus | ||
| OSCC: Oral squamous cell carcinoma | ||
| Skin | 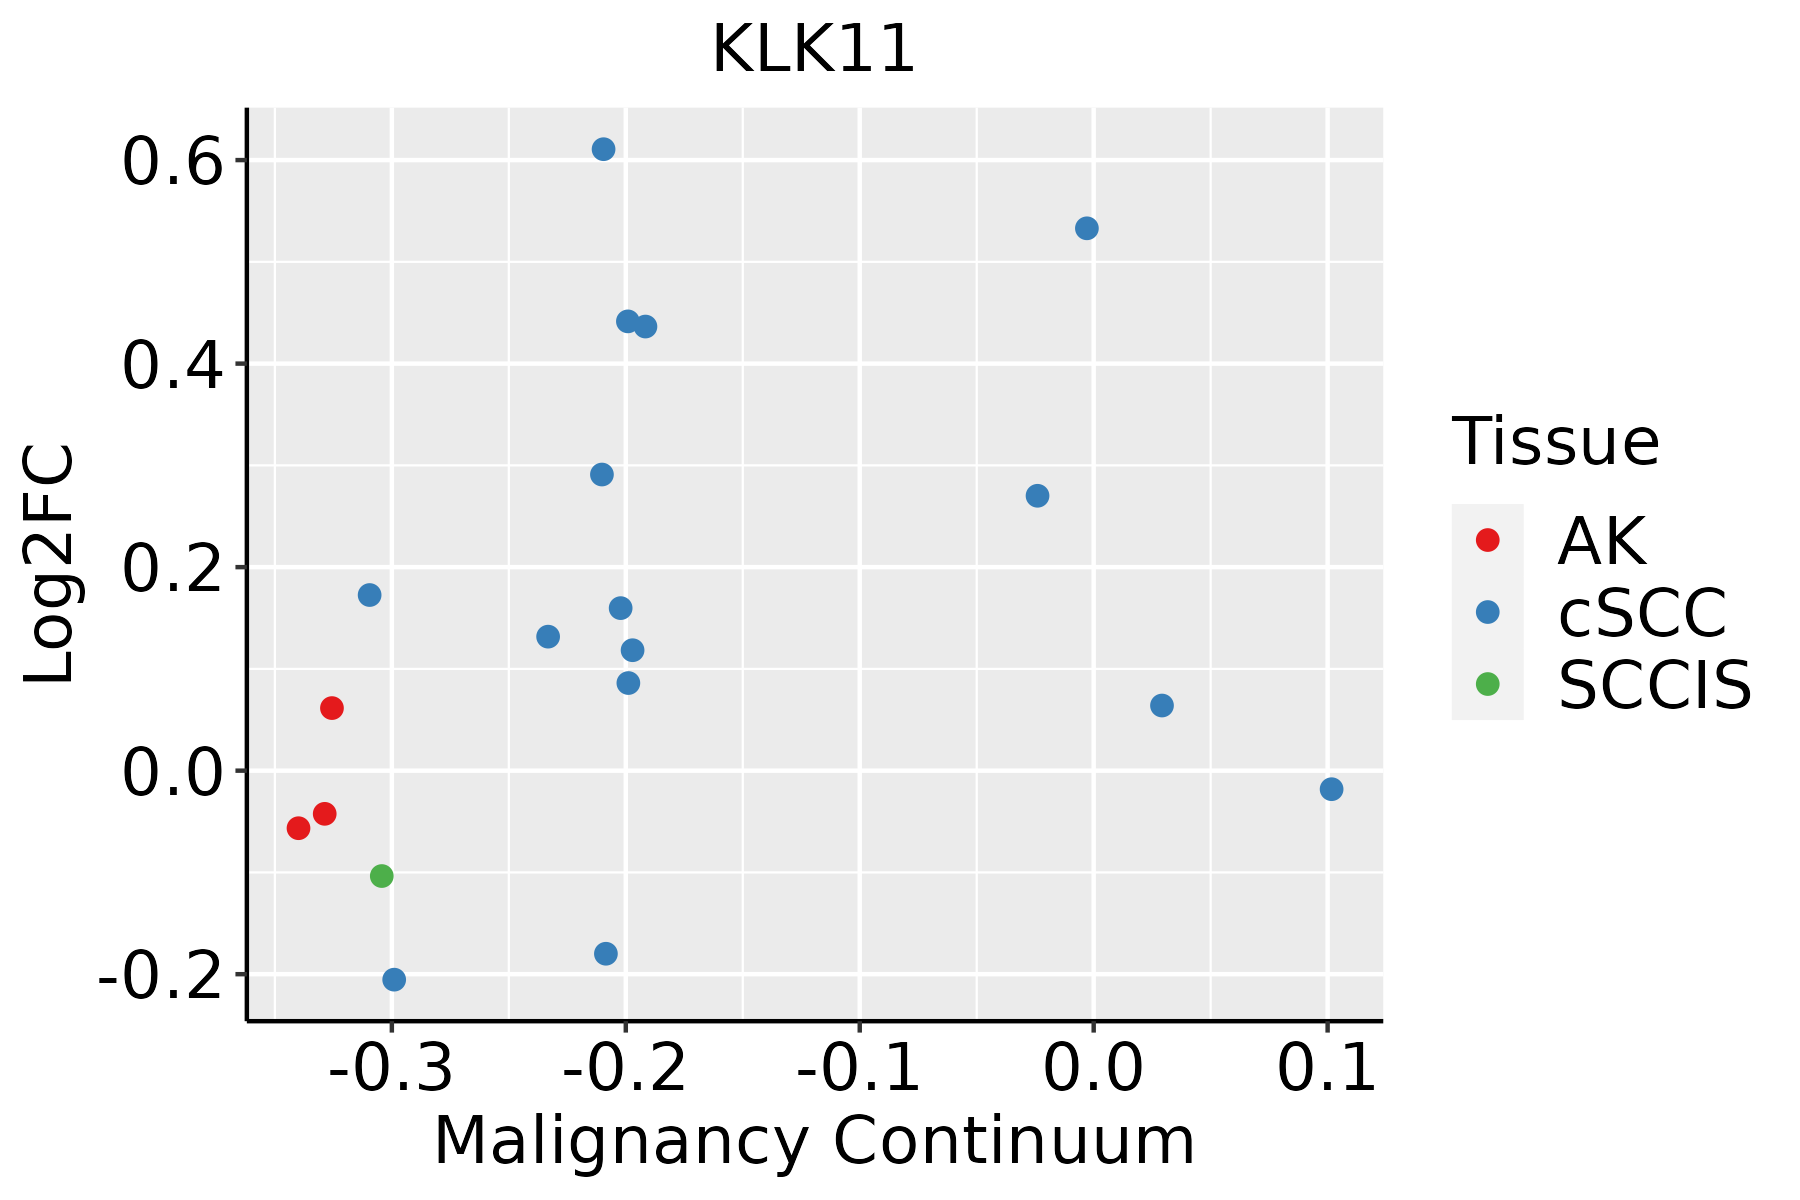 | AK: Actinic keratosis |
| cSCC: Cutaneous squamous cell carcinoma | ||
| SCCIS:squamous cell carcinoma in situ | ||
| Thyroid | 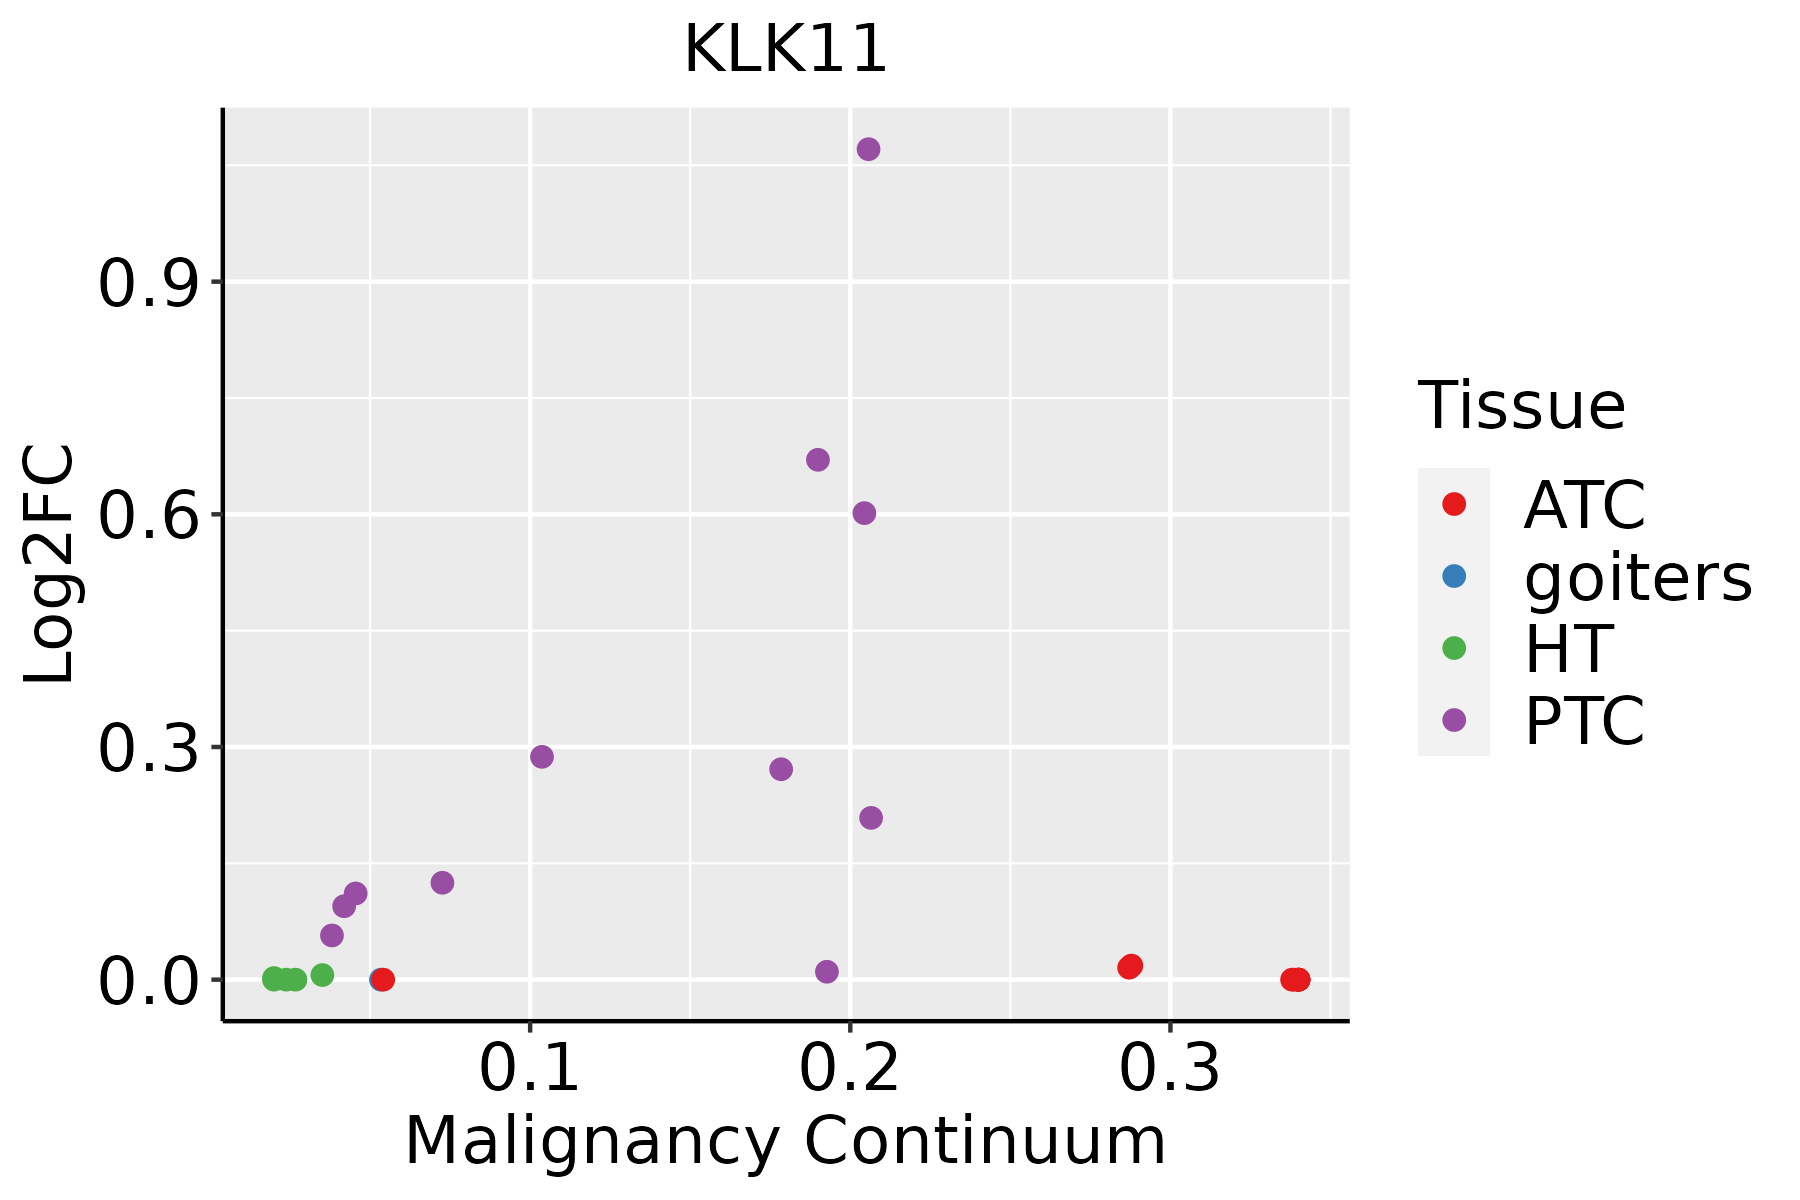 | ATC: Anaplastic thyroid cancer |
| HT: Hashimoto's thyroiditis | ||
| PTC: Papillary thyroid cancer |
| ∗log2FC in expression of this searched gene in stem-like cells from each diseased tissue sample relative to stem-like cells in normal samples in each tissue plotted against the malignancy continuum. Samples are colored based on if they are from different disease stage. |
Top |
Malignant transformation related pathway analysis |
| Find out the enriched GO biological processes and KEGG pathways involved in transition from healthy to precancer to cancer |
| Tissue | Disease Stage | Enriched GO biological Processes |
| Colorectum | AD |  |
| Colorectum | SER |  |
| Colorectum | MSS |  |
| Colorectum | MSI-H |  |
| Colorectum | FAP |  |
| ∗Top 15 enriched GO BP terms are showed in the bar plot of each disease state in each tissue. Each row represents a significant GO biological process which is colored according to the -log10(p.adjust). |
| Page: 1 2 3 4 5 6 7 8 9 |
| GO ID | Tissue | Disease Stage | Description | Gene Ratio | Bg Ratio | pvalue | p.adjust | Count |
| Page: 1 |
| Pathway ID | Tissue | Disease Stage | Description | Gene Ratio | Bg Ratio | pvalue | p.adjust | qvalue | Count |
| Page: 1 |
Top |
Cell-cell communication analysis |
| Identification of potential cell-cell interactions between two cell types and their ligand-receptor pairs for different disease states |
| Ligand | Receptor | LRpair | Pathway | Tissue | Disease Stage |
| Page: 1 |
Top |
Single-cell gene regulatory network inference analysis |
| Find out the significant the regulons (TFs) and the target genes of each regulon across cell types for different disease states |
| TF | Cell Type | Tissue | Disease Stage | Target Gene | RSS | Regulon Activity |
| ∗The dot plots of a searched regulon are shown for all cell subpopulations in each disease state of each tissue based on the regulon specific score inferred using pySCENIC and by calculating the average expression. |
| Page: 1 |
Top |
Somatic mutation of malignant transformation related genes |
| Annotation of somatic variants for genes involved in malignant transformation |
| Hugo Symbol | Variant Class | Variant Classification | dbSNP RS | HGVSc | HGVSp | HGVSp Short | SWISSPROT | BIOTYPE | SIFT | PolyPhen | Tumor Sample Barcode | Tissue | Histology | Sex | Age | Stage | Therapy Types | Drugs | Outcome |
| KLK11 | SNV | Missense_Mutation | c.187N>T | p.His63Tyr | p.H63Y | Q9UBX7 | protein_coding | deleterious(0.01) | probably_damaging(0.981) | TCGA-AC-A23H-01 | Breast | breast invasive carcinoma | Female | >=65 | I/II | Unknown | Unknown | PD | |
| KLK11 | SNV | Missense_Mutation | rs759212241 | c.80N>T | p.Ser27Phe | p.S27F | Q9UBX7 | protein_coding | deleterious(0.01) | benign(0.092) | TCGA-AC-A23H-01 | Breast | breast invasive carcinoma | Female | >=65 | I/II | Unknown | Unknown | PD |
| KLK11 | SNV | Missense_Mutation | novel | c.604N>C | p.Glu202Gln | p.E202Q | Q9UBX7 | protein_coding | tolerated(0.21) | benign(0.222) | TCGA-BH-A0B6-01 | Breast | breast invasive carcinoma | Female | <65 | I/II | Unknown | Unknown | SD |
| KLK11 | insertion | Frame_Shift_Ins | novel | c.742_743insCCGCGCCCGCCCGGCTTTCATTTATTAAT | p.Ile248ThrfsTer42 | p.I248Tfs*42 | Q9UBX7 | protein_coding | TCGA-AN-A0FX-01 | Breast | breast invasive carcinoma | Female | <65 | I/II | Unknown | Unknown | SD | ||
| KLK11 | SNV | Missense_Mutation | rs759848513 | c.770N>T | p.Ala257Val | p.A257V | Q9UBX7 | protein_coding | deleterious(0.02) | possibly_damaging(0.878) | TCGA-AA-A01R-01 | Colorectum | colon adenocarcinoma | Male | <65 | III/IV | Chemotherapy | 5-fluorouracil | PD |
| KLK11 | SNV | Missense_Mutation | c.199T>C | p.Trp67Arg | p.W67R | Q9UBX7 | protein_coding | deleterious(0) | probably_damaging(0.997) | TCGA-AD-6895-01 | Colorectum | colon adenocarcinoma | Male | >=65 | III/IV | Unknown | Unknown | SD | |
| KLK11 | SNV | Missense_Mutation | rs200477811 | c.293C>T | p.Pro98Leu | p.P98L | Q9UBX7 | protein_coding | tolerated(0.08) | benign(0.025) | TCGA-G4-6588-01 | Colorectum | colon adenocarcinoma | Female | <65 | I/II | Unknown | Unknown | SD |
| KLK11 | deletion | Frame_Shift_Del | c.710delG | p.Gly237AlafsTer43 | p.G237Afs*43 | Q9UBX7 | protein_coding | TCGA-AA-3663-01 | Colorectum | colon adenocarcinoma | Male | <65 | I/II | Unknown | Unknown | SD | |||
| KLK11 | SNV | Missense_Mutation | rs539901509 | c.22C>T | p.Arg8Trp | p.R8W | Q9UBX7 | protein_coding | deleterious_low_confidence(0.01) | benign(0.18) | TCGA-A5-A0G2-01 | Endometrium | uterine corpus endometrioid carcinoma | Female | <65 | III/IV | Unknown | Unknown | SD |
| KLK11 | SNV | Missense_Mutation | rs201147335 | c.242C>T | p.Ala81Val | p.A81V | Q9UBX7 | protein_coding | deleterious(0) | probably_damaging(0.93) | TCGA-AP-A056-01 | Endometrium | uterine corpus endometrioid carcinoma | Female | <65 | I/II | Unknown | Unknown | SD |
| Page: 1 2 3 4 |
Top |
Related drugs of malignant transformation related genes |
| Identification of chemicals and drugs interact with genes involved in malignant transfromation |
| (DGIdb 4.0) |
| Entrez ID | Symbol | Category | Interaction Types | Drug Claim Name | Drug Name | PMIDs |
| Page: 1 |

Copyright 2023-Present -The University of Texas Health Science Center at Houston |