
|
|||||
|
 | |
| |
| |
| |
| |
| |
|
Gene: KLHL9 |
Gene summary for KLHL9 |
| Gene information | Species | Human | Gene symbol | KLHL9 | Gene ID | 55958 |
| Gene name | kelch like family member 9 | |
| Gene Alias | KLHL9 | |
| Cytomap | 9p21.3 | |
| Gene Type | protein-coding | GO ID | GO:0000910 | UniProtAcc | Q58EZ4 |
Top |
Malignant transformation analysis |
| Identification of the aberrant gene expression in precancerous and cancerous lesions by comparing the gene expression of stem-like cells in diseased tissues with normal stem cells |
| Entrez ID | Symbol | Replicates | Species | Organ | Tissue | Adj P-value | Log2FC | Malignancy |
| 55958 | KLHL9 | LZE2D | Human | Esophagus | HGIN | 2.32e-02 | 3.66e-01 | 0.0642 |
| 55958 | KLHL9 | LZE4T | Human | Esophagus | ESCC | 5.14e-11 | 2.96e-01 | 0.0811 |
| 55958 | KLHL9 | LZE8T | Human | Esophagus | ESCC | 1.23e-06 | 1.67e-01 | 0.067 |
| 55958 | KLHL9 | LZE24T | Human | Esophagus | ESCC | 1.63e-05 | 2.25e-01 | 0.0596 |
| 55958 | KLHL9 | P2T-E | Human | Esophagus | ESCC | 1.62e-29 | 5.54e-01 | 0.1177 |
| 55958 | KLHL9 | P4T-E | Human | Esophagus | ESCC | 7.20e-10 | 1.94e-01 | 0.1323 |
| 55958 | KLHL9 | P5T-E | Human | Esophagus | ESCC | 2.52e-05 | 7.33e-02 | 0.1327 |
| 55958 | KLHL9 | P8T-E | Human | Esophagus | ESCC | 2.10e-16 | 1.68e-01 | 0.0889 |
| 55958 | KLHL9 | P9T-E | Human | Esophagus | ESCC | 5.81e-16 | 2.05e-01 | 0.1131 |
| 55958 | KLHL9 | P10T-E | Human | Esophagus | ESCC | 7.56e-21 | 3.11e-01 | 0.116 |
| 55958 | KLHL9 | P11T-E | Human | Esophagus | ESCC | 8.44e-06 | 4.12e-01 | 0.1426 |
| 55958 | KLHL9 | P15T-E | Human | Esophagus | ESCC | 6.94e-14 | 1.97e-01 | 0.1149 |
| 55958 | KLHL9 | P16T-E | Human | Esophagus | ESCC | 4.73e-10 | 2.16e-01 | 0.1153 |
| 55958 | KLHL9 | P17T-E | Human | Esophagus | ESCC | 8.31e-07 | 2.92e-01 | 0.1278 |
| 55958 | KLHL9 | P19T-E | Human | Esophagus | ESCC | 6.15e-05 | 3.39e-01 | 0.1662 |
| 55958 | KLHL9 | P20T-E | Human | Esophagus | ESCC | 8.11e-05 | 1.72e-01 | 0.1124 |
| 55958 | KLHL9 | P21T-E | Human | Esophagus | ESCC | 7.48e-15 | 1.97e-01 | 0.1617 |
| 55958 | KLHL9 | P22T-E | Human | Esophagus | ESCC | 1.73e-19 | 1.43e-01 | 0.1236 |
| 55958 | KLHL9 | P23T-E | Human | Esophagus | ESCC | 1.83e-12 | 1.62e-01 | 0.108 |
| 55958 | KLHL9 | P24T-E | Human | Esophagus | ESCC | 1.85e-12 | 1.76e-01 | 0.1287 |
| Page: 1 2 3 4 |
| Tissue | Expression Dynamics | Abbreviation |
| Esophagus | 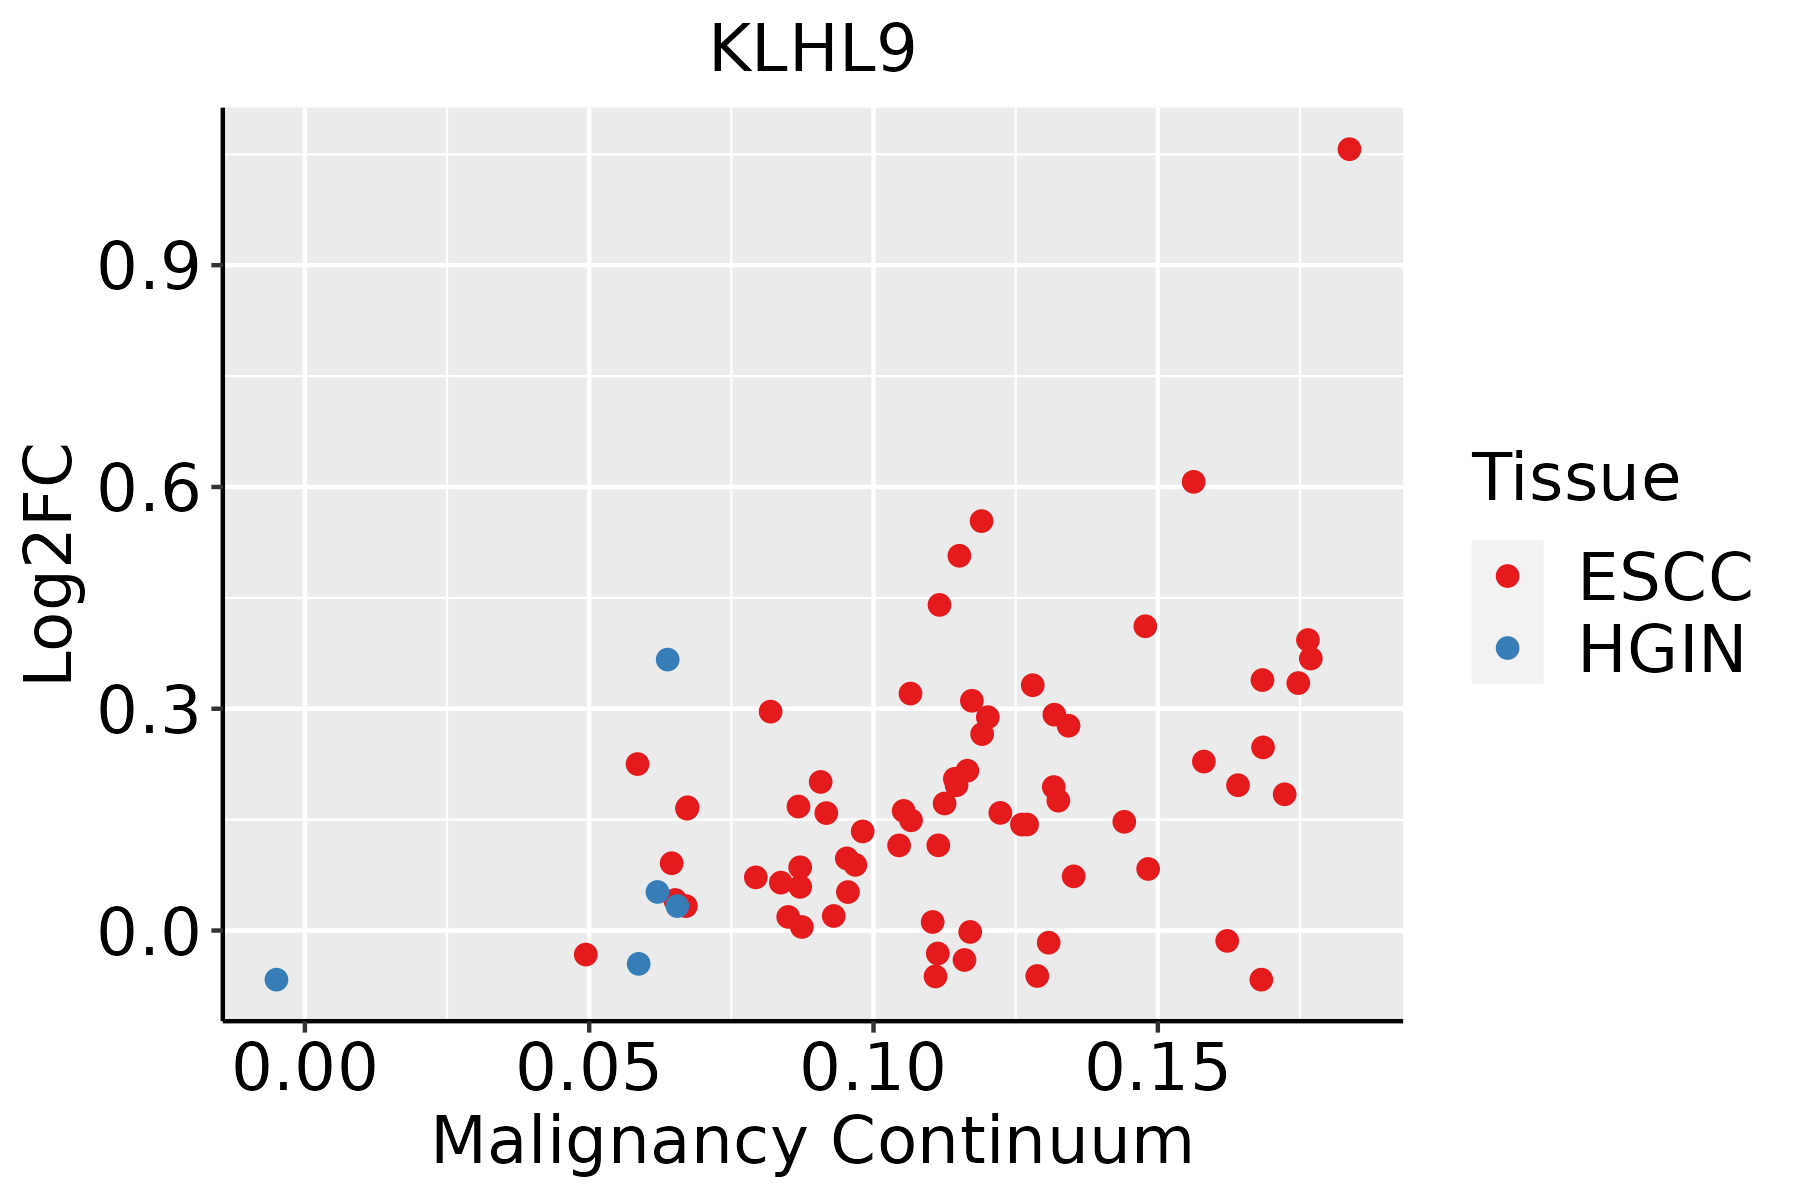 | ESCC: Esophageal squamous cell carcinoma |
| HGIN: High-grade intraepithelial neoplasias | ||
| LGIN: Low-grade intraepithelial neoplasias | ||
| Thyroid | 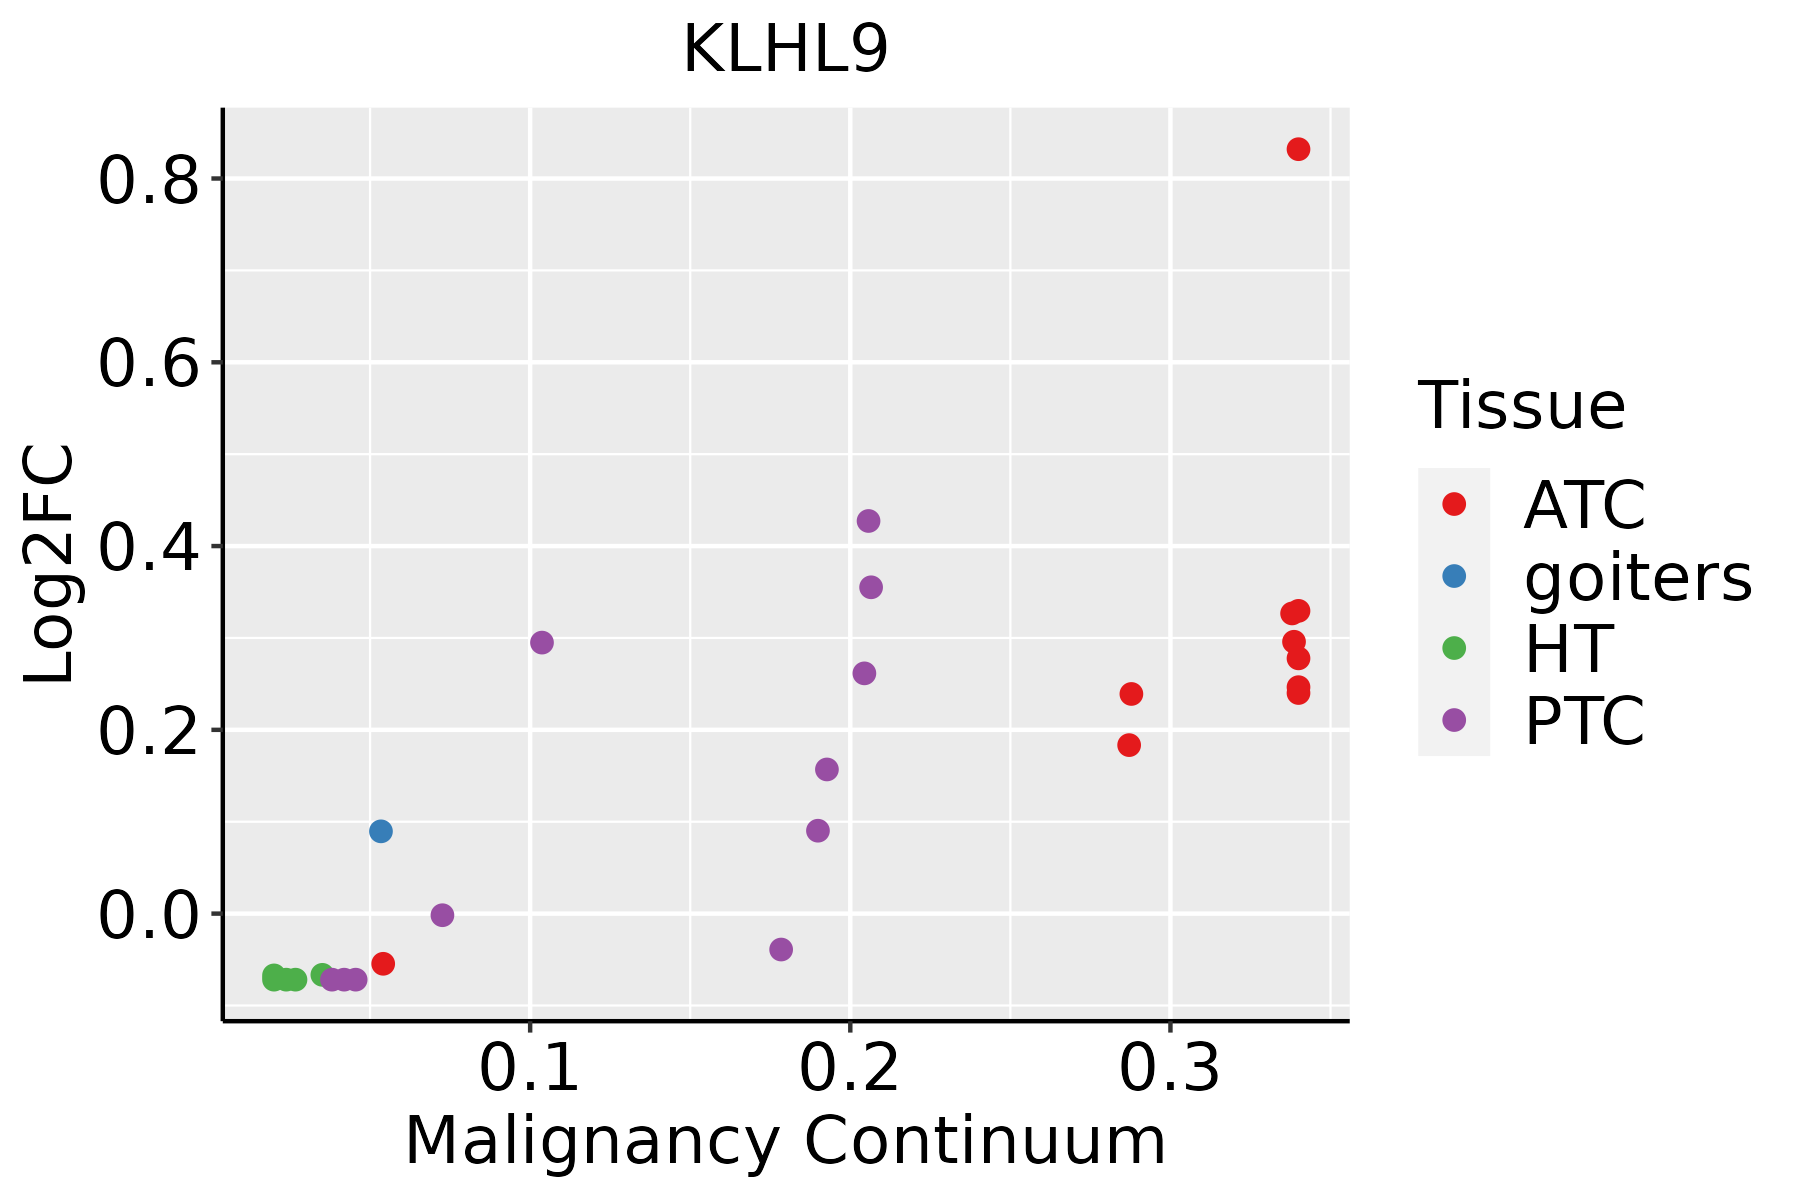 | ATC: Anaplastic thyroid cancer |
| HT: Hashimoto's thyroiditis | ||
| PTC: Papillary thyroid cancer |
| ∗log2FC in expression of this searched gene in stem-like cells from each diseased tissue sample relative to stem-like cells in normal samples in each tissue plotted against the malignancy continuum. Samples are colored based on if they are from different disease stage. |
Top |
Malignant transformation related pathway analysis |
| Find out the enriched GO biological processes and KEGG pathways involved in transition from healthy to precancer to cancer |
| Tissue | Disease Stage | Enriched GO biological Processes |
| Colorectum | AD |  |
| Colorectum | SER |  |
| Colorectum | MSS |  |
| Colorectum | MSI-H |  |
| Colorectum | FAP |  |
| ∗Top 15 enriched GO BP terms are showed in the bar plot of each disease state in each tissue. Each row represents a significant GO biological process which is colored according to the -log10(p.adjust). |
| Page: 1 2 3 4 5 6 7 8 9 |
| GO ID | Tissue | Disease Stage | Description | Gene Ratio | Bg Ratio | pvalue | p.adjust | Count |
| GO:000091015 | Esophagus | HGIN | cytokinesis | 44/2587 | 173/18723 | 3.26e-05 | 8.32e-04 | 44 |
| GO:000091016 | Esophagus | ESCC | cytokinesis | 115/8552 | 173/18723 | 2.48e-08 | 4.68e-07 | 115 |
| GO:00324653 | Esophagus | ESCC | regulation of cytokinesis | 57/8552 | 92/18723 | 1.20e-03 | 5.88e-03 | 57 |
| GO:00513025 | Esophagus | ESCC | regulation of cell division | 97/8552 | 177/18723 | 8.93e-03 | 3.12e-02 | 97 |
| GO:000091019 | Thyroid | PTC | cytokinesis | 82/5968 | 173/18723 | 1.37e-05 | 1.47e-04 | 82 |
| GO:00324655 | Thyroid | PTC | regulation of cytokinesis | 40/5968 | 92/18723 | 1.26e-02 | 4.92e-02 | 40 |
| GO:0000910110 | Thyroid | ATC | cytokinesis | 93/6293 | 173/18723 | 3.59e-08 | 6.67e-07 | 93 |
| GO:003246511 | Thyroid | ATC | regulation of cytokinesis | 47/6293 | 92/18723 | 3.95e-04 | 2.39e-03 | 47 |
| GO:00513027 | Thyroid | ATC | regulation of cell division | 80/6293 | 177/18723 | 8.54e-04 | 4.68e-03 | 80 |
| Page: 1 |
| Pathway ID | Tissue | Disease Stage | Description | Gene Ratio | Bg Ratio | pvalue | p.adjust | qvalue | Count |
| hsa0412026 | Esophagus | HGIN | Ubiquitin mediated proteolysis | 49/1383 | 142/8465 | 7.78e-08 | 1.33e-06 | 1.06e-06 | 49 |
| hsa04120111 | Esophagus | HGIN | Ubiquitin mediated proteolysis | 49/1383 | 142/8465 | 7.78e-08 | 1.33e-06 | 1.06e-06 | 49 |
| hsa0412027 | Esophagus | ESCC | Ubiquitin mediated proteolysis | 122/4205 | 142/8465 | 6.53e-20 | 7.29e-18 | 3.74e-18 | 122 |
| hsa0412036 | Esophagus | ESCC | Ubiquitin mediated proteolysis | 122/4205 | 142/8465 | 6.53e-20 | 7.29e-18 | 3.74e-18 | 122 |
| Page: 1 |
Top |
Cell-cell communication analysis |
| Identification of potential cell-cell interactions between two cell types and their ligand-receptor pairs for different disease states |
| Ligand | Receptor | LRpair | Pathway | Tissue | Disease Stage |
| Page: 1 |
Top |
Single-cell gene regulatory network inference analysis |
| Find out the significant the regulons (TFs) and the target genes of each regulon across cell types for different disease states |
| TF | Cell Type | Tissue | Disease Stage | Target Gene | RSS | Regulon Activity |
| ∗The dot plots of a searched regulon are shown for all cell subpopulations in each disease state of each tissue based on the regulon specific score inferred using pySCENIC and by calculating the average expression. |
| Page: 1 |
Top |
Somatic mutation of malignant transformation related genes |
| Annotation of somatic variants for genes involved in malignant transformation |
| Hugo Symbol | Variant Class | Variant Classification | dbSNP RS | HGVSc | HGVSp | HGVSp Short | SWISSPROT | BIOTYPE | SIFT | PolyPhen | Tumor Sample Barcode | Tissue | Histology | Sex | Age | Stage | Therapy Types | Drugs | Outcome |
| KLHL9 | SNV | Missense_Mutation | novel | c.1616G>A | p.Gly539Glu | p.G539E | Q9P2J3 | protein_coding | deleterious(0) | probably_damaging(1) | TCGA-GM-A2D9-01 | Breast | breast invasive carcinoma | Female | >=65 | I/II | Hormone Therapy | arimidex | SD |
| KLHL9 | insertion | Frame_Shift_Ins | novel | c.1612_1613insG | p.Val538GlyfsTer7 | p.V538Gfs*7 | Q9P2J3 | protein_coding | TCGA-A2-A0CU-01 | Breast | breast invasive carcinoma | Female | >=65 | I/II | Hormone Therapy | tamoxiphen | SD | ||
| KLHL9 | deletion | Frame_Shift_Del | c.1742delN | p.Pro581GlnfsTer42 | p.P581Qfs*42 | Q9P2J3 | protein_coding | TCGA-OL-A5S0-01 | Breast | breast invasive carcinoma | Female | >=65 | I/II | Chemotherapy | taxol | CR | |||
| KLHL9 | SNV | Missense_Mutation | c.259N>C | p.Glu87Gln | p.E87Q | Q9P2J3 | protein_coding | deleterious(0) | probably_damaging(0.996) | TCGA-EK-A3GK-01 | Cervix | cervical & endocervical cancer | Female | <65 | I/II | Unknown | Unknown | SD | |
| KLHL9 | SNV | Missense_Mutation | c.1588G>A | p.Ala530Thr | p.A530T | Q9P2J3 | protein_coding | deleterious(0) | benign(0.311) | TCGA-A6-A565-01 | Colorectum | colon adenocarcinoma | Female | <65 | III/IV | Unspecific | 5FU | PD | |
| KLHL9 | SNV | Missense_Mutation | novel | c.277N>C | p.Ile93Leu | p.I93L | Q9P2J3 | protein_coding | deleterious(0.01) | probably_damaging(0.934) | TCGA-AA-3930-01 | Colorectum | colon adenocarcinoma | Male | >=65 | III/IV | Chemotherapy | capecitabine | PD |
| KLHL9 | SNV | Missense_Mutation | c.722G>A | p.Arg241Gln | p.R241Q | Q9P2J3 | protein_coding | deleterious(0) | probably_damaging(0.994) | TCGA-AA-A00N-01 | Colorectum | colon adenocarcinoma | Male | >=65 | I/II | Unknown | Unknown | PD | |
| KLHL9 | SNV | Missense_Mutation | c.347C>A | p.Ser116Tyr | p.S116Y | Q9P2J3 | protein_coding | tolerated(1) | benign(0.105) | TCGA-AA-A010-01 | Colorectum | colon adenocarcinoma | Female | <65 | I/II | Chemotherapy | folinic | CR | |
| KLHL9 | SNV | Missense_Mutation | c.1030G>A | p.Val344Ile | p.V344I | Q9P2J3 | protein_coding | tolerated(0.07) | probably_damaging(0.92) | TCGA-AZ-4313-01 | Colorectum | colon adenocarcinoma | Female | <65 | I/II | Unknown | Unknown | SD | |
| KLHL9 | SNV | Missense_Mutation | novel | c.1831T>C | p.Ser611Pro | p.S611P | Q9P2J3 | protein_coding | tolerated(0.15) | benign(0.001) | TCGA-CA-6717-01 | Colorectum | colon adenocarcinoma | Male | <65 | I/II | Chemotherapy | oxaliplatin | CR |
| Page: 1 2 3 4 5 6 7 8 |
Top |
Related drugs of malignant transformation related genes |
| Identification of chemicals and drugs interact with genes involved in malignant transfromation |
| (DGIdb 4.0) |
| Entrez ID | Symbol | Category | Interaction Types | Drug Claim Name | Drug Name | PMIDs |
| Page: 1 |

Copyright 2023-Present -The University of Texas Health Science Center at Houston |