
|
|||||
|
 | |
| |
| |
| |
| |
| |
|
Gene: KLHL7 |
Gene summary for KLHL7 |
| Gene information | Species | Human | Gene symbol | KLHL7 | Gene ID | 55975 |
| Gene name | kelch like family member 7 | |
| Gene Alias | CISS3 | |
| Cytomap | 7p15.3 | |
| Gene Type | protein-coding | GO ID | GO:0006464 | UniProtAcc | A8K364 |
Top |
Malignant transformation analysis |
| Identification of the aberrant gene expression in precancerous and cancerous lesions by comparing the gene expression of stem-like cells in diseased tissues with normal stem cells |
| Entrez ID | Symbol | Replicates | Species | Organ | Tissue | Adj P-value | Log2FC | Malignancy |
| 55975 | KLHL7 | LZE4T | Human | Esophagus | ESCC | 1.81e-17 | 3.10e-01 | 0.0811 |
| 55975 | KLHL7 | LZE5T | Human | Esophagus | ESCC | 1.90e-02 | 1.17e-01 | 0.0514 |
| 55975 | KLHL7 | LZE7T | Human | Esophagus | ESCC | 7.64e-07 | 3.86e-01 | 0.0667 |
| 55975 | KLHL7 | LZE24T | Human | Esophagus | ESCC | 4.92e-13 | 4.56e-01 | 0.0596 |
| 55975 | KLHL7 | LZE21T | Human | Esophagus | ESCC | 4.35e-04 | 2.17e-01 | 0.0655 |
| 55975 | KLHL7 | LZE6T | Human | Esophagus | ESCC | 3.62e-07 | 2.78e-01 | 0.0845 |
| 55975 | KLHL7 | P2T-E | Human | Esophagus | ESCC | 1.77e-29 | 3.86e-01 | 0.1177 |
| 55975 | KLHL7 | P4T-E | Human | Esophagus | ESCC | 2.98e-30 | 7.36e-01 | 0.1323 |
| 55975 | KLHL7 | P5T-E | Human | Esophagus | ESCC | 7.69e-18 | 3.28e-01 | 0.1327 |
| 55975 | KLHL7 | P8T-E | Human | Esophagus | ESCC | 6.19e-16 | 1.70e-01 | 0.0889 |
| 55975 | KLHL7 | P9T-E | Human | Esophagus | ESCC | 1.10e-20 | 3.79e-01 | 0.1131 |
| 55975 | KLHL7 | P10T-E | Human | Esophagus | ESCC | 7.76e-26 | 3.88e-01 | 0.116 |
| 55975 | KLHL7 | P11T-E | Human | Esophagus | ESCC | 1.09e-10 | 5.47e-01 | 0.1426 |
| 55975 | KLHL7 | P12T-E | Human | Esophagus | ESCC | 4.72e-36 | 5.59e-01 | 0.1122 |
| 55975 | KLHL7 | P15T-E | Human | Esophagus | ESCC | 7.82e-15 | 3.05e-01 | 0.1149 |
| 55975 | KLHL7 | P16T-E | Human | Esophagus | ESCC | 1.14e-23 | 4.60e-01 | 0.1153 |
| 55975 | KLHL7 | P19T-E | Human | Esophagus | ESCC | 5.62e-07 | 6.63e-01 | 0.1662 |
| 55975 | KLHL7 | P20T-E | Human | Esophagus | ESCC | 1.04e-14 | 2.74e-01 | 0.1124 |
| 55975 | KLHL7 | P21T-E | Human | Esophagus | ESCC | 6.75e-21 | 4.40e-01 | 0.1617 |
| 55975 | KLHL7 | P22T-E | Human | Esophagus | ESCC | 9.74e-14 | 2.38e-01 | 0.1236 |
| Page: 1 2 3 4 5 |
| Tissue | Expression Dynamics | Abbreviation |
| Esophagus |  | ESCC: Esophageal squamous cell carcinoma |
| HGIN: High-grade intraepithelial neoplasias | ||
| LGIN: Low-grade intraepithelial neoplasias | ||
| Liver | 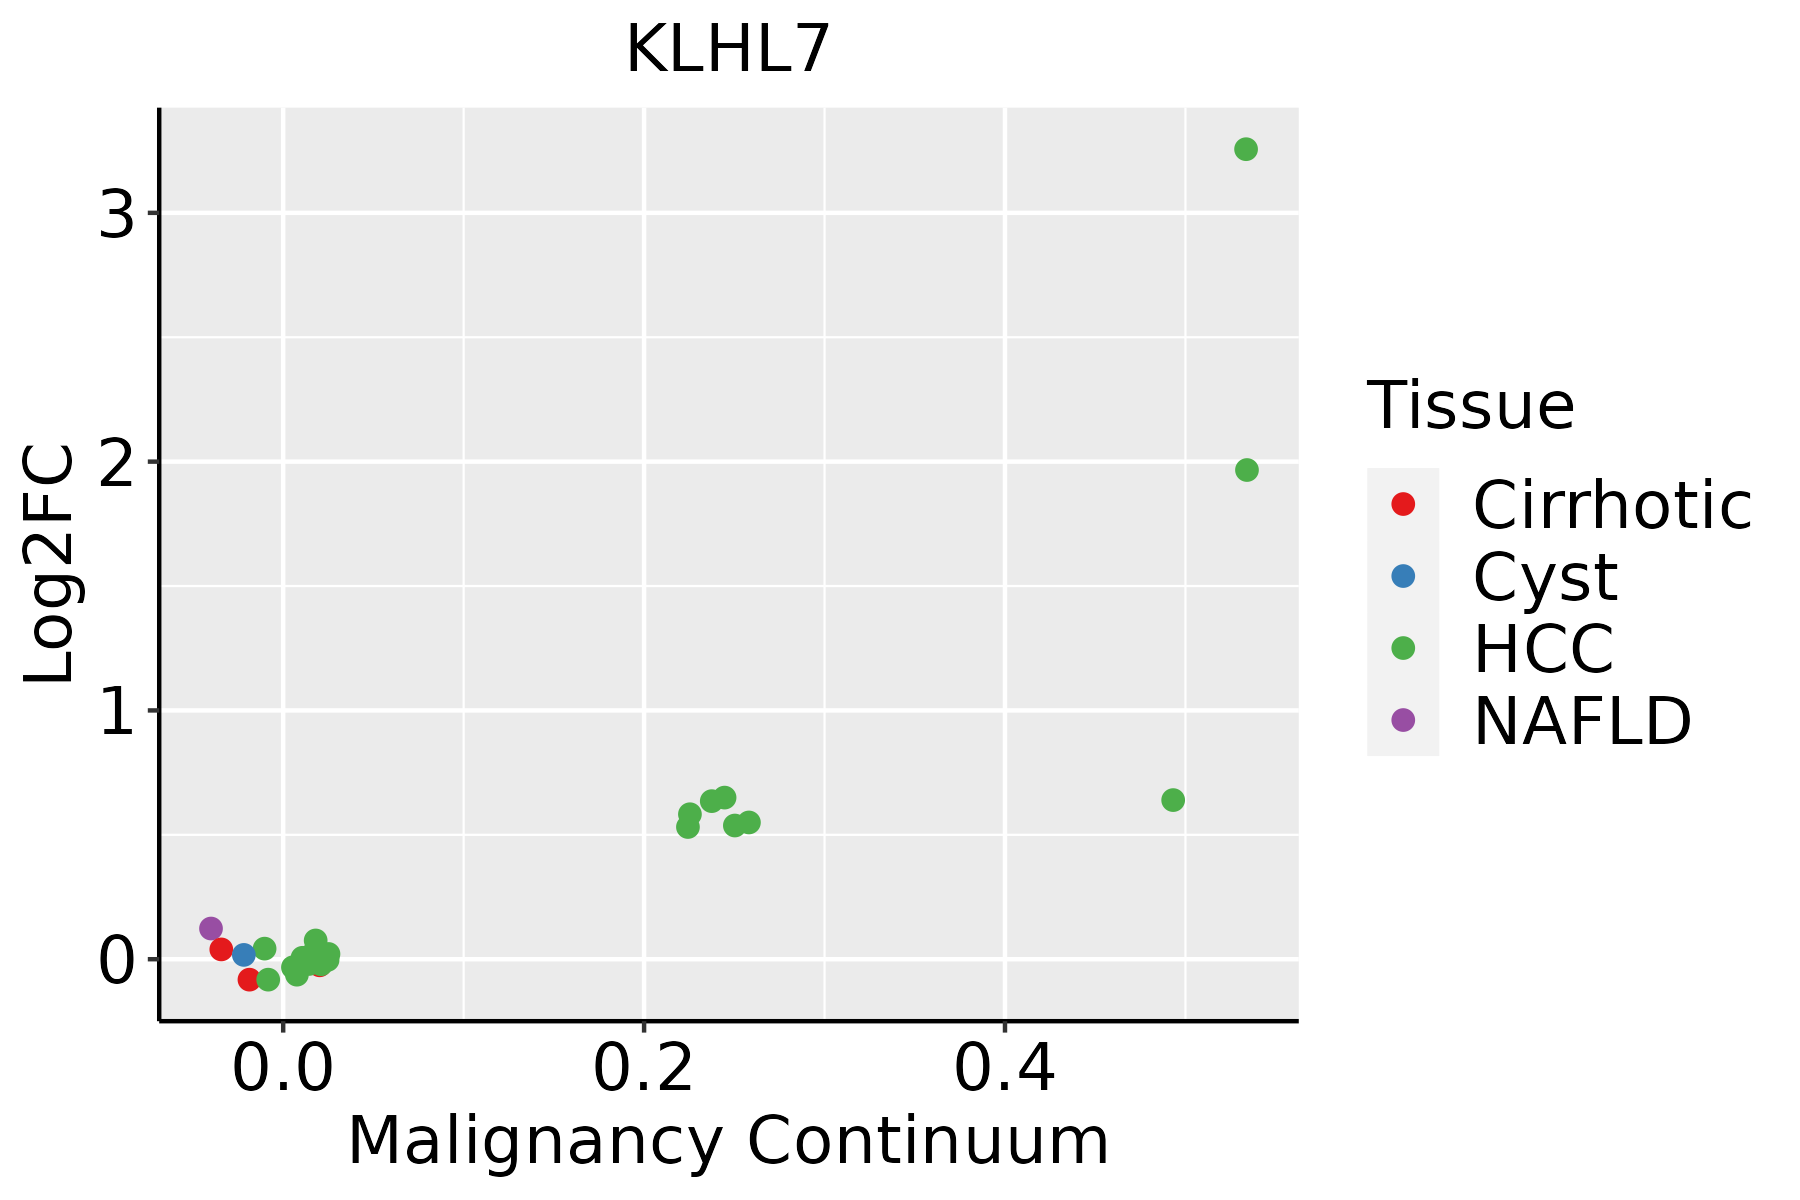 | HCC: Hepatocellular carcinoma |
| NAFLD: Non-alcoholic fatty liver disease | ||
| Oral Cavity |  | EOLP: Erosive Oral lichen planus |
| LP: leukoplakia | ||
| NEOLP: Non-erosive oral lichen planus | ||
| OSCC: Oral squamous cell carcinoma | ||
| Thyroid | 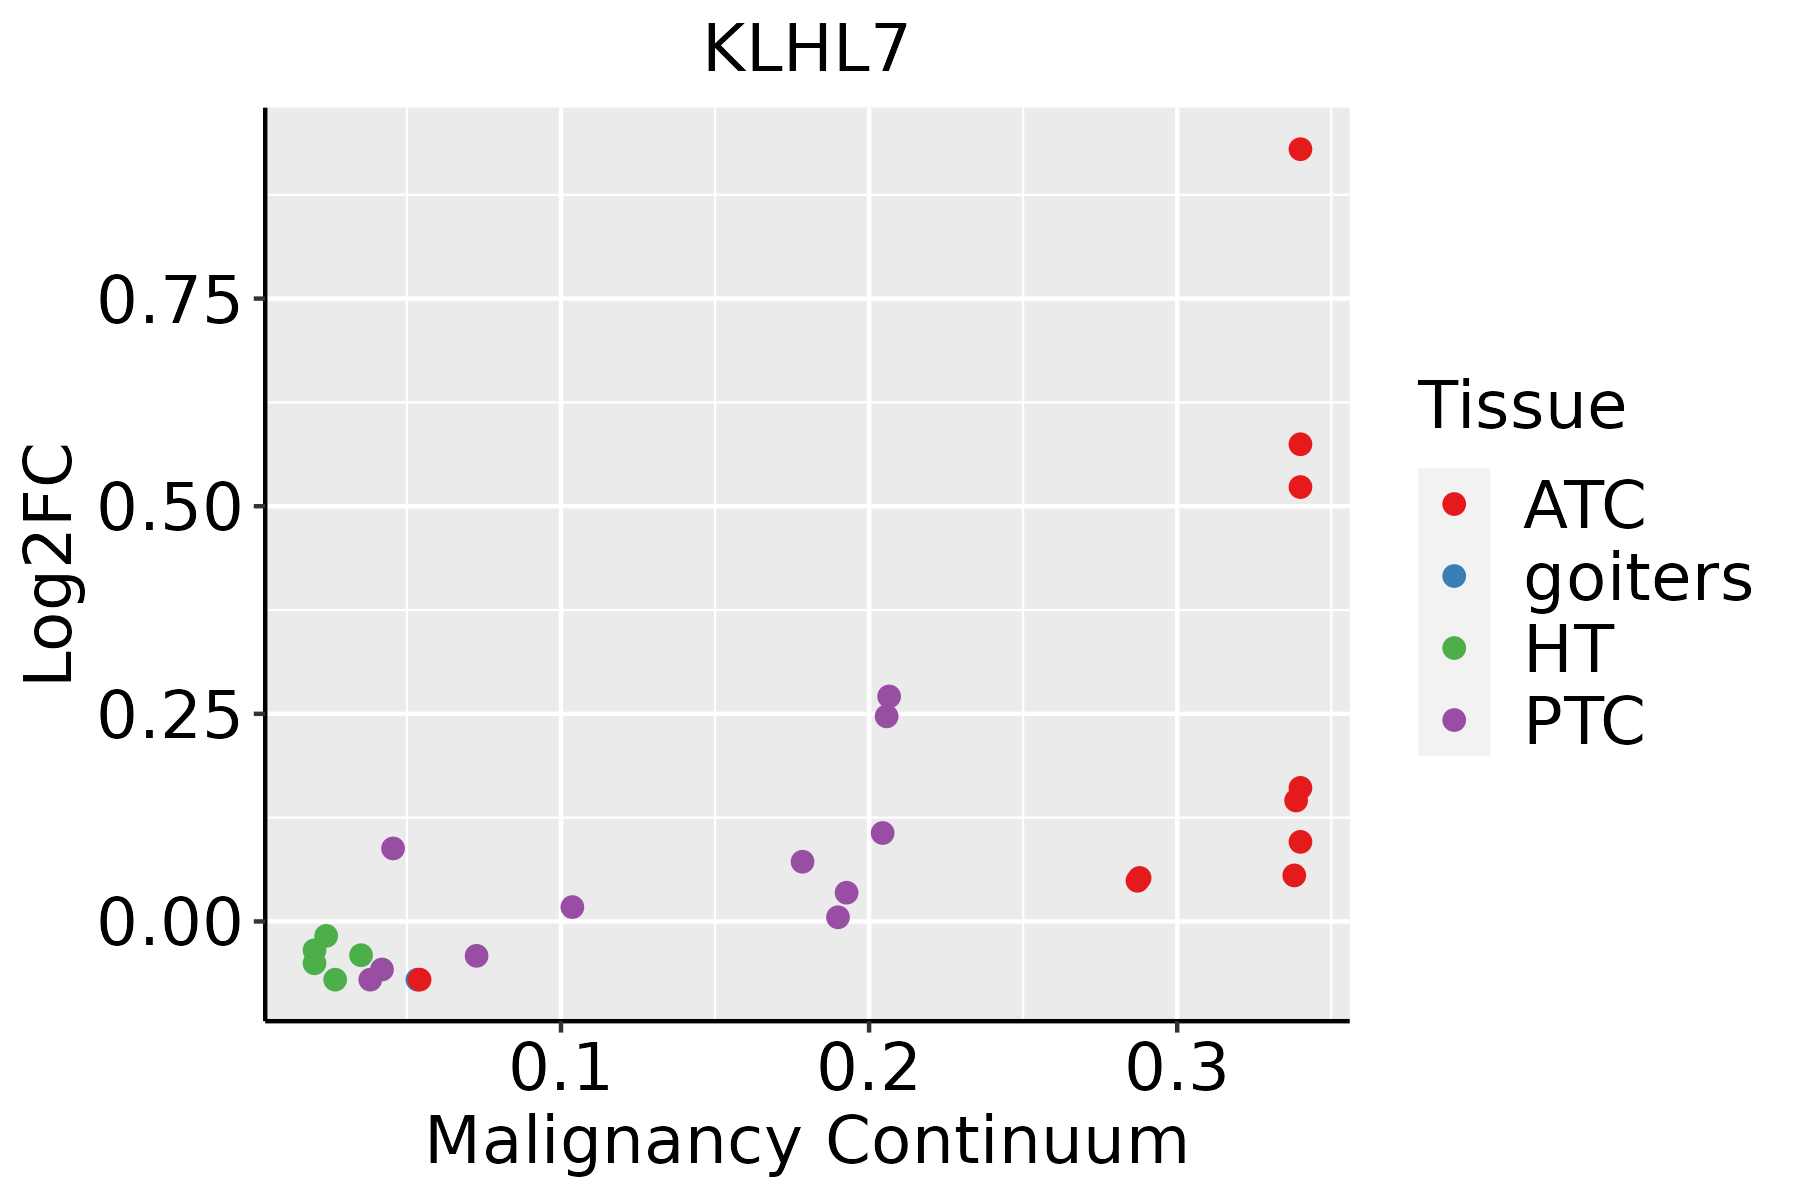 | ATC: Anaplastic thyroid cancer |
| HT: Hashimoto's thyroiditis | ||
| PTC: Papillary thyroid cancer |
| ∗log2FC in expression of this searched gene in stem-like cells from each diseased tissue sample relative to stem-like cells in normal samples in each tissue plotted against the malignancy continuum. Samples are colored based on if they are from different disease stage. |
Top |
Malignant transformation related pathway analysis |
| Find out the enriched GO biological processes and KEGG pathways involved in transition from healthy to precancer to cancer |
| Tissue | Disease Stage | Enriched GO biological Processes |
| Colorectum | AD |  |
| Colorectum | SER |  |
| Colorectum | MSS |  |
| Colorectum | MSI-H |  |
| Colorectum | FAP |  |
| ∗Top 15 enriched GO BP terms are showed in the bar plot of each disease state in each tissue. Each row represents a significant GO biological process which is colored according to the -log10(p.adjust). |
| Page: 1 2 3 4 5 6 7 8 9 |
| GO ID | Tissue | Disease Stage | Description | Gene Ratio | Bg Ratio | pvalue | p.adjust | Count |
| Page: 1 |
| Pathway ID | Tissue | Disease Stage | Description | Gene Ratio | Bg Ratio | pvalue | p.adjust | qvalue | Count |
| Page: 1 |
Top |
Cell-cell communication analysis |
| Identification of potential cell-cell interactions between two cell types and their ligand-receptor pairs for different disease states |
| Ligand | Receptor | LRpair | Pathway | Tissue | Disease Stage |
| Page: 1 |
Top |
Single-cell gene regulatory network inference analysis |
| Find out the significant the regulons (TFs) and the target genes of each regulon across cell types for different disease states |
| TF | Cell Type | Tissue | Disease Stage | Target Gene | RSS | Regulon Activity |
| ∗The dot plots of a searched regulon are shown for all cell subpopulations in each disease state of each tissue based on the regulon specific score inferred using pySCENIC and by calculating the average expression. |
| Page: 1 |
Top |
Somatic mutation of malignant transformation related genes |
| Annotation of somatic variants for genes involved in malignant transformation |
| Hugo Symbol | Variant Class | Variant Classification | dbSNP RS | HGVSc | HGVSp | HGVSp Short | SWISSPROT | BIOTYPE | SIFT | PolyPhen | Tumor Sample Barcode | Tissue | Histology | Sex | Age | Stage | Therapy Types | Drugs | Outcome |
| KLHL7 | SNV | Missense_Mutation | c.149N>G | p.Val50Gly | p.V50G | Q8IXQ5 | protein_coding | deleterious(0) | probably_damaging(0.928) | TCGA-A8-A06R-01 | Breast | breast invasive carcinoma | Female | >=65 | I/II | Chemotherapy | 5-fluorouracil | CR | |
| KLHL7 | SNV | Missense_Mutation | c.1733N>A | p.Gly578Glu | p.G578E | Q8IXQ5 | protein_coding | deleterious_low_confidence(0.01) | probably_damaging(0.994) | TCGA-A8-A09I-01 | Breast | breast invasive carcinoma | Female | >=65 | I/II | Hormone Therapy | anastrozole | SD | |
| KLHL7 | SNV | Missense_Mutation | novel | c.1280A>G | p.Glu427Gly | p.E427G | Q8IXQ5 | protein_coding | tolerated(0.18) | probably_damaging(0.98) | TCGA-BH-A1FU-01 | Breast | breast invasive carcinoma | Female | <65 | I/II | Unknown | Unknown | PD |
| KLHL7 | SNV | Missense_Mutation | novel | c.937G>T | p.Asp313Tyr | p.D313Y | Q8IXQ5 | protein_coding | deleterious(0.01) | benign(0.363) | TCGA-D8-A1X8-01 | Breast | breast invasive carcinoma | Female | <65 | III/IV | Chemotherapy | adrimicin+cyclophosphamide | SD |
| KLHL7 | SNV | Missense_Mutation | c.1570N>T | p.Ala524Ser | p.A524S | Q8IXQ5 | protein_coding | deleterious(0.01) | probably_damaging(0.958) | TCGA-E2-A1BD-01 | Breast | breast invasive carcinoma | Female | <65 | I/II | Hormone Therapy | arimidex | SD | |
| KLHL7 | SNV | Missense_Mutation | c.1571N>T | p.Ala524Val | p.A524V | Q8IXQ5 | protein_coding | tolerated(0.16) | probably_damaging(0.932) | TCGA-E2-A1BD-01 | Breast | breast invasive carcinoma | Female | <65 | I/II | Hormone Therapy | arimidex | SD | |
| KLHL7 | SNV | Missense_Mutation | novel | c.277N>C | p.Asp93His | p.D93H | Q8IXQ5 | protein_coding | tolerated(0.12) | benign(0.291) | TCGA-EW-A3E8-01 | Breast | breast invasive carcinoma | Female | <65 | I/II | Hormone Therapy | anastrozole | SD |
| KLHL7 | SNV | Missense_Mutation | novel | c.308N>G | p.Tyr103Cys | p.Y103C | Q8IXQ5 | protein_coding | deleterious(0) | probably_damaging(0.954) | TCGA-HN-A2NL-01 | Breast | breast invasive carcinoma | Female | <65 | I/II | Chemotherapy | cyclophosphamide | SD |
| KLHL7 | SNV | Missense_Mutation | c.403G>C | p.Asp135His | p.D135H | Q8IXQ5 | protein_coding | deleterious(0.02) | possibly_damaging(0.499) | TCGA-LP-A4AV-01 | Cervix | cervical & endocervical cancer | Female | <65 | I/II | Unknown | Unknown | SD | |
| KLHL7 | SNV | Missense_Mutation | rs771084569 | c.1325N>G | p.Asn442Ser | p.N442S | Q8IXQ5 | protein_coding | tolerated(0.75) | possibly_damaging(0.839) | TCGA-AA-3685-01 | Colorectum | colon adenocarcinoma | Male | >=65 | I/II | Unknown | Unknown | SD |
| Page: 1 2 3 4 5 6 7 |
Top |
Related drugs of malignant transformation related genes |
| Identification of chemicals and drugs interact with genes involved in malignant transfromation |
| (DGIdb 4.0) |
| Entrez ID | Symbol | Category | Interaction Types | Drug Claim Name | Drug Name | PMIDs |
| Page: 1 |

Copyright 2023-Present -The University of Texas Health Science Center at Houston |