
|
|||||
|
 | |
| |
| |
| |
| |
| |
|
Gene: KLHL5 |
Gene summary for KLHL5 |
| Gene information | Species | Human | Gene symbol | KLHL5 | Gene ID | 51088 |
| Gene name | kelch like family member 5 | |
| Gene Alias | KLHL5 | |
| Cytomap | 4p14 | |
| Gene Type | protein-coding | GO ID | GO:0008150 | UniProtAcc | Q7Z6D5 |
Top |
Malignant transformation analysis |
| Identification of the aberrant gene expression in precancerous and cancerous lesions by comparing the gene expression of stem-like cells in diseased tissues with normal stem cells |
| Entrez ID | Symbol | Replicates | Species | Organ | Tissue | Adj P-value | Log2FC | Malignancy |
| 51088 | KLHL5 | LZE24T | Human | Esophagus | ESCC | 2.73e-07 | 3.02e-01 | 0.0596 |
| 51088 | KLHL5 | P2T-E | Human | Esophagus | ESCC | 1.19e-10 | 2.00e-01 | 0.1177 |
| 51088 | KLHL5 | P4T-E | Human | Esophagus | ESCC | 9.46e-14 | 1.56e-01 | 0.1323 |
| 51088 | KLHL5 | P5T-E | Human | Esophagus | ESCC | 9.32e-05 | 4.02e-02 | 0.1327 |
| 51088 | KLHL5 | P8T-E | Human | Esophagus | ESCC | 5.96e-17 | 3.67e-01 | 0.0889 |
| 51088 | KLHL5 | P9T-E | Human | Esophagus | ESCC | 7.05e-08 | 1.29e-01 | 0.1131 |
| 51088 | KLHL5 | P11T-E | Human | Esophagus | ESCC | 2.24e-06 | 3.55e-01 | 0.1426 |
| 51088 | KLHL5 | P12T-E | Human | Esophagus | ESCC | 6.60e-17 | 3.33e-01 | 0.1122 |
| 51088 | KLHL5 | P15T-E | Human | Esophagus | ESCC | 1.66e-02 | 1.51e-01 | 0.1149 |
| 51088 | KLHL5 | P16T-E | Human | Esophagus | ESCC | 7.90e-05 | 2.75e-02 | 0.1153 |
| 51088 | KLHL5 | P21T-E | Human | Esophagus | ESCC | 9.60e-03 | 5.67e-02 | 0.1617 |
| 51088 | KLHL5 | P22T-E | Human | Esophagus | ESCC | 1.36e-04 | 6.42e-02 | 0.1236 |
| 51088 | KLHL5 | P23T-E | Human | Esophagus | ESCC | 1.76e-06 | 2.90e-01 | 0.108 |
| 51088 | KLHL5 | P24T-E | Human | Esophagus | ESCC | 9.83e-03 | 5.58e-02 | 0.1287 |
| 51088 | KLHL5 | P26T-E | Human | Esophagus | ESCC | 5.11e-11 | 2.25e-01 | 0.1276 |
| 51088 | KLHL5 | P27T-E | Human | Esophagus | ESCC | 7.13e-05 | 1.38e-01 | 0.1055 |
| 51088 | KLHL5 | P30T-E | Human | Esophagus | ESCC | 3.42e-03 | 1.42e-01 | 0.137 |
| 51088 | KLHL5 | P31T-E | Human | Esophagus | ESCC | 2.66e-11 | 2.35e-01 | 0.1251 |
| 51088 | KLHL5 | P32T-E | Human | Esophagus | ESCC | 7.35e-10 | 2.54e-01 | 0.1666 |
| 51088 | KLHL5 | P36T-E | Human | Esophagus | ESCC | 1.84e-04 | 1.71e-01 | 0.1187 |
| Page: 1 2 3 4 |
| Tissue | Expression Dynamics | Abbreviation |
| Esophagus |  | ESCC: Esophageal squamous cell carcinoma |
| HGIN: High-grade intraepithelial neoplasias | ||
| LGIN: Low-grade intraepithelial neoplasias | ||
| Liver |  | HCC: Hepatocellular carcinoma |
| NAFLD: Non-alcoholic fatty liver disease | ||
| Oral Cavity | 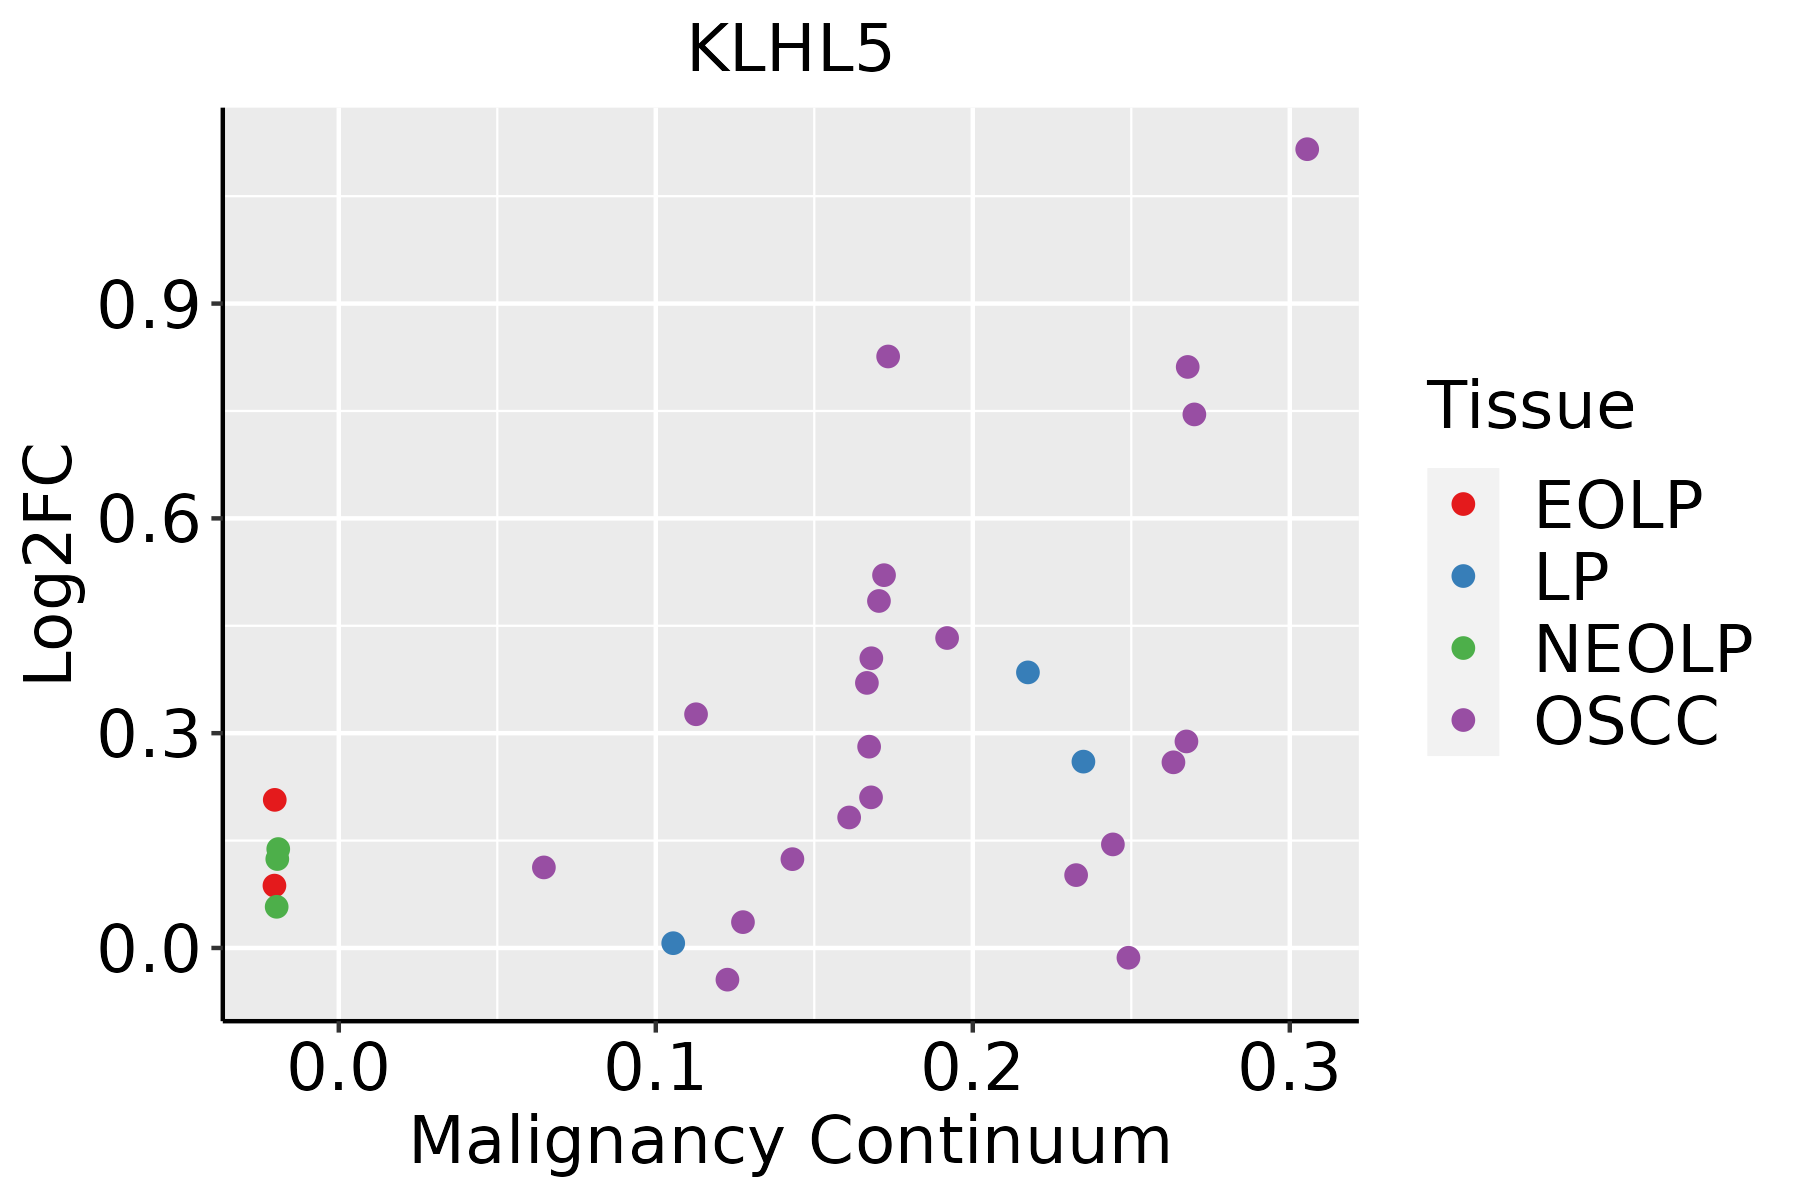 | EOLP: Erosive Oral lichen planus |
| LP: leukoplakia | ||
| NEOLP: Non-erosive oral lichen planus | ||
| OSCC: Oral squamous cell carcinoma | ||
| Thyroid | 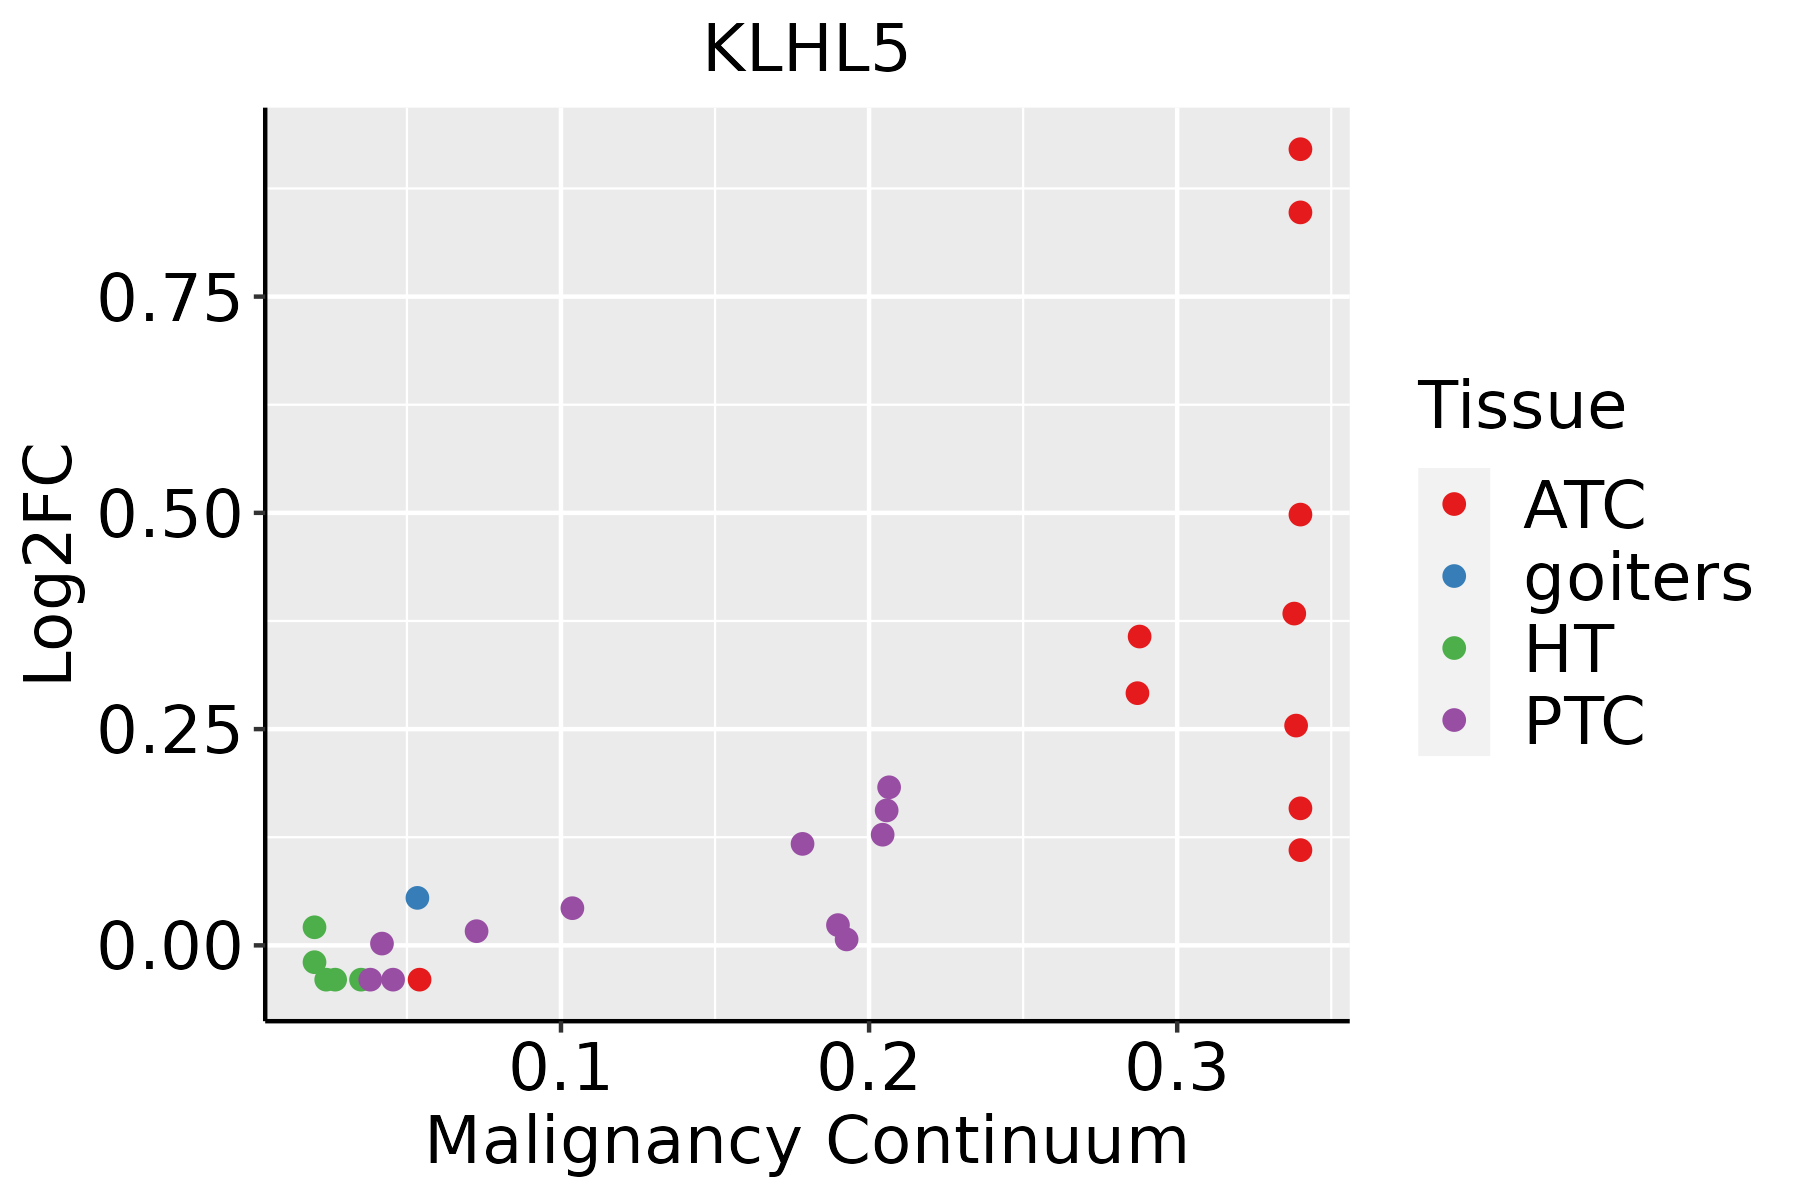 | ATC: Anaplastic thyroid cancer |
| HT: Hashimoto's thyroiditis | ||
| PTC: Papillary thyroid cancer |
| ∗log2FC in expression of this searched gene in stem-like cells from each diseased tissue sample relative to stem-like cells in normal samples in each tissue plotted against the malignancy continuum. Samples are colored based on if they are from different disease stage. |
Top |
Malignant transformation related pathway analysis |
| Find out the enriched GO biological processes and KEGG pathways involved in transition from healthy to precancer to cancer |
| Tissue | Disease Stage | Enriched GO biological Processes |
| Colorectum | AD |  |
| Colorectum | SER |  |
| Colorectum | MSS |  |
| Colorectum | MSI-H |  |
| Colorectum | FAP |  |
| ∗Top 15 enriched GO BP terms are showed in the bar plot of each disease state in each tissue. Each row represents a significant GO biological process which is colored according to the -log10(p.adjust). |
| Page: 1 2 3 4 5 6 7 8 9 |
| GO ID | Tissue | Disease Stage | Description | Gene Ratio | Bg Ratio | pvalue | p.adjust | Count |
| Page: 1 |
| Pathway ID | Tissue | Disease Stage | Description | Gene Ratio | Bg Ratio | pvalue | p.adjust | qvalue | Count |
| Page: 1 |
Top |
Cell-cell communication analysis |
| Identification of potential cell-cell interactions between two cell types and their ligand-receptor pairs for different disease states |
| Ligand | Receptor | LRpair | Pathway | Tissue | Disease Stage |
| Page: 1 |
Top |
Single-cell gene regulatory network inference analysis |
| Find out the significant the regulons (TFs) and the target genes of each regulon across cell types for different disease states |
| TF | Cell Type | Tissue | Disease Stage | Target Gene | RSS | Regulon Activity |
| ∗The dot plots of a searched regulon are shown for all cell subpopulations in each disease state of each tissue based on the regulon specific score inferred using pySCENIC and by calculating the average expression. |
| Page: 1 |
Top |
Somatic mutation of malignant transformation related genes |
| Annotation of somatic variants for genes involved in malignant transformation |
| Hugo Symbol | Variant Class | Variant Classification | dbSNP RS | HGVSc | HGVSp | HGVSp Short | SWISSPROT | BIOTYPE | SIFT | PolyPhen | Tumor Sample Barcode | Tissue | Histology | Sex | Age | Stage | Therapy Types | Drugs | Outcome |
| KLHL5 | SNV | Missense_Mutation | c.2205G>T | p.Trp735Cys | p.W735C | Q96PQ7 | protein_coding | deleterious(0) | probably_damaging(1) | TCGA-A2-A25A-01 | Breast | breast invasive carcinoma | Female | <65 | I/II | Unspecific | Cytoxan | SD | |
| KLHL5 | SNV | Missense_Mutation | novel | c.1442C>A | p.Ala481Glu | p.A481E | Q96PQ7 | protein_coding | deleterious(0.01) | possibly_damaging(0.9) | TCGA-A2-A3XT-01 | Breast | breast invasive carcinoma | Female | <65 | I/II | Chemotherapy | cyclophosphamide | PR |
| KLHL5 | SNV | Missense_Mutation | novel | c.1286N>T | p.Arg429Leu | p.R429L | Q96PQ7 | protein_coding | deleterious(0.05) | benign(0.357) | TCGA-A7-A0DB-01 | Breast | breast invasive carcinoma | Female | <65 | I/II | Hormone Therapy | arimidex | SD |
| KLHL5 | SNV | Missense_Mutation | rs201110544 | c.344G>A | p.Arg115Gln | p.R115Q | Q96PQ7 | protein_coding | tolerated_low_confidence(0.77) | benign(0) | TCGA-A8-A093-01 | Breast | breast invasive carcinoma | Female | <65 | I/II | Hormone Therapy | tamoxiphen | SD |
| KLHL5 | SNV | Missense_Mutation | rs201110544 | c.344G>A | p.Arg115Gln | p.R115Q | Q96PQ7 | protein_coding | tolerated_low_confidence(0.77) | benign(0) | TCGA-AN-A046-01 | Breast | breast invasive carcinoma | Female | >=65 | I/II | Unknown | Unknown | SD |
| KLHL5 | SNV | Missense_Mutation | c.2205N>T | p.Trp735Cys | p.W735C | Q96PQ7 | protein_coding | deleterious(0) | probably_damaging(1) | TCGA-D8-A1XL-01 | Breast | breast invasive carcinoma | Female | <65 | I/II | Chemotherapy | doxorubicine+cyclophosphamide+tamoxifen | SD | |
| KLHL5 | insertion | In_Frame_Ins | novel | c.503_504insACATTCATATATATA | p.Ser168_Asp169insHisSerTyrIleTyr | p.S168_D169insHSYIY | Q96PQ7 | protein_coding | TCGA-A8-A07Z-01 | Breast | breast invasive carcinoma | Female | >=65 | I/II | Unspecific | Exemestane | SD | ||
| KLHL5 | insertion | Frame_Shift_Ins | novel | c.779_780insTGAGATATCATTT | p.Glu260AspfsTer29 | p.E260Dfs*29 | Q96PQ7 | protein_coding | TCGA-A8-A0A1-01 | Breast | breast invasive carcinoma | Female | >=65 | I/II | Hormone Therapy | tamoxiphen | SD | ||
| KLHL5 | SNV | Missense_Mutation | rs201110544 | c.344G>A | p.Arg115Gln | p.R115Q | Q96PQ7 | protein_coding | tolerated_low_confidence(0.77) | benign(0) | TCGA-2W-A8YY-01 | Cervix | cervical & endocervical cancer | Female | <65 | I/II | Chemotherapy | cisplatin | CR |
| KLHL5 | SNV | Missense_Mutation | rs758479877 | c.676N>A | p.Ala226Thr | p.A226T | Q96PQ7 | protein_coding | deleterious(0.02) | probably_damaging(0.946) | TCGA-JX-A3Q0-01 | Cervix | cervical & endocervical cancer | Female | <65 | III/IV | Unknown | Unknown | SD |
| Page: 1 2 3 4 5 6 7 8 9 |
Top |
Related drugs of malignant transformation related genes |
| Identification of chemicals and drugs interact with genes involved in malignant transfromation |
| (DGIdb 4.0) |
| Entrez ID | Symbol | Category | Interaction Types | Drug Claim Name | Drug Name | PMIDs |
| Page: 1 |

Copyright 2023-Present -The University of Texas Health Science Center at Houston |