
|
|||||
|
 | |
| |
| |
| |
| |
| |
|
Gene: KLHL42 |
Gene summary for KLHL42 |
| Gene information | Species | Human | Gene symbol | KLHL42 | Gene ID | 57542 |
| Gene name | kelch like family member 42 | |
| Gene Alias | Ctb9 | |
| Cytomap | 12p11.22 | |
| Gene Type | protein-coding | GO ID | GO:0000209 | UniProtAcc | B2RNT7 |
Top |
Malignant transformation analysis |
| Identification of the aberrant gene expression in precancerous and cancerous lesions by comparing the gene expression of stem-like cells in diseased tissues with normal stem cells |
| Entrez ID | Symbol | Replicates | Species | Organ | Tissue | Adj P-value | Log2FC | Malignancy |
| 57542 | KLHL42 | LZE4T | Human | Esophagus | ESCC | 8.52e-04 | 1.43e-01 | 0.0811 |
| 57542 | KLHL42 | LZE7T | Human | Esophagus | ESCC | 1.57e-07 | 4.46e-01 | 0.0667 |
| 57542 | KLHL42 | LZE24T | Human | Esophagus | ESCC | 4.33e-09 | 8.16e-02 | 0.0596 |
| 57542 | KLHL42 | P2T-E | Human | Esophagus | ESCC | 2.60e-21 | 5.12e-01 | 0.1177 |
| 57542 | KLHL42 | P4T-E | Human | Esophagus | ESCC | 8.44e-14 | 3.92e-01 | 0.1323 |
| 57542 | KLHL42 | P5T-E | Human | Esophagus | ESCC | 3.78e-11 | 1.57e-01 | 0.1327 |
| 57542 | KLHL42 | P8T-E | Human | Esophagus | ESCC | 1.88e-08 | 1.86e-01 | 0.0889 |
| 57542 | KLHL42 | P9T-E | Human | Esophagus | ESCC | 1.16e-13 | 2.13e-01 | 0.1131 |
| 57542 | KLHL42 | P10T-E | Human | Esophagus | ESCC | 1.78e-13 | 3.95e-01 | 0.116 |
| 57542 | KLHL42 | P11T-E | Human | Esophagus | ESCC | 7.73e-10 | 2.05e-01 | 0.1426 |
| 57542 | KLHL42 | P12T-E | Human | Esophagus | ESCC | 1.13e-22 | 4.70e-01 | 0.1122 |
| 57542 | KLHL42 | P15T-E | Human | Esophagus | ESCC | 4.03e-12 | 3.11e-01 | 0.1149 |
| 57542 | KLHL42 | P16T-E | Human | Esophagus | ESCC | 5.34e-44 | 9.09e-01 | 0.1153 |
| 57542 | KLHL42 | P17T-E | Human | Esophagus | ESCC | 4.59e-08 | 2.55e-01 | 0.1278 |
| 57542 | KLHL42 | P19T-E | Human | Esophagus | ESCC | 7.47e-03 | 4.56e-01 | 0.1662 |
| 57542 | KLHL42 | P20T-E | Human | Esophagus | ESCC | 3.60e-16 | 4.77e-01 | 0.1124 |
| 57542 | KLHL42 | P21T-E | Human | Esophagus | ESCC | 8.19e-11 | 2.03e-01 | 0.1617 |
| 57542 | KLHL42 | P22T-E | Human | Esophagus | ESCC | 9.85e-44 | 7.27e-01 | 0.1236 |
| 57542 | KLHL42 | P23T-E | Human | Esophagus | ESCC | 1.99e-14 | 3.60e-01 | 0.108 |
| 57542 | KLHL42 | P24T-E | Human | Esophagus | ESCC | 2.31e-05 | 2.46e-01 | 0.1287 |
| Page: 1 2 3 4 5 |
| Tissue | Expression Dynamics | Abbreviation |
| Esophagus | 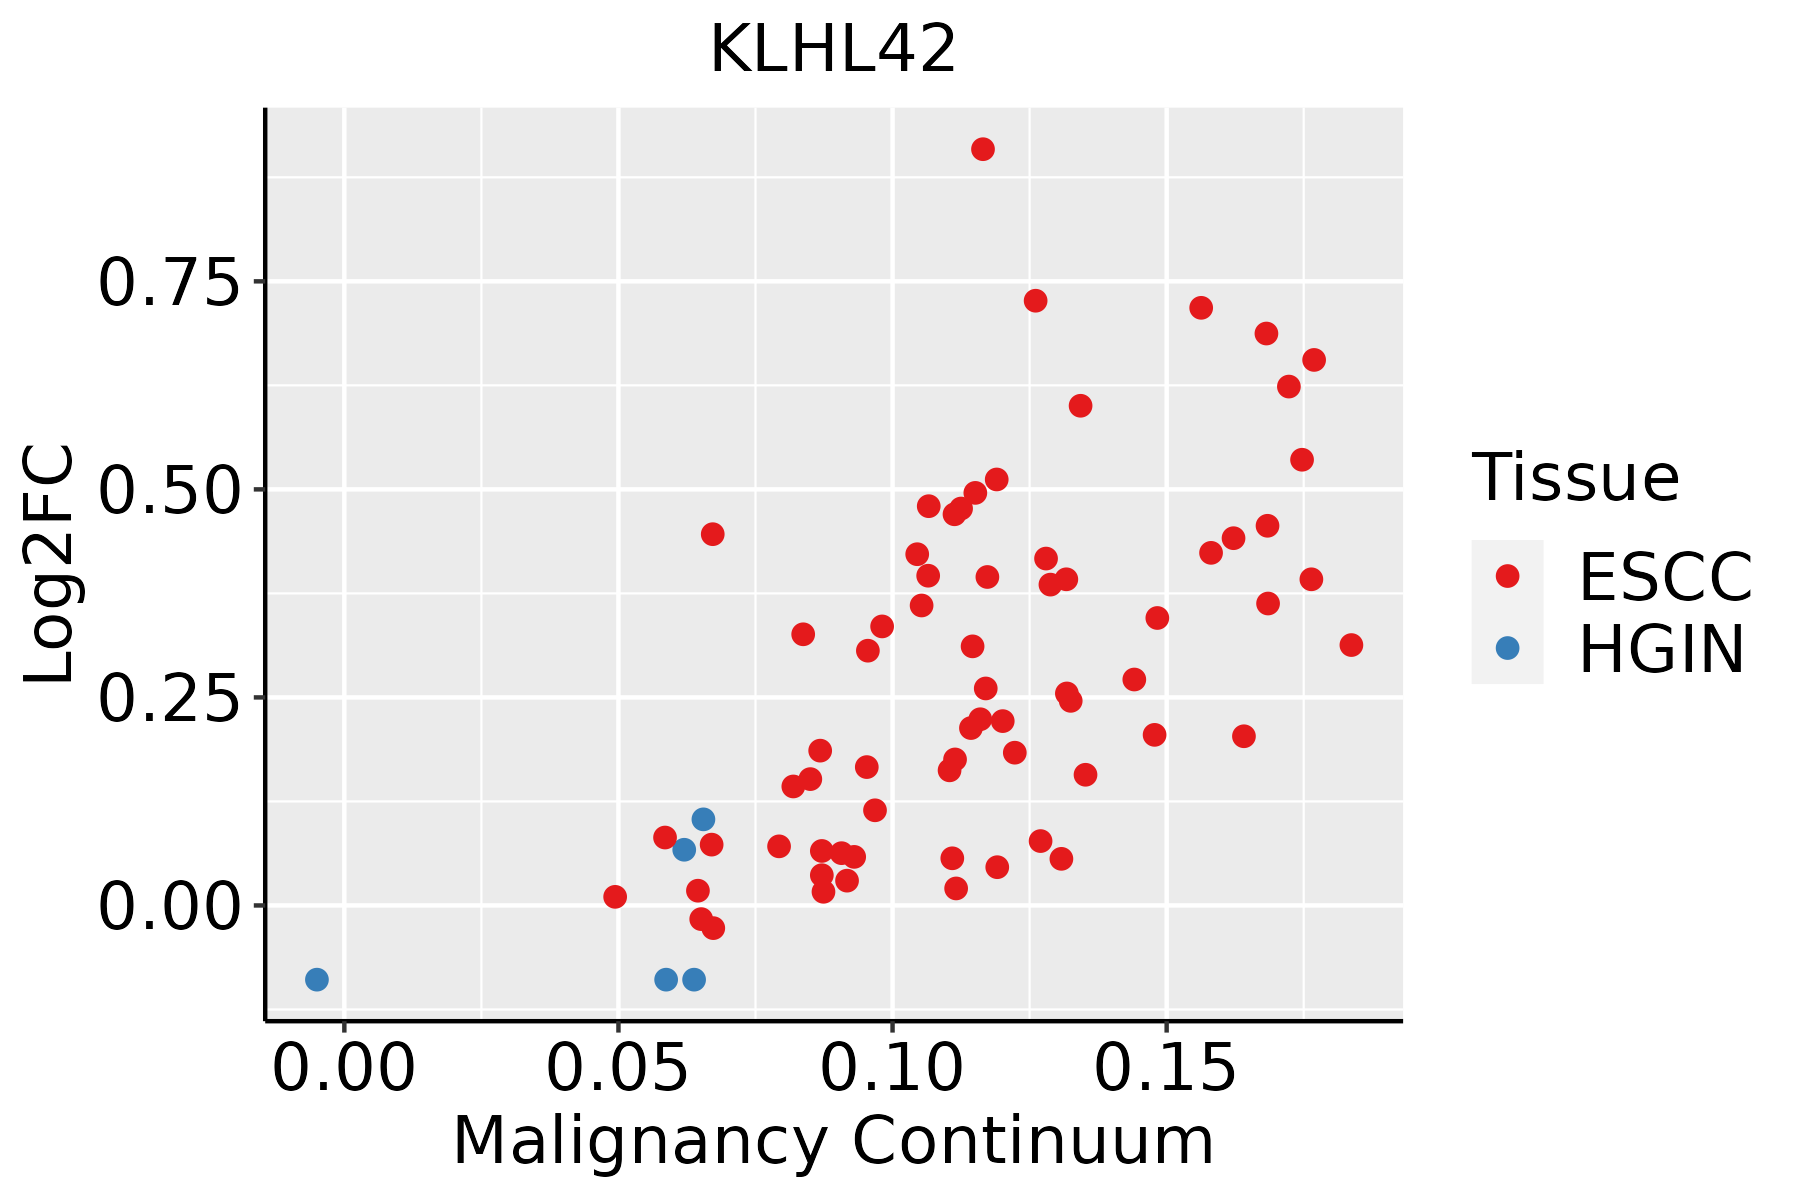 | ESCC: Esophageal squamous cell carcinoma |
| HGIN: High-grade intraepithelial neoplasias | ||
| LGIN: Low-grade intraepithelial neoplasias | ||
| Liver |  | HCC: Hepatocellular carcinoma |
| NAFLD: Non-alcoholic fatty liver disease | ||
| Oral Cavity |  | EOLP: Erosive Oral lichen planus |
| LP: leukoplakia | ||
| NEOLP: Non-erosive oral lichen planus | ||
| OSCC: Oral squamous cell carcinoma | ||
| Thyroid |  | ATC: Anaplastic thyroid cancer |
| HT: Hashimoto's thyroiditis | ||
| PTC: Papillary thyroid cancer |
| ∗log2FC in expression of this searched gene in stem-like cells from each diseased tissue sample relative to stem-like cells in normal samples in each tissue plotted against the malignancy continuum. Samples are colored based on if they are from different disease stage. |
Top |
Malignant transformation related pathway analysis |
| Find out the enriched GO biological processes and KEGG pathways involved in transition from healthy to precancer to cancer |
| Tissue | Disease Stage | Enriched GO biological Processes |
| Colorectum | AD |  |
| Colorectum | SER |  |
| Colorectum | MSS |  |
| Colorectum | MSI-H |  |
| Colorectum | FAP |  |
| ∗Top 15 enriched GO BP terms are showed in the bar plot of each disease state in each tissue. Each row represents a significant GO biological process which is colored according to the -log10(p.adjust). |
| Page: 1 2 3 4 5 6 7 8 9 |
| GO ID | Tissue | Disease Stage | Description | Gene Ratio | Bg Ratio | pvalue | p.adjust | Count |
| GO:0010498111 | Esophagus | ESCC | proteasomal protein catabolic process | 369/8552 | 490/18723 | 1.13e-41 | 1.80e-38 | 369 |
| GO:0043161111 | Esophagus | ESCC | proteasome-mediated ubiquitin-dependent protein catabolic process | 312/8552 | 412/18723 | 3.53e-36 | 4.48e-33 | 312 |
| GO:000020917 | Esophagus | ESCC | protein polyubiquitination | 170/8552 | 236/18723 | 1.40e-16 | 1.09e-14 | 170 |
| GO:00328864 | Esophagus | ESCC | regulation of microtubule-based process | 134/8552 | 240/18723 | 9.44e-04 | 4.80e-03 | 134 |
| GO:001049812 | Liver | Cirrhotic | proteasomal protein catabolic process | 216/4634 | 490/18723 | 2.52e-21 | 9.29e-19 | 216 |
| GO:004316112 | Liver | Cirrhotic | proteasome-mediated ubiquitin-dependent protein catabolic process | 184/4634 | 412/18723 | 4.52e-19 | 8.85e-17 | 184 |
| GO:000020911 | Liver | Cirrhotic | protein polyubiquitination | 89/4634 | 236/18723 | 6.09e-06 | 9.80e-05 | 89 |
| GO:001049822 | Liver | HCC | proteasomal protein catabolic process | 351/7958 | 490/18723 | 6.92e-40 | 1.46e-36 | 351 |
| GO:004316122 | Liver | HCC | proteasome-mediated ubiquitin-dependent protein catabolic process | 299/7958 | 412/18723 | 7.82e-36 | 8.27e-33 | 299 |
| GO:000020921 | Liver | HCC | protein polyubiquitination | 151/7958 | 236/18723 | 1.90e-11 | 7.59e-10 | 151 |
| GO:0032886 | Liver | HCC | regulation of microtubule-based process | 123/7958 | 240/18723 | 3.69e-03 | 1.64e-02 | 123 |
| GO:001049820 | Oral cavity | OSCC | proteasomal protein catabolic process | 336/7305 | 490/18723 | 5.45e-41 | 8.63e-38 | 336 |
| GO:004316120 | Oral cavity | OSCC | proteasome-mediated ubiquitin-dependent protein catabolic process | 285/7305 | 412/18723 | 5.68e-36 | 5.99e-33 | 285 |
| GO:000020910 | Oral cavity | OSCC | protein polyubiquitination | 150/7305 | 236/18723 | 1.59e-14 | 9.27e-13 | 150 |
| GO:00328863 | Oral cavity | OSCC | regulation of microtubule-based process | 115/7305 | 240/18723 | 2.95e-03 | 1.28e-02 | 115 |
| GO:0010498113 | Thyroid | PTC | proteasomal protein catabolic process | 297/5968 | 490/18723 | 4.58e-40 | 9.63e-37 | 297 |
| GO:0043161113 | Thyroid | PTC | proteasome-mediated ubiquitin-dependent protein catabolic process | 254/5968 | 412/18723 | 3.91e-36 | 4.54e-33 | 254 |
| GO:000020920 | Thyroid | PTC | protein polyubiquitination | 128/5968 | 236/18723 | 7.81e-13 | 3.65e-11 | 128 |
| GO:00328866 | Thyroid | PTC | regulation of microtubule-based process | 105/5968 | 240/18723 | 6.91e-05 | 6.03e-04 | 105 |
| GO:001049832 | Thyroid | ATC | proteasomal protein catabolic process | 309/6293 | 490/18723 | 1.78e-41 | 1.13e-37 | 309 |
| Page: 1 2 |
| Pathway ID | Tissue | Disease Stage | Description | Gene Ratio | Bg Ratio | pvalue | p.adjust | qvalue | Count |
| Page: 1 |
Top |
Cell-cell communication analysis |
| Identification of potential cell-cell interactions between two cell types and their ligand-receptor pairs for different disease states |
| Ligand | Receptor | LRpair | Pathway | Tissue | Disease Stage |
| Page: 1 |
Top |
Single-cell gene regulatory network inference analysis |
| Find out the significant the regulons (TFs) and the target genes of each regulon across cell types for different disease states |
| TF | Cell Type | Tissue | Disease Stage | Target Gene | RSS | Regulon Activity |
| ∗The dot plots of a searched regulon are shown for all cell subpopulations in each disease state of each tissue based on the regulon specific score inferred using pySCENIC and by calculating the average expression. |
| Page: 1 |
Top |
Somatic mutation of malignant transformation related genes |
| Annotation of somatic variants for genes involved in malignant transformation |
| Hugo Symbol | Variant Class | Variant Classification | dbSNP RS | HGVSc | HGVSp | HGVSp Short | SWISSPROT | BIOTYPE | SIFT | PolyPhen | Tumor Sample Barcode | Tissue | Histology | Sex | Age | Stage | Therapy Types | Drugs | Outcome |
| KLHL42 | SNV | Missense_Mutation | novel | c.1060N>G | p.Thr354Ala | p.T354A | Q9P2K6 | protein_coding | tolerated(0.4) | benign(0) | TCGA-E9-A2JS-01 | Breast | breast invasive carcinoma | Female | >=65 | I/II | Chemotherapy | cyclophosphamide | PD |
| KLHL42 | deletion | Frame_Shift_Del | rs771013017 | c.1188delN | p.Cys399ValfsTer44 | p.C399Vfs*44 | Q9P2K6 | protein_coding | TCGA-A8-A09Z-01 | Breast | breast invasive carcinoma | Female | >=65 | I/II | Unknown | Unknown | SD | ||
| KLHL42 | insertion | Frame_Shift_Ins | rs749194179 | c.1187_1188insG | p.Cys399ValfsTer43 | p.C399Vfs*43 | Q9P2K6 | protein_coding | TCGA-AR-A0TY-01 | Breast | breast invasive carcinoma | Female | <65 | I/II | Unspecific | Paclitaxel | PD | ||
| KLHL42 | SNV | Missense_Mutation | c.882N>G | p.Phe294Leu | p.F294L | Q9P2K6 | protein_coding | deleterious(0.04) | benign(0.048) | TCGA-C5-A1BK-01 | Cervix | cervical & endocervical cancer | Female | <65 | I/II | Unknown | Unknown | SD | |
| KLHL42 | SNV | Missense_Mutation | c.549N>C | p.Gln183His | p.Q183H | Q9P2K6 | protein_coding | tolerated(0.15) | possibly_damaging(0.707) | TCGA-EK-A3GK-01 | Cervix | cervical & endocervical cancer | Female | <65 | I/II | Unknown | Unknown | SD | |
| KLHL42 | SNV | Missense_Mutation | rs201570618 | c.1252G>A | p.Val418Met | p.V418M | Q9P2K6 | protein_coding | deleterious(0) | probably_damaging(0.962) | TCGA-AA-3492-01 | Colorectum | colon adenocarcinoma | Female | >=65 | I/II | Unknown | Unknown | SD |
| KLHL42 | SNV | Missense_Mutation | c.1451N>A | p.Arg484His | p.R484H | Q9P2K6 | protein_coding | tolerated(0.08) | probably_damaging(0.959) | TCGA-AA-3811-01 | Colorectum | colon adenocarcinoma | Female | >=65 | III/IV | Unknown | Unknown | PD | |
| KLHL42 | SNV | Missense_Mutation | novel | c.928N>A | p.Ala310Thr | p.A310T | Q9P2K6 | protein_coding | tolerated(0.53) | benign(0.015) | TCGA-AA-3949-01 | Colorectum | colon adenocarcinoma | Female | >=65 | III/IV | Unknown | Unknown | SD |
| KLHL42 | SNV | Missense_Mutation | c.1003N>A | p.Ala335Thr | p.A335T | Q9P2K6 | protein_coding | tolerated(0.63) | benign(0.099) | TCGA-AD-5900-01 | Colorectum | colon adenocarcinoma | Male | >=65 | I/II | Unknown | Unknown | SD | |
| KLHL42 | SNV | Missense_Mutation | novel | c.1297G>A | p.Glu433Lys | p.E433K | Q9P2K6 | protein_coding | tolerated(0.07) | possibly_damaging(0.76) | TCGA-AG-A01J-01 | Colorectum | rectum adenocarcinoma | Female | <65 | I/II | Unknown | Unknown | SD |
| Page: 1 2 3 4 5 6 |
Top |
Related drugs of malignant transformation related genes |
| Identification of chemicals and drugs interact with genes involved in malignant transfromation |
| (DGIdb 4.0) |
| Entrez ID | Symbol | Category | Interaction Types | Drug Claim Name | Drug Name | PMIDs |
| Page: 1 |

Copyright 2023-Present -The University of Texas Health Science Center at Houston |