
|
|||||
|
 | |
| |
| |
| |
| |
| |
|
Gene: KLHL41 |
Gene summary for KLHL41 |
| Gene information | Species | Human | Gene symbol | KLHL41 | Gene ID | 10324 |
| Gene name | kelch like family member 41 | |
| Gene Alias | KBTBD10 | |
| Cytomap | 2q31.1 | |
| Gene Type | protein-coding | GO ID | GO:0003008 | UniProtAcc | O60662 |
Top |
Malignant transformation analysis |
| Identification of the aberrant gene expression in precancerous and cancerous lesions by comparing the gene expression of stem-like cells in diseased tissues with normal stem cells |
| Entrez ID | Symbol | Replicates | Species | Organ | Tissue | Adj P-value | Log2FC | Malignancy |
| 10324 | KLHL41 | C08 | Human | Oral cavity | OSCC | 3.50e-02 | -2.98e-01 | 0.1919 |
| 10324 | KLHL41 | LP16 | Human | Oral cavity | LP | 9.63e-03 | 6.56e-01 | 0.1055 |
| 10324 | KLHL41 | EOLP-2 | Human | Oral cavity | EOLP | 1.77e-03 | -2.98e-01 | -0.0203 |
| 10324 | KLHL41 | NEOLP-1 | Human | Oral cavity | NEOLP | 3.50e-02 | -2.97e-01 | -0.0194 |
| 10324 | KLHL41 | NEOLP-2 | Human | Oral cavity | NEOLP | 3.50e-02 | -2.96e-01 | -0.0196 |
| 10324 | KLHL41 | SYSMH1 | Human | Oral cavity | OSCC | 3.50e-02 | -2.98e-01 | 0.1127 |
| 10324 | KLHL41 | SYSMH3 | Human | Oral cavity | OSCC | 3.76e-02 | -2.54e-01 | 0.2442 |
| 10324 | KLHL41 | SYSMH4 | Human | Oral cavity | OSCC | 1.14e-02 | -2.97e-01 | 0.1226 |
| Page: 1 |
| Tissue | Expression Dynamics | Abbreviation |
| Oral Cavity | 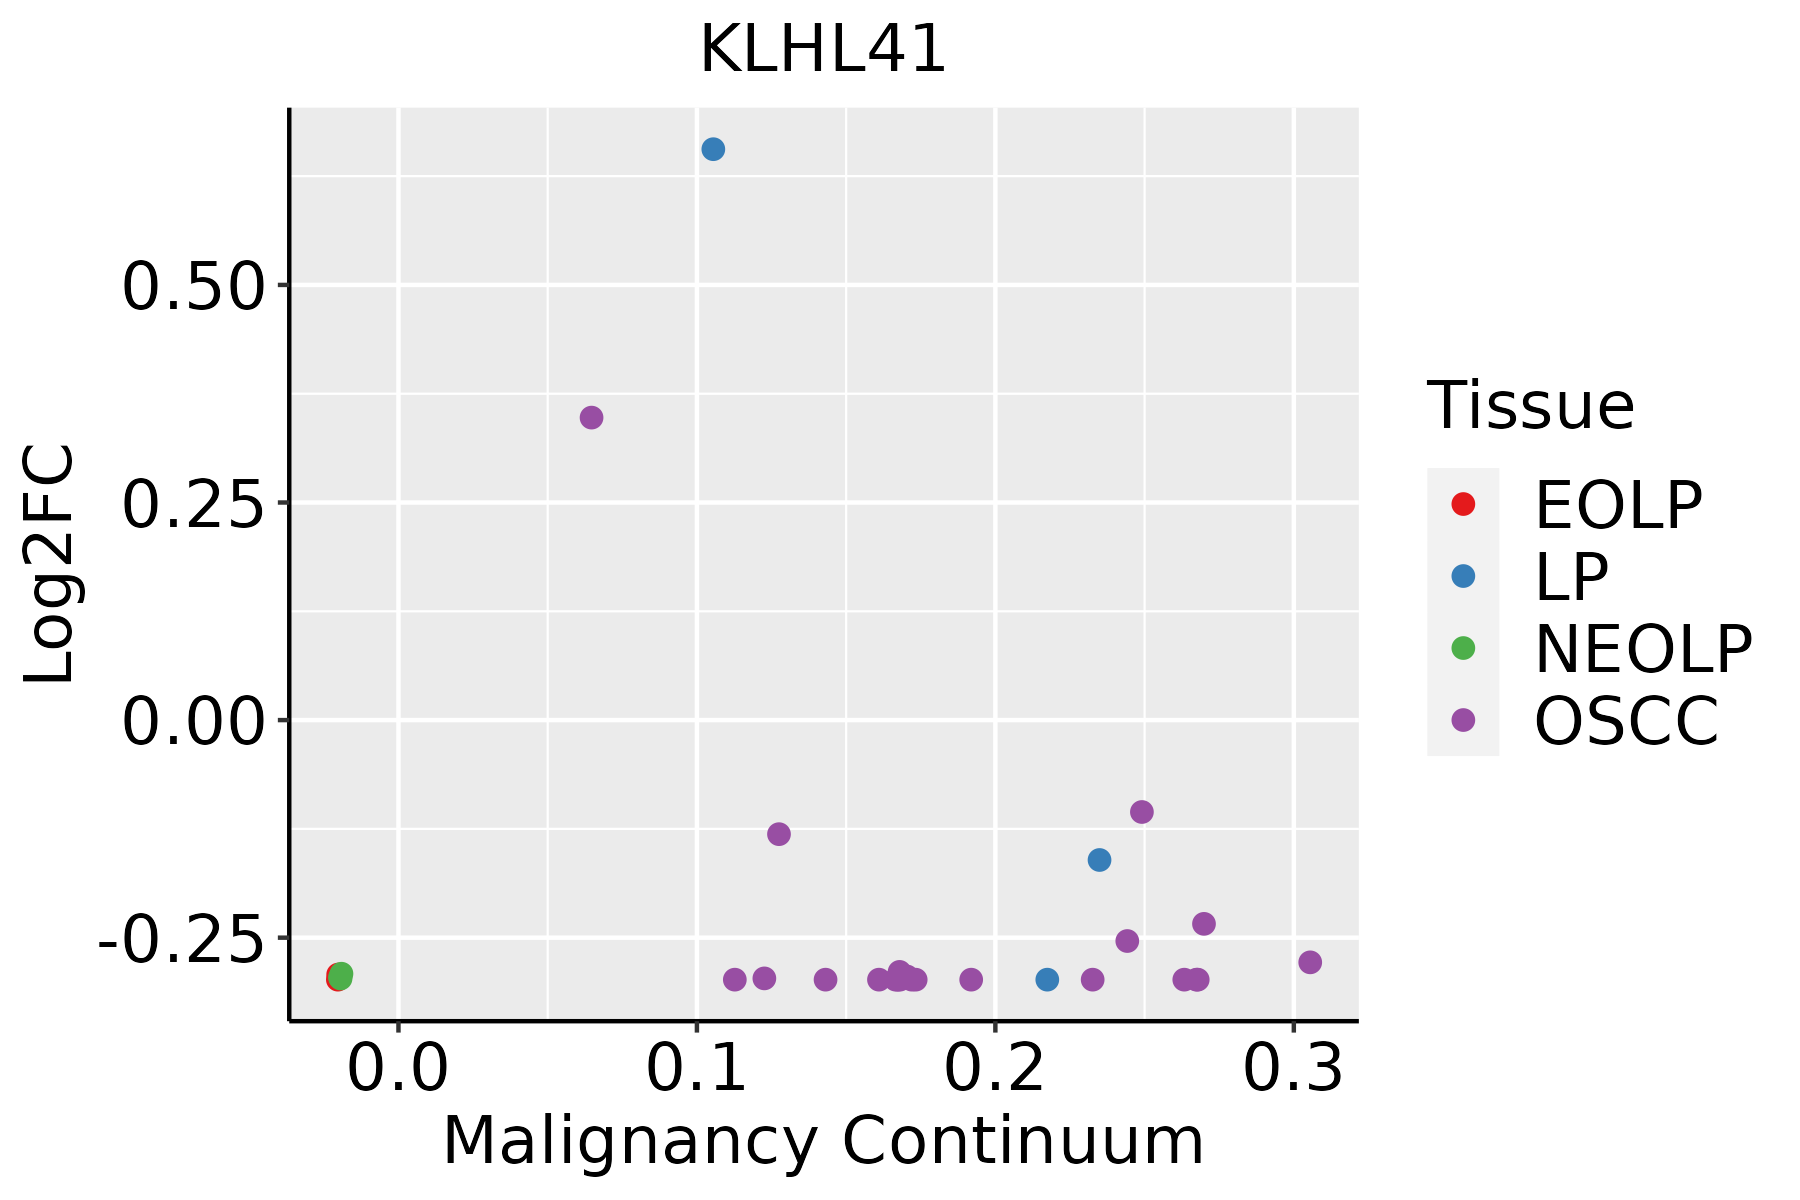 | EOLP: Erosive Oral lichen planus |
| LP: leukoplakia | ||
| NEOLP: Non-erosive oral lichen planus | ||
| OSCC: Oral squamous cell carcinoma |
| ∗log2FC in expression of this searched gene in stem-like cells from each diseased tissue sample relative to stem-like cells in normal samples in each tissue plotted against the malignancy continuum. Samples are colored based on if they are from different disease stage. |
Top |
Malignant transformation related pathway analysis |
| Find out the enriched GO biological processes and KEGG pathways involved in transition from healthy to precancer to cancer |
| Tissue | Disease Stage | Enriched GO biological Processes |
| Colorectum | AD |  |
| Colorectum | SER |  |
| Colorectum | MSS |  |
| Colorectum | MSI-H |  |
| Colorectum | FAP |  |
| ∗Top 15 enriched GO BP terms are showed in the bar plot of each disease state in each tissue. Each row represents a significant GO biological process which is colored according to the -log10(p.adjust). |
| Page: 1 2 3 4 5 6 7 8 9 |
| GO ID | Tissue | Disease Stage | Description | Gene Ratio | Bg Ratio | pvalue | p.adjust | Count |
| GO:00454453 | Oral cavity | OSCC | myoblast differentiation | 46/7305 | 84/18723 | 2.43e-03 | 1.07e-02 | 46 |
| GO:00605378 | Oral cavity | OSCC | muscle tissue development | 185/7305 | 403/18723 | 2.60e-03 | 1.14e-02 | 185 |
| GO:00426927 | Oral cavity | OSCC | muscle cell differentiation | 175/7305 | 384/18723 | 4.79e-03 | 1.92e-02 | 175 |
| GO:00147067 | Oral cavity | OSCC | striated muscle tissue development | 174/7305 | 384/18723 | 6.45e-03 | 2.40e-02 | 174 |
| GO:003103217 | Oral cavity | OSCC | actomyosin structure organization | 93/7305 | 196/18723 | 9.63e-03 | 3.41e-02 | 93 |
| GO:004544512 | Oral cavity | LP | myoblast differentiation | 35/4623 | 84/18723 | 4.56e-04 | 4.33e-03 | 35 |
| GO:0045661 | Oral cavity | LP | regulation of myoblast differentiation | 22/4623 | 51/18723 | 2.96e-03 | 2.03e-02 | 22 |
| GO:004269214 | Oral cavity | EOLP | muscle cell differentiation | 77/2218 | 384/18723 | 2.18e-06 | 4.91e-05 | 77 |
| GO:006053715 | Oral cavity | EOLP | muscle tissue development | 77/2218 | 403/18723 | 1.37e-05 | 2.31e-04 | 77 |
| GO:00511467 | Oral cavity | EOLP | striated muscle cell differentiation | 57/2218 | 283/18723 | 3.82e-05 | 5.25e-04 | 57 |
| GO:001470614 | Oral cavity | EOLP | striated muscle tissue development | 72/2218 | 384/18723 | 4.87e-05 | 6.43e-04 | 72 |
| GO:00605384 | Oral cavity | EOLP | skeletal muscle organ development | 35/2218 | 166/18723 | 4.65e-04 | 4.08e-03 | 35 |
| GO:003103218 | Oral cavity | EOLP | actomyosin structure organization | 39/2218 | 196/18723 | 7.64e-04 | 6.12e-03 | 39 |
| GO:00075195 | Oral cavity | EOLP | skeletal muscle tissue development | 32/2218 | 155/18723 | 1.15e-03 | 8.37e-03 | 32 |
| GO:00075176 | Oral cavity | EOLP | muscle organ development | 57/2218 | 327/18723 | 1.76e-03 | 1.15e-02 | 57 |
| GO:00550013 | Oral cavity | EOLP | muscle cell development | 34/2218 | 184/18723 | 5.53e-03 | 2.86e-02 | 34 |
| GO:00030128 | Oral cavity | EOLP | muscle system process | 71/2218 | 452/18723 | 7.83e-03 | 3.73e-02 | 71 |
| GO:006053723 | Oral cavity | NEOLP | muscle tissue development | 75/2005 | 403/18723 | 1.22e-06 | 3.15e-05 | 75 |
| GO:003103224 | Oral cavity | NEOLP | actomyosin structure organization | 44/2005 | 196/18723 | 1.42e-06 | 3.58e-05 | 44 |
| GO:004269221 | Oral cavity | NEOLP | muscle cell differentiation | 71/2005 | 384/18723 | 2.97e-06 | 6.76e-05 | 71 |
| Page: 1 2 |
| Pathway ID | Tissue | Disease Stage | Description | Gene Ratio | Bg Ratio | pvalue | p.adjust | qvalue | Count |
| Page: 1 |
Top |
Cell-cell communication analysis |
| Identification of potential cell-cell interactions between two cell types and their ligand-receptor pairs for different disease states |
| Ligand | Receptor | LRpair | Pathway | Tissue | Disease Stage |
| Page: 1 |
Top |
Single-cell gene regulatory network inference analysis |
| Find out the significant the regulons (TFs) and the target genes of each regulon across cell types for different disease states |
| TF | Cell Type | Tissue | Disease Stage | Target Gene | RSS | Regulon Activity |
| ∗The dot plots of a searched regulon are shown for all cell subpopulations in each disease state of each tissue based on the regulon specific score inferred using pySCENIC and by calculating the average expression. |
| Page: 1 |
Top |
Somatic mutation of malignant transformation related genes |
| Annotation of somatic variants for genes involved in malignant transformation |
| Hugo Symbol | Variant Class | Variant Classification | dbSNP RS | HGVSc | HGVSp | HGVSp Short | SWISSPROT | BIOTYPE | SIFT | PolyPhen | Tumor Sample Barcode | Tissue | Histology | Sex | Age | Stage | Therapy Types | Drugs | Outcome |
| KLHL41 | SNV | Missense_Mutation | c.880G>A | p.Asp294Asn | p.D294N | O60662 | protein_coding | tolerated(0.17) | benign(0.022) | TCGA-A8-A08J-01 | Breast | breast invasive carcinoma | Female | <65 | III/IV | Unknown | Unknown | PD | |
| KLHL41 | SNV | Missense_Mutation | novel | c.272N>C | p.Leu91Pro | p.L91P | O60662 | protein_coding | deleterious(0) | probably_damaging(0.995) | TCGA-A8-A08S-01 | Breast | breast invasive carcinoma | Female | >=65 | I/II | Hormone Therapy | anastrozole | SD |
| KLHL41 | SNV | Missense_Mutation | c.1762N>T | p.Ala588Ser | p.A588S | O60662 | protein_coding | tolerated(0.15) | possibly_damaging(0.852) | TCGA-B6-A0RG-01 | Breast | breast invasive carcinoma | Female | <65 | I/II | Unknown | Unknown | SD | |
| KLHL41 | SNV | Missense_Mutation | c.289N>C | p.Asp97His | p.D97H | O60662 | protein_coding | deleterious(0.04) | probably_damaging(0.979) | TCGA-BH-A18J-01 | Breast | breast invasive carcinoma | Female | <65 | III/IV | Unknown | Unknown | PD | |
| KLHL41 | SNV | Missense_Mutation | c.191C>G | p.Ser64Cys | p.S64C | O60662 | protein_coding | deleterious(0) | probably_damaging(0.989) | TCGA-BH-A18U-01 | Breast | breast invasive carcinoma | Female | >=65 | III/IV | Unknown | Unknown | SD | |
| KLHL41 | SNV | Missense_Mutation | rs769145348 | c.598N>C | p.Val200Leu | p.V200L | O60662 | protein_coding | tolerated(0.77) | benign(0.034) | TCGA-BH-A18V-01 | Breast | breast invasive carcinoma | Female | <65 | I/II | Unknown | Unknown | SD |
| KLHL41 | SNV | Missense_Mutation | c.376N>T | p.Leu126Phe | p.L126F | O60662 | protein_coding | deleterious(0) | probably_damaging(0.999) | TCGA-EK-A2RK-01 | Cervix | cervical & endocervical cancer | Female | >=65 | I/II | Unknown | Unknown | SD | |
| KLHL41 | SNV | Missense_Mutation | rs146806979 | c.1412A>G | p.Lys471Arg | p.K471R | O60662 | protein_coding | tolerated(0.09) | benign(0.086) | TCGA-AD-5900-01 | Colorectum | colon adenocarcinoma | Male | >=65 | I/II | Unknown | Unknown | SD |
| KLHL41 | SNV | Missense_Mutation | c.27N>T | p.Glu9Asp | p.E9D | O60662 | protein_coding | tolerated(0.12) | benign(0.047) | TCGA-AG-A002-01 | Colorectum | rectum adenocarcinoma | Male | <65 | I/II | Unknown | Unknown | SD | |
| KLHL41 | SNV | Missense_Mutation | rs151212497 | c.206N>T | p.Ala69Val | p.A69V | O60662 | protein_coding | tolerated(0.31) | benign(0.096) | TCGA-AG-A002-01 | Colorectum | rectum adenocarcinoma | Male | <65 | I/II | Unknown | Unknown | SD |
| Page: 1 2 3 4 5 6 7 8 9 |
Top |
Related drugs of malignant transformation related genes |
| Identification of chemicals and drugs interact with genes involved in malignant transfromation |
| (DGIdb 4.0) |
| Entrez ID | Symbol | Category | Interaction Types | Drug Claim Name | Drug Name | PMIDs |
| Page: 1 |

Copyright 2023-Present -The University of Texas Health Science Center at Houston |