
|
|||||
|
 | |
| |
| |
| |
| |
| |
|
Gene: KLHL29 |
Gene summary for KLHL29 |
| Gene information | Species | Human | Gene symbol | KLHL29 | Gene ID | 114818 |
| Gene name | kelch like family member 29 | |
| Gene Alias | KBTBD9 | |
| Cytomap | 2p24.1 | |
| Gene Type | protein-coding | GO ID | GO:0003674 | UniProtAcc | Q96CT2 |
Top |
Malignant transformation analysis |
| Identification of the aberrant gene expression in precancerous and cancerous lesions by comparing the gene expression of stem-like cells in diseased tissues with normal stem cells |
| Entrez ID | Symbol | Replicates | Species | Organ | Tissue | Adj P-value | Log2FC | Malignancy |
| 114818 | KLHL29 | HTA11_347_2000001011 | Human | Colorectum | AD | 3.10e-03 | 1.73e-02 | -0.1954 |
| 114818 | KLHL29 | HTA11_696_2000001011 | Human | Colorectum | AD | 1.84e-05 | 2.81e-01 | -0.1464 |
| 114818 | KLHL29 | HTA11_866_3004761011 | Human | Colorectum | AD | 9.54e-10 | 3.76e-01 | 0.096 |
| 114818 | KLHL29 | HTA11_10711_2000001011 | Human | Colorectum | AD | 1.06e-03 | 2.49e-01 | 0.0338 |
| 114818 | KLHL29 | HTA11_6818_2000001011 | Human | Colorectum | AD | 4.04e-02 | 4.87e-01 | 0.0112 |
| 114818 | KLHL29 | HTA11_6818_2000001021 | Human | Colorectum | AD | 5.13e-06 | 5.62e-01 | 0.0588 |
| 114818 | KLHL29 | HTA11_99999970781_79442 | Human | Colorectum | MSS | 7.18e-03 | 2.41e-01 | 0.294 |
| 114818 | KLHL29 | HTA11_99999971662_82457 | Human | Colorectum | MSS | 3.17e-22 | 6.81e-01 | 0.3859 |
| 114818 | KLHL29 | CRC-3-11773 | Human | Colorectum | CRC | 7.90e-11 | 4.89e-01 | 0.2564 |
| 114818 | KLHL29 | RNA-P25T1-P25T1-1 | Human | Lung | AIS | 2.30e-08 | 5.45e-01 | -0.2116 |
| 114818 | KLHL29 | RNA-P25T1-P25T1-4 | Human | Lung | AIS | 1.72e-10 | 6.94e-01 | -0.2119 |
| 114818 | KLHL29 | RNA-P6T2-P6T2-2 | Human | Lung | IAC | 7.30e-09 | 3.97e-01 | -0.0132 |
| 114818 | KLHL29 | RNA-P6T2-P6T2-3 | Human | Lung | IAC | 4.78e-13 | 4.67e-01 | -0.013 |
| 114818 | KLHL29 | RNA-P6T2-P6T2-4 | Human | Lung | IAC | 5.57e-05 | 3.41e-01 | -0.0121 |
| 114818 | KLHL29 | RNA-P7T1-P7T1-1 | Human | Lung | AIS | 2.95e-03 | 5.12e-01 | -0.0961 |
| 114818 | KLHL29 | HTA12-15-2 | Human | Pancreas | PDAC | 4.41e-04 | 2.83e-01 | 0.2315 |
| 114818 | KLHL29 | HTA12-23-1 | Human | Pancreas | PDAC | 2.93e-09 | 8.35e-01 | 0.3405 |
| 114818 | KLHL29 | HTA12-25-1 | Human | Pancreas | PDAC | 2.41e-10 | 7.39e-01 | 0.313 |
| 114818 | KLHL29 | HTA12-26-1 | Human | Pancreas | PDAC | 3.27e-24 | 1.01e+00 | 0.3728 |
| 114818 | KLHL29 | HTA12-29-1 | Human | Pancreas | PDAC | 3.68e-32 | 6.95e-01 | 0.3722 |
| Page: 1 2 |
| Tissue | Expression Dynamics | Abbreviation |
| Colorectum (GSE201348) |  | FAP: Familial adenomatous polyposis |
| CRC: Colorectal cancer | ||
| Colorectum (HTA11) | 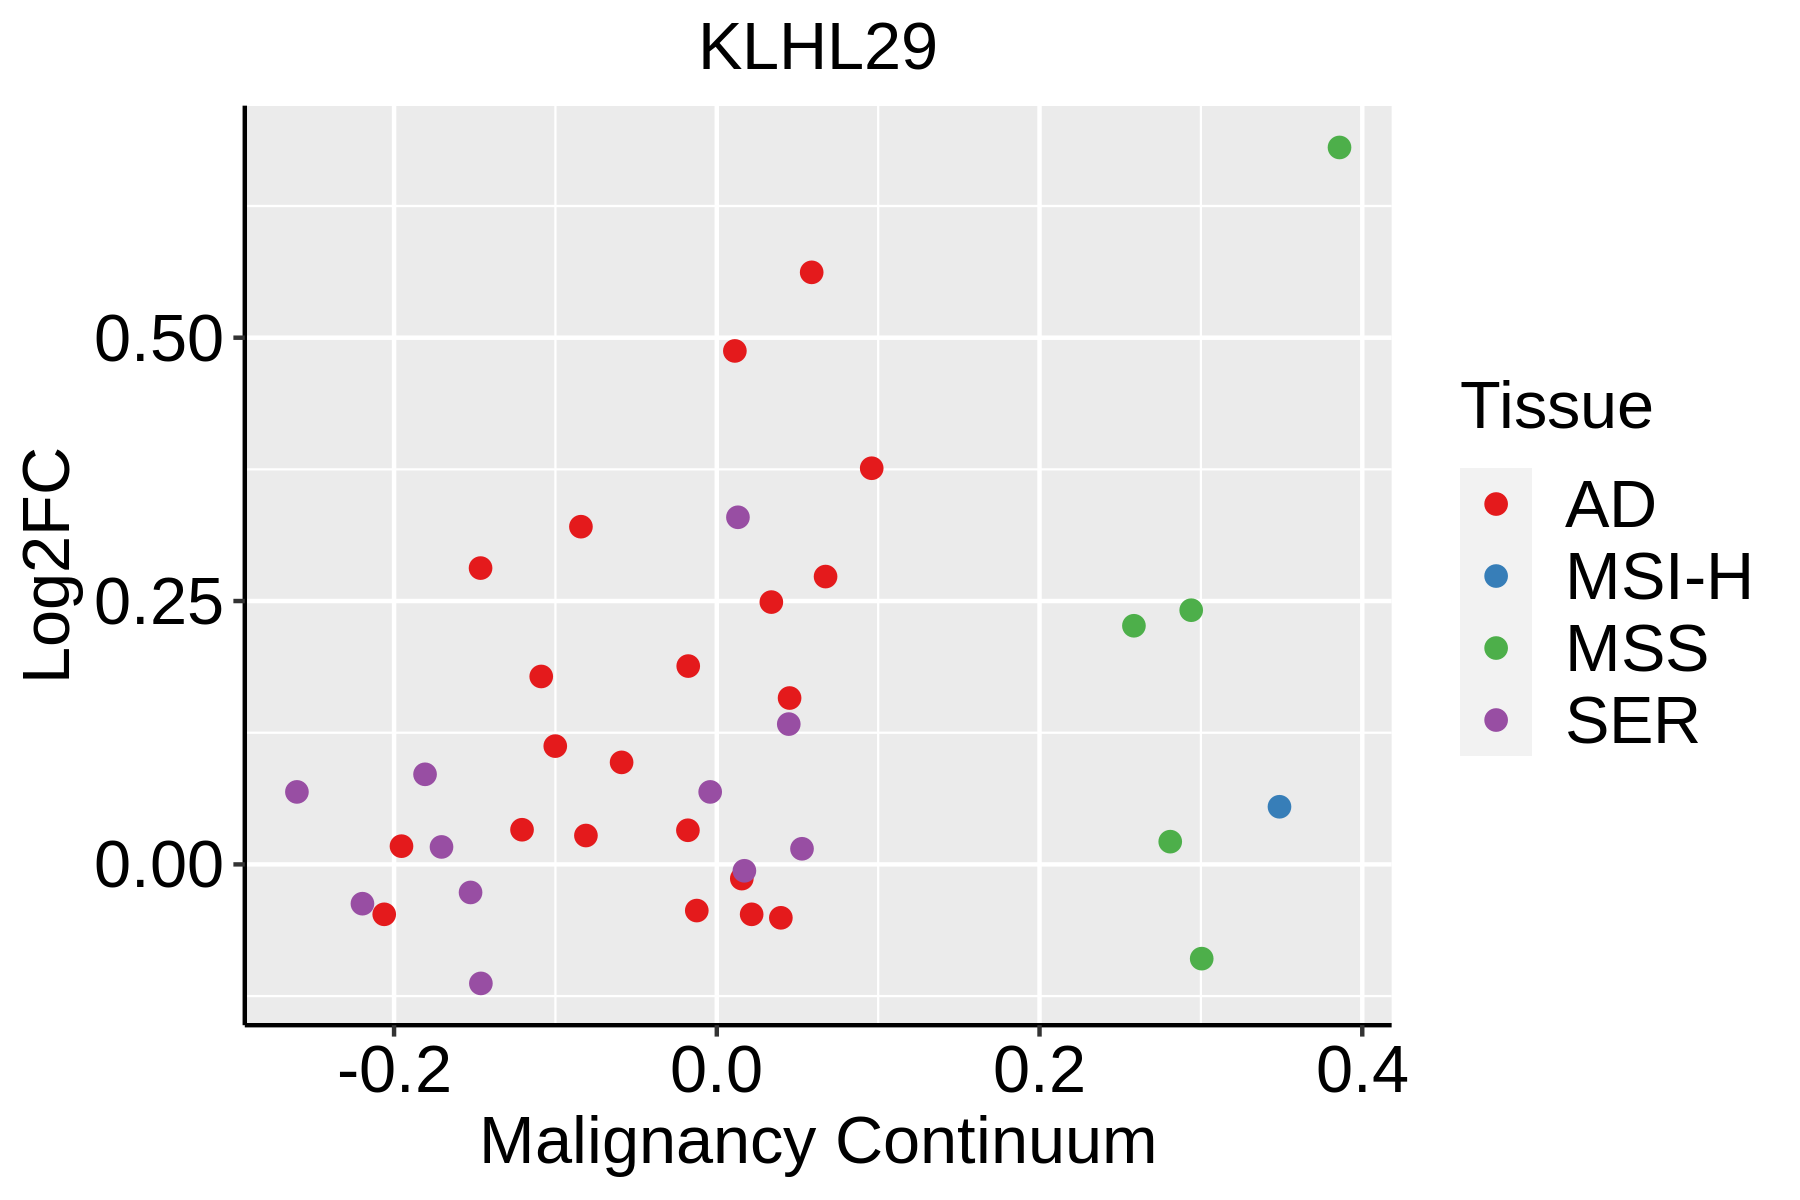 | AD: Adenomas |
| SER: Sessile serrated lesions | ||
| MSI-H: Microsatellite-high colorectal cancer | ||
| MSS: Microsatellite stable colorectal cancer | ||
| Lung | 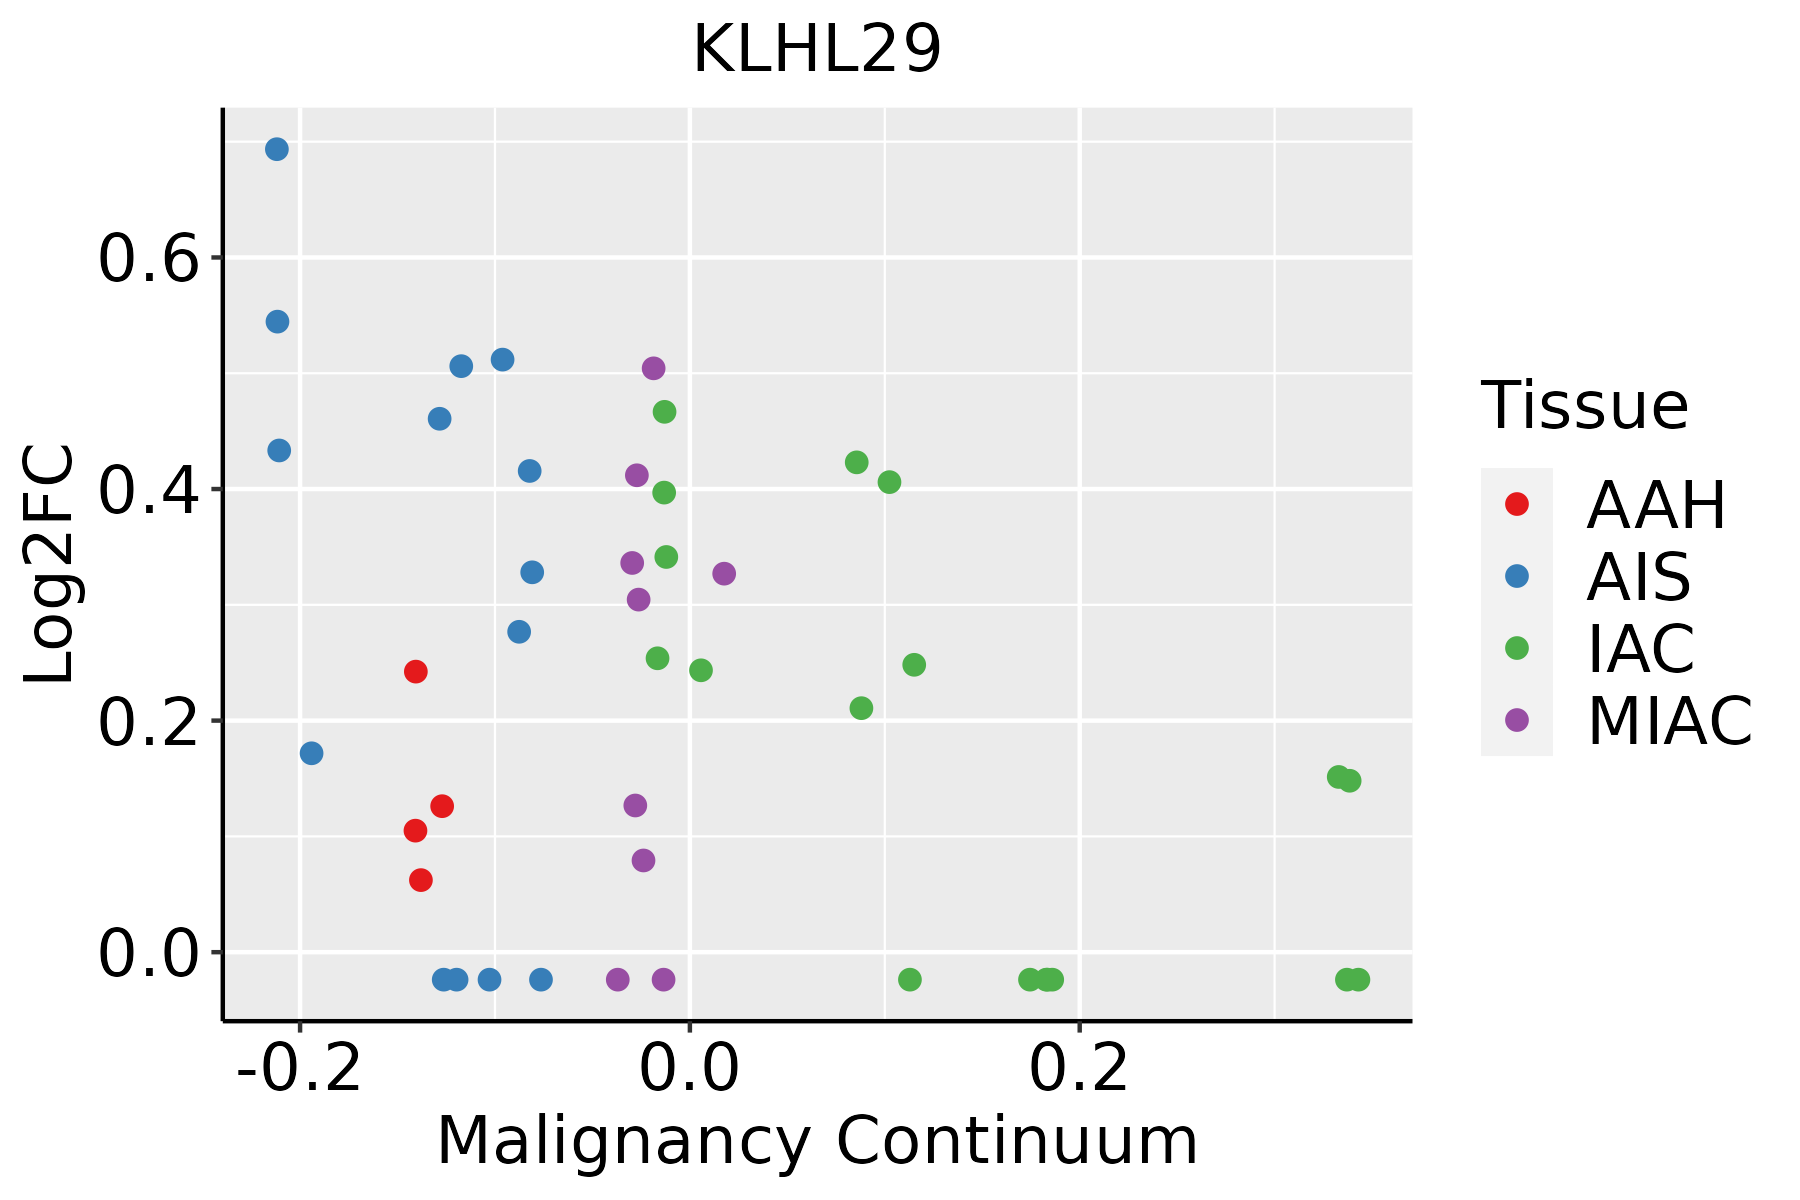 | AAH: Atypical adenomatous hyperplasia |
| AIS: Adenocarcinoma in situ | ||
| IAC: Invasive lung adenocarcinoma | ||
| MIA: Minimally invasive adenocarcinoma | ||
| Prostate | 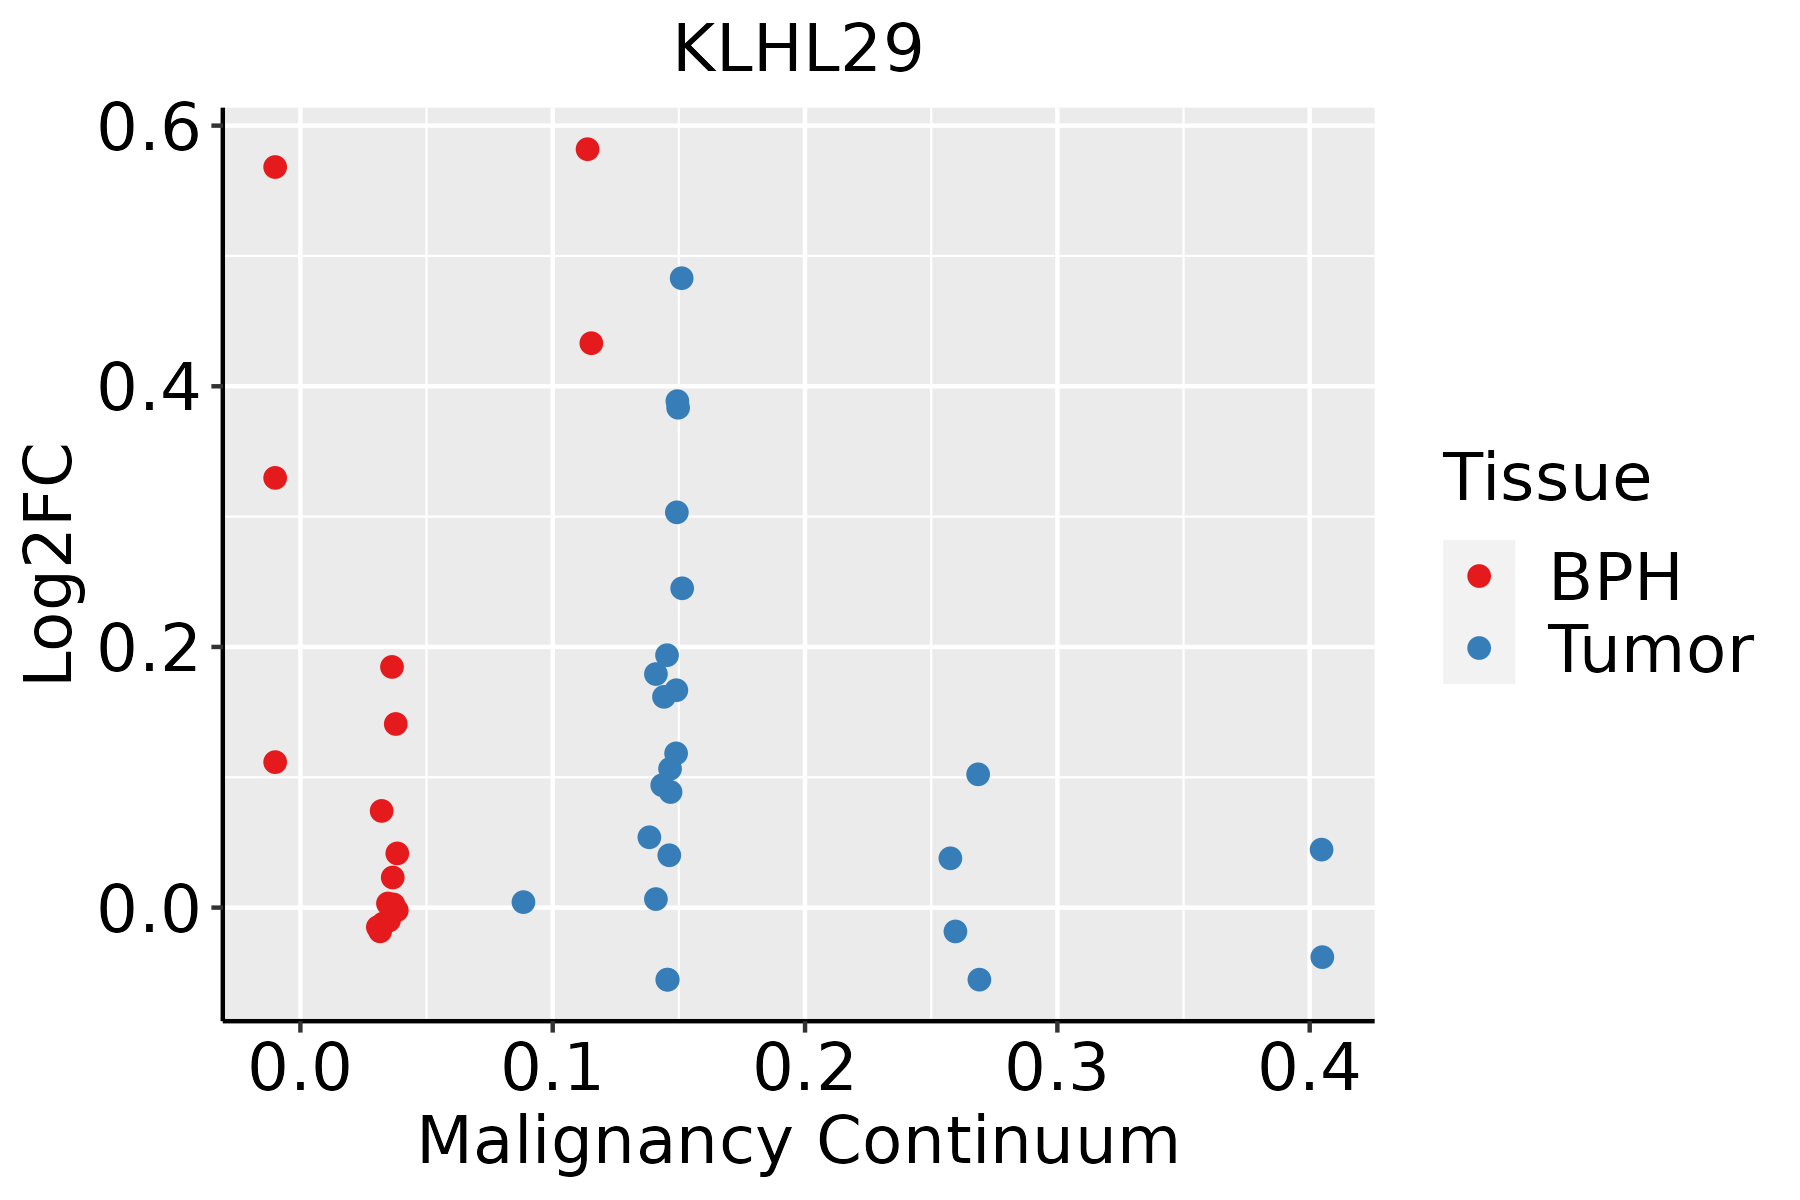 | BPH: Benign Prostatic Hyperplasia |
| ∗log2FC in expression of this searched gene in stem-like cells from each diseased tissue sample relative to stem-like cells in normal samples in each tissue plotted against the malignancy continuum. Samples are colored based on if they are from different disease stage. |
Top |
Malignant transformation related pathway analysis |
| Find out the enriched GO biological processes and KEGG pathways involved in transition from healthy to precancer to cancer |
| Tissue | Disease Stage | Enriched GO biological Processes |
| Colorectum | AD |  |
| Colorectum | SER |  |
| Colorectum | MSS |  |
| Colorectum | MSI-H |  |
| Colorectum | FAP |  |
| ∗Top 15 enriched GO BP terms are showed in the bar plot of each disease state in each tissue. Each row represents a significant GO biological process which is colored according to the -log10(p.adjust). |
| Page: 1 2 3 4 5 6 7 8 9 |
| GO ID | Tissue | Disease Stage | Description | Gene Ratio | Bg Ratio | pvalue | p.adjust | Count |
| Page: 1 |
| Pathway ID | Tissue | Disease Stage | Description | Gene Ratio | Bg Ratio | pvalue | p.adjust | qvalue | Count |
| Page: 1 |
Top |
Cell-cell communication analysis |
| Identification of potential cell-cell interactions between two cell types and their ligand-receptor pairs for different disease states |
| Ligand | Receptor | LRpair | Pathway | Tissue | Disease Stage |
| Page: 1 |
Top |
Single-cell gene regulatory network inference analysis |
| Find out the significant the regulons (TFs) and the target genes of each regulon across cell types for different disease states |
| TF | Cell Type | Tissue | Disease Stage | Target Gene | RSS | Regulon Activity |
| ∗The dot plots of a searched regulon are shown for all cell subpopulations in each disease state of each tissue based on the regulon specific score inferred using pySCENIC and by calculating the average expression. |
| Page: 1 |
Top |
Somatic mutation of malignant transformation related genes |
| Annotation of somatic variants for genes involved in malignant transformation |
| Hugo Symbol | Variant Class | Variant Classification | dbSNP RS | HGVSc | HGVSp | HGVSp Short | SWISSPROT | BIOTYPE | SIFT | PolyPhen | Tumor Sample Barcode | Tissue | Histology | Sex | Age | Stage | Therapy Types | Drugs | Outcome |
| KLHL29 | SNV | Missense_Mutation | c.379N>T | p.Asp127Tyr | p.D127Y | Q96CT2 | protein_coding | deleterious_low_confidence(0) | probably_damaging(0.986) | TCGA-AC-A23H-01 | Breast | breast invasive carcinoma | Female | >=65 | I/II | Unknown | Unknown | PD | |
| KLHL29 | SNV | Missense_Mutation | novel | c.2466N>C | p.Lys822Asn | p.K822N | Q96CT2 | protein_coding | deleterious(0) | probably_damaging(0.973) | TCGA-BH-A2L8-01 | Breast | breast invasive carcinoma | Female | <65 | I/II | Chemotherapy | cytoxan | CR |
| KLHL29 | SNV | Missense_Mutation | novel | c.1535G>A | p.Arg512His | p.R512H | Q96CT2 | protein_coding | deleterious(0) | probably_damaging(0.997) | TCGA-EW-A423-01 | Breast | breast invasive carcinoma | Female | >=65 | I/II | Hormone Therapy | anastrozole | SD |
| KLHL29 | insertion | In_Frame_Ins | novel | c.1173_1174insCCCATCCATAGCTCATGCTTTTTGATTTGCATCTTTTTTTGCATG | p.Phe391_Val392insProIleHisSerSerCysPheLeuIleCysIlePhePheCysMet | p.F391_V392insPIHSSCFLICIFFCM | Q96CT2 | protein_coding | TCGA-A2-A0D1-01 | Breast | breast invasive carcinoma | Female | >=65 | I/II | Chemotherapy | taxotere | SD | ||
| KLHL29 | SNV | Missense_Mutation | novel | c.1673G>A | p.Arg558His | p.R558H | Q96CT2 | protein_coding | deleterious(0.04) | benign(0.294) | TCGA-2W-A8YY-01 | Cervix | cervical & endocervical cancer | Female | <65 | I/II | Chemotherapy | cisplatin | CR |
| KLHL29 | SNV | Missense_Mutation | c.2068N>A | p.Gly690Arg | p.G690R | Q96CT2 | protein_coding | deleterious(0) | probably_damaging(0.998) | TCGA-EK-A2PL-01 | Cervix | cervical & endocervical cancer | Female | <65 | III/IV | Unknown | Unknown | SD | |
| KLHL29 | SNV | Missense_Mutation | novel | c.2597T>C | p.Val866Ala | p.V866A | Q96CT2 | protein_coding | deleterious(0.05) | benign(0.398) | TCGA-VS-A9UC-01 | Cervix | cervical & endocervical cancer | Female | <65 | I/II | Chemotherapy | cisplatin | SD |
| KLHL29 | SNV | Missense_Mutation | c.568N>T | p.Pro190Ser | p.P190S | Q96CT2 | protein_coding | tolerated_low_confidence(0.09) | benign(0.373) | TCGA-A6-6653-01 | Colorectum | colon adenocarcinoma | Male | >=65 | I/II | Unknown | Unknown | SD | |
| KLHL29 | SNV | Missense_Mutation | c.457N>A | p.Ala153Thr | p.A153T | Q96CT2 | protein_coding | tolerated_low_confidence(0.14) | benign(0.015) | TCGA-AA-3956-01 | Colorectum | colon adenocarcinoma | Male | >=65 | I/II | Unknown | Unknown | SD | |
| KLHL29 | SNV | Missense_Mutation | novel | c.752C>A | p.Ala251Asp | p.A251D | Q96CT2 | protein_coding | deleterious_low_confidence(0.01) | possibly_damaging(0.522) | TCGA-AA-3984-01 | Colorectum | colon adenocarcinoma | Female | <65 | I/II | Unknown | Unknown | SD |
| Page: 1 2 3 4 5 6 |
Top |
Related drugs of malignant transformation related genes |
| Identification of chemicals and drugs interact with genes involved in malignant transfromation |
| (DGIdb 4.0) |
| Entrez ID | Symbol | Category | Interaction Types | Drug Claim Name | Drug Name | PMIDs |
| Page: 1 |

Copyright 2023-Present -The University of Texas Health Science Center at Houston |