
|
|||||
|
 | |
| |
| |
| |
| |
| |
|
Gene: KLHL24 |
Gene summary for KLHL24 |
| Gene information | Species | Human | Gene symbol | KLHL24 | Gene ID | 54800 |
| Gene name | kelch like family member 24 | |
| Gene Alias | DRE1 | |
| Cytomap | 3q27.1 | |
| Gene Type | protein-coding | GO ID | GO:0002028 | UniProtAcc | Q6TFL4 |
Top |
Malignant transformation analysis |
| Identification of the aberrant gene expression in precancerous and cancerous lesions by comparing the gene expression of stem-like cells in diseased tissues with normal stem cells |
| Entrez ID | Symbol | Replicates | Species | Organ | Tissue | Adj P-value | Log2FC | Malignancy |
| 54800 | KLHL24 | CCI_2 | Human | Cervix | CC | 1.81e-09 | 1.56e+00 | 0.5249 |
| 54800 | KLHL24 | CCI_3 | Human | Cervix | CC | 8.84e-04 | 6.71e-01 | 0.516 |
| 54800 | KLHL24 | HTA11_347_2000001011 | Human | Colorectum | AD | 1.47e-05 | 4.91e-01 | -0.1954 |
| 54800 | KLHL24 | HTA11_99999965104_69814 | Human | Colorectum | MSS | 3.77e-04 | 5.66e-01 | 0.281 |
| 54800 | KLHL24 | A015-C-203 | Human | Colorectum | FAP | 3.87e-13 | -1.18e-01 | -0.1294 |
| 54800 | KLHL24 | A002-C-201 | Human | Colorectum | FAP | 1.22e-05 | -2.34e-01 | 0.0324 |
| 54800 | KLHL24 | A002-C-203 | Human | Colorectum | FAP | 8.96e-03 | -3.08e-02 | 0.2786 |
| 54800 | KLHL24 | A001-C-108 | Human | Colorectum | FAP | 2.64e-06 | -1.37e-01 | -0.0272 |
| 54800 | KLHL24 | A002-C-205 | Human | Colorectum | FAP | 7.50e-09 | -2.22e-01 | -0.1236 |
| 54800 | KLHL24 | A015-C-006 | Human | Colorectum | FAP | 2.80e-07 | -3.23e-01 | -0.0994 |
| 54800 | KLHL24 | A002-C-114 | Human | Colorectum | FAP | 3.39e-06 | -9.05e-02 | -0.1561 |
| 54800 | KLHL24 | A015-C-104 | Human | Colorectum | FAP | 1.50e-13 | -1.82e-01 | -0.1899 |
| 54800 | KLHL24 | A001-C-014 | Human | Colorectum | FAP | 1.15e-05 | -1.68e-01 | 0.0135 |
| 54800 | KLHL24 | A002-C-016 | Human | Colorectum | FAP | 1.13e-10 | -1.45e-01 | 0.0521 |
| 54800 | KLHL24 | A015-C-002 | Human | Colorectum | FAP | 6.43e-05 | -2.74e-01 | -0.0763 |
| 54800 | KLHL24 | A002-C-116 | Human | Colorectum | FAP | 2.80e-12 | -1.35e-01 | -0.0452 |
| 54800 | KLHL24 | A014-C-008 | Human | Colorectum | FAP | 4.08e-05 | -2.10e-01 | -0.191 |
| 54800 | KLHL24 | A018-E-020 | Human | Colorectum | FAP | 2.08e-06 | -1.48e-01 | -0.2034 |
| 54800 | KLHL24 | F034 | Human | Colorectum | FAP | 1.50e-05 | -1.30e-01 | -0.0665 |
| 54800 | KLHL24 | CRC-1-8810 | Human | Colorectum | CRC | 2.94e-02 | -1.47e-01 | 0.6257 |
| Page: 1 2 3 4 5 6 7 |
| Tissue | Expression Dynamics | Abbreviation |
| Cervix | 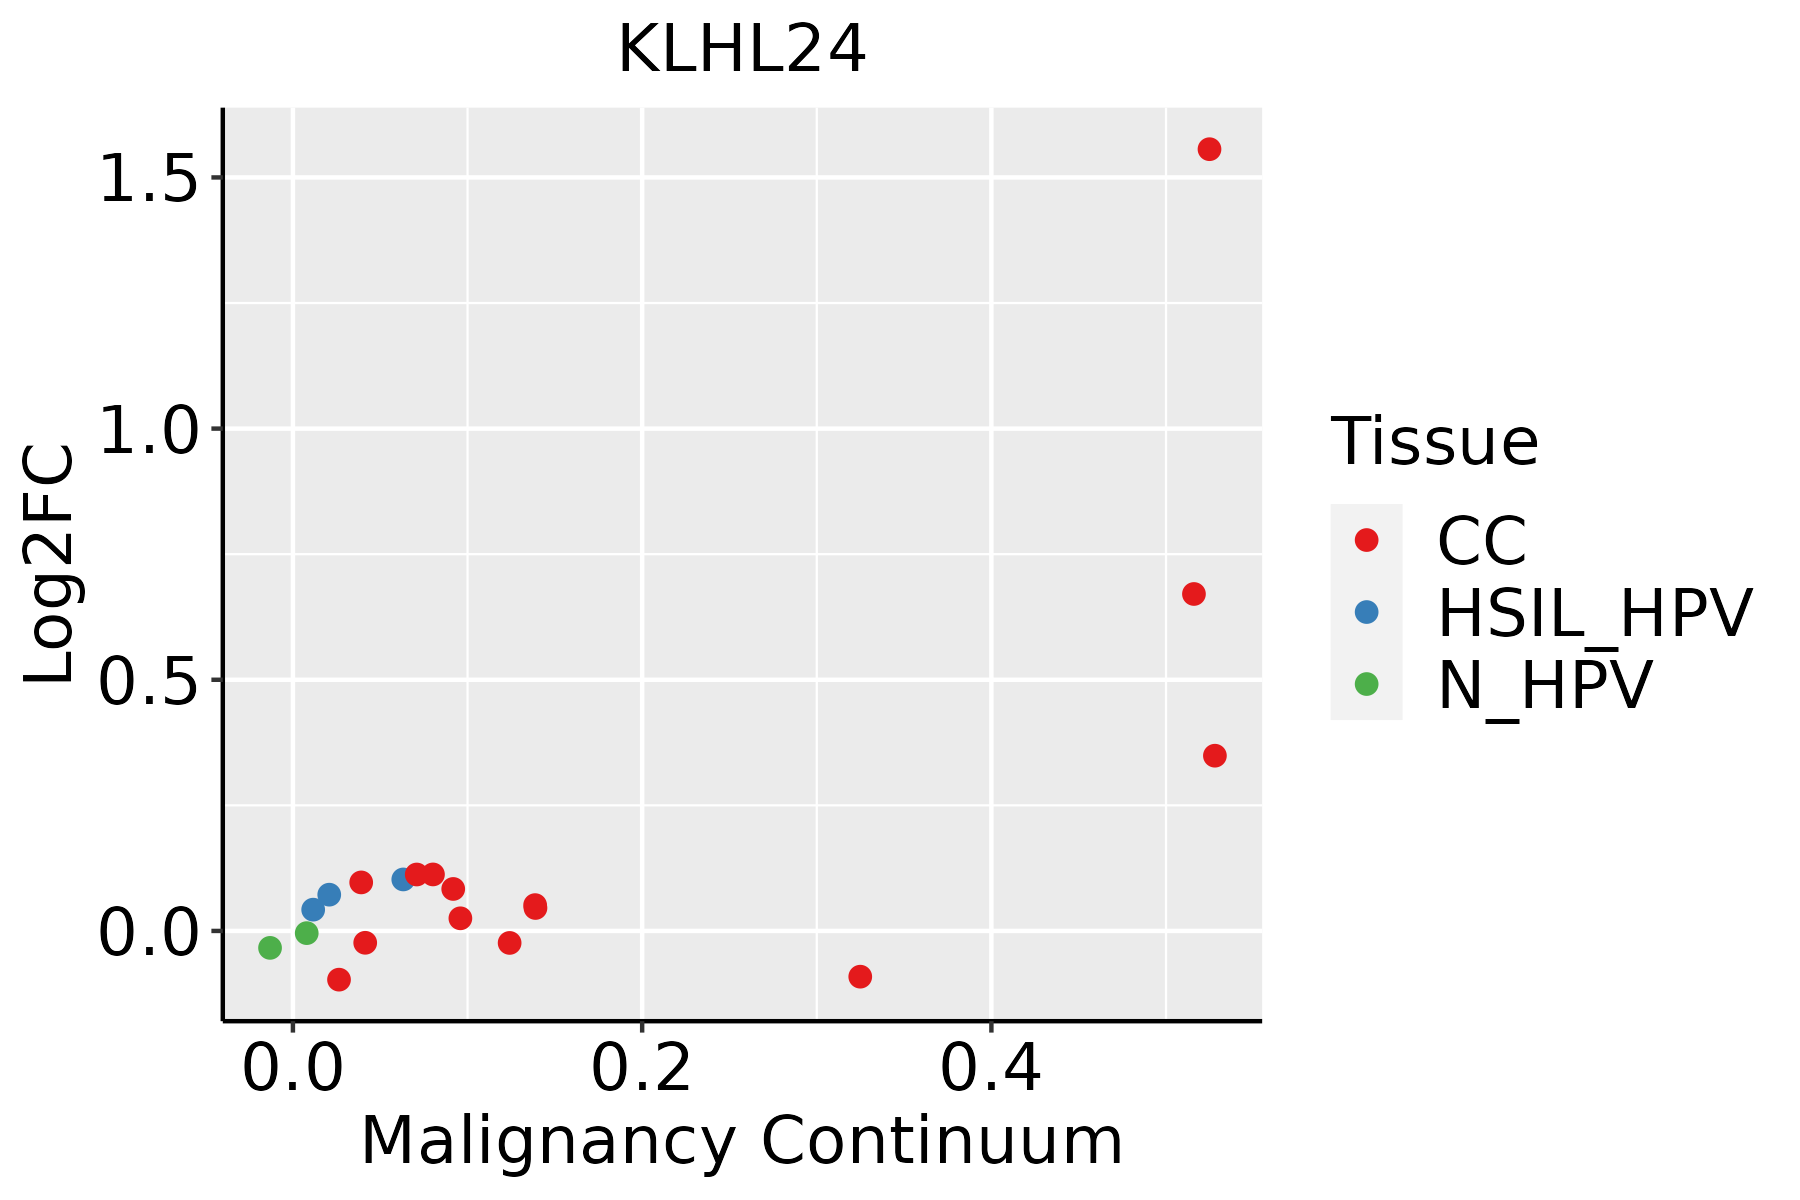 | CC: Cervix cancer |
| HSIL_HPV: HPV-infected high-grade squamous intraepithelial lesions | ||
| N_HPV: HPV-infected normal cervix | ||
| Colorectum (GSE201348) |  | FAP: Familial adenomatous polyposis |
| CRC: Colorectal cancer | ||
| Colorectum (HTA11) |  | AD: Adenomas |
| SER: Sessile serrated lesions | ||
| MSI-H: Microsatellite-high colorectal cancer | ||
| MSS: Microsatellite stable colorectal cancer | ||
| Esophagus |  | ESCC: Esophageal squamous cell carcinoma |
| HGIN: High-grade intraepithelial neoplasias | ||
| LGIN: Low-grade intraepithelial neoplasias | ||
| Liver |  | HCC: Hepatocellular carcinoma |
| NAFLD: Non-alcoholic fatty liver disease | ||
| Lung |  | AAH: Atypical adenomatous hyperplasia |
| AIS: Adenocarcinoma in situ | ||
| IAC: Invasive lung adenocarcinoma | ||
| MIA: Minimally invasive adenocarcinoma | ||
| Oral Cavity | 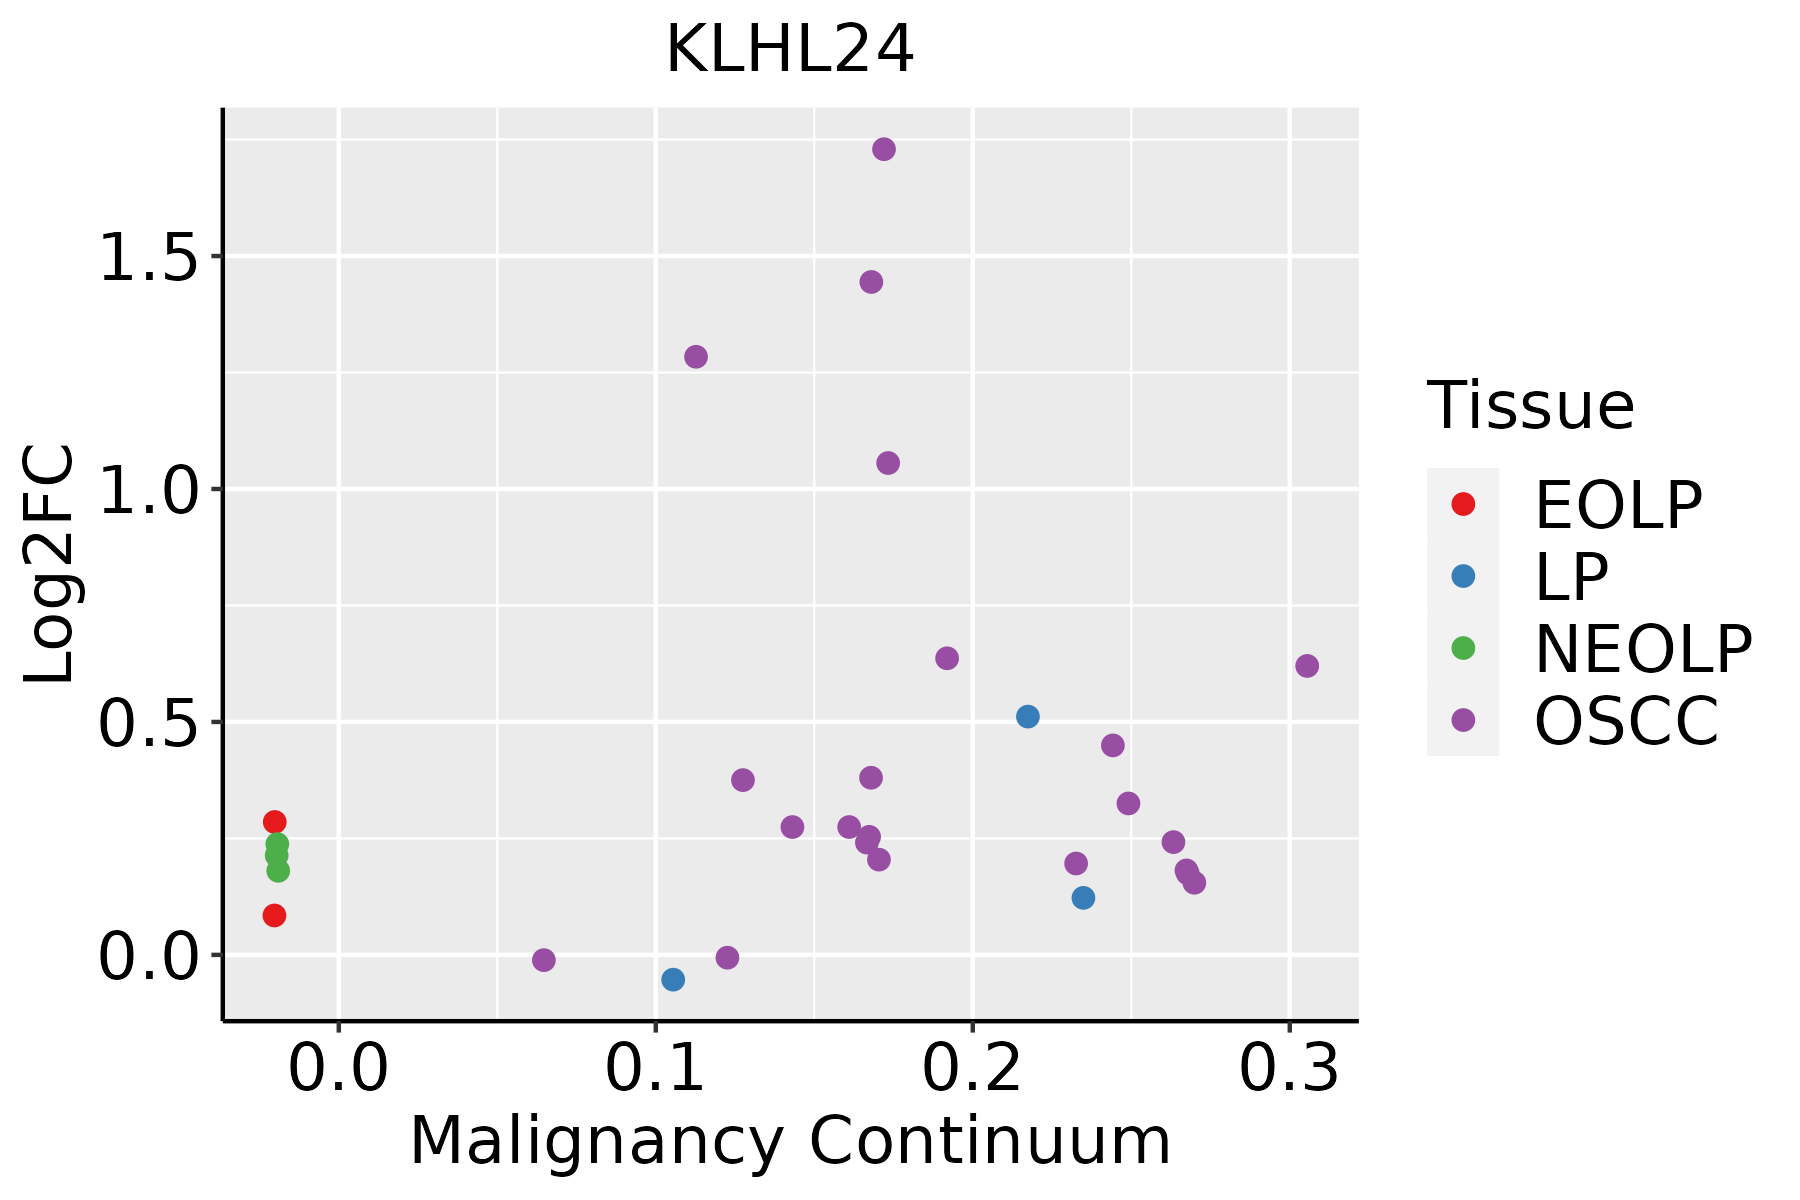 | EOLP: Erosive Oral lichen planus |
| LP: leukoplakia | ||
| NEOLP: Non-erosive oral lichen planus | ||
| OSCC: Oral squamous cell carcinoma | ||
| Thyroid | 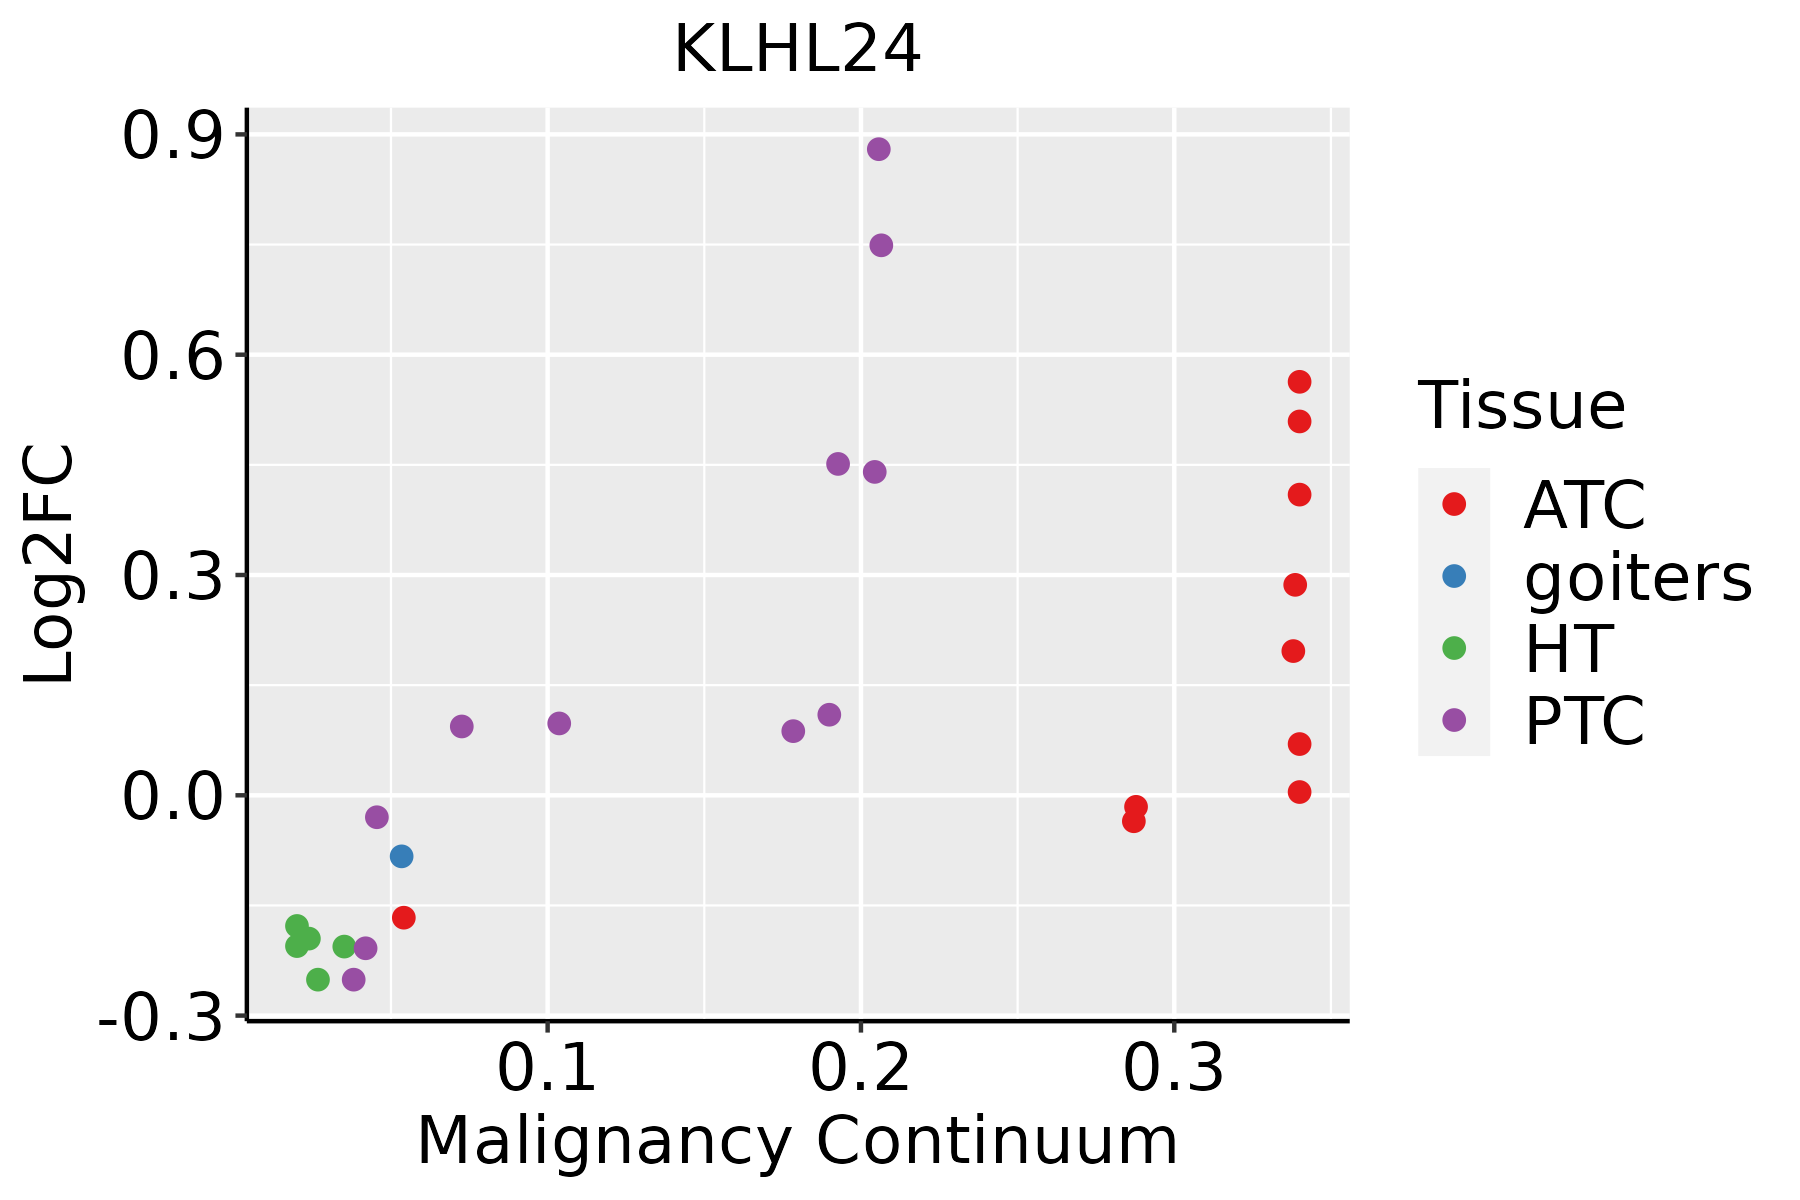 | ATC: Anaplastic thyroid cancer |
| HT: Hashimoto's thyroiditis | ||
| PTC: Papillary thyroid cancer |
| ∗log2FC in expression of this searched gene in stem-like cells from each diseased tissue sample relative to stem-like cells in normal samples in each tissue plotted against the malignancy continuum. Samples are colored based on if they are from different disease stage. |
Top |
Malignant transformation related pathway analysis |
| Find out the enriched GO biological processes and KEGG pathways involved in transition from healthy to precancer to cancer |
| Tissue | Disease Stage | Enriched GO biological Processes |
| Colorectum | AD |  |
| Colorectum | SER |  |
| Colorectum | MSS |  |
| Colorectum | MSI-H |  |
| Colorectum | FAP |  |
| ∗Top 15 enriched GO BP terms are showed in the bar plot of each disease state in each tissue. Each row represents a significant GO biological process which is colored according to the -log10(p.adjust). |
| Page: 1 2 3 4 5 6 7 8 9 |
| GO ID | Tissue | Disease Stage | Description | Gene Ratio | Bg Ratio | pvalue | p.adjust | Count |
| GO:19023059 | Cervix | CC | regulation of sodium ion transmembrane transport | 19/2311 | 68/18723 | 4.21e-04 | 4.25e-03 | 19 |
| GO:00451043 | Cervix | CC | intermediate filament cytoskeleton organization | 15/2311 | 51/18723 | 9.25e-04 | 7.84e-03 | 15 |
| GO:00451033 | Cervix | CC | intermediate filament-based process | 15/2311 | 52/18723 | 1.15e-03 | 9.39e-03 | 15 |
| GO:00020288 | Cervix | CC | regulation of sodium ion transport | 21/2311 | 90/18723 | 2.71e-03 | 1.85e-02 | 21 |
| GO:20006498 | Cervix | CC | regulation of sodium ion transmembrane transporter activity | 15/2311 | 58/18723 | 3.75e-03 | 2.38e-02 | 15 |
| GO:00518656 | Cervix | CC | protein autoubiquitination | 17/2311 | 73/18723 | 6.71e-03 | 3.70e-02 | 17 |
| GO:0002028 | Colorectum | AD | regulation of sodium ion transport | 36/3918 | 90/18723 | 2.89e-05 | 5.37e-04 | 36 |
| GO:1902305 | Colorectum | AD | regulation of sodium ion transmembrane transport | 27/3918 | 68/18723 | 3.19e-04 | 3.80e-03 | 27 |
| GO:0051865 | Colorectum | AD | protein autoubiquitination | 28/3918 | 73/18723 | 4.87e-04 | 5.30e-03 | 28 |
| GO:2000649 | Colorectum | AD | regulation of sodium ion transmembrane transporter activity | 23/3918 | 58/18723 | 8.82e-04 | 8.53e-03 | 23 |
| GO:00020282 | Colorectum | MSS | regulation of sodium ion transport | 32/3467 | 90/18723 | 9.56e-05 | 1.50e-03 | 32 |
| GO:19023052 | Colorectum | MSS | regulation of sodium ion transmembrane transport | 26/3467 | 68/18723 | 1.08e-04 | 1.68e-03 | 26 |
| GO:20006492 | Colorectum | MSS | regulation of sodium ion transmembrane transporter activity | 22/3467 | 58/18723 | 4.06e-04 | 4.99e-03 | 22 |
| GO:00518651 | Colorectum | MSS | protein autoubiquitination | 25/3467 | 73/18723 | 1.00e-03 | 1.00e-02 | 25 |
| GO:00324091 | Colorectum | MSS | regulation of transporter activity | 78/3467 | 310/18723 | 2.09e-03 | 1.78e-02 | 78 |
| GO:0022898 | Colorectum | MSS | regulation of transmembrane transporter activity | 70/3467 | 278/18723 | 3.36e-03 | 2.54e-02 | 70 |
| GO:0032412 | Colorectum | MSS | regulation of ion transmembrane transporter activity | 66/3467 | 267/18723 | 6.72e-03 | 4.38e-02 | 66 |
| GO:00020284 | Colorectum | FAP | regulation of sodium ion transport | 33/2622 | 90/18723 | 6.51e-08 | 4.54e-06 | 33 |
| GO:19023054 | Colorectum | FAP | regulation of sodium ion transmembrane transport | 25/2622 | 68/18723 | 2.36e-06 | 9.21e-05 | 25 |
| GO:20006494 | Colorectum | FAP | regulation of sodium ion transmembrane transporter activity | 21/2622 | 58/18723 | 1.95e-05 | 4.85e-04 | 21 |
| Page: 1 2 3 4 5 |
| Pathway ID | Tissue | Disease Stage | Description | Gene Ratio | Bg Ratio | pvalue | p.adjust | qvalue | Count |
| Page: 1 |
Top |
Cell-cell communication analysis |
| Identification of potential cell-cell interactions between two cell types and their ligand-receptor pairs for different disease states |
| Ligand | Receptor | LRpair | Pathway | Tissue | Disease Stage |
| Page: 1 |
Top |
Single-cell gene regulatory network inference analysis |
| Find out the significant the regulons (TFs) and the target genes of each regulon across cell types for different disease states |
| TF | Cell Type | Tissue | Disease Stage | Target Gene | RSS | Regulon Activity |
| ∗The dot plots of a searched regulon are shown for all cell subpopulations in each disease state of each tissue based on the regulon specific score inferred using pySCENIC and by calculating the average expression. |
| Page: 1 |
Top |
Somatic mutation of malignant transformation related genes |
| Annotation of somatic variants for genes involved in malignant transformation |
| Hugo Symbol | Variant Class | Variant Classification | dbSNP RS | HGVSc | HGVSp | HGVSp Short | SWISSPROT | BIOTYPE | SIFT | PolyPhen | Tumor Sample Barcode | Tissue | Histology | Sex | Age | Stage | Therapy Types | Drugs | Outcome |
| KLHL24 | SNV | Missense_Mutation | c.1573N>G | p.Met525Val | p.M525V | Q6TFL4 | protein_coding | tolerated(0.29) | benign(0) | TCGA-A7-A0DA-01 | Breast | breast invasive carcinoma | Female | <65 | I/II | Chemotherapy | adriamycin | SD | |
| KLHL24 | SNV | Missense_Mutation | c.1162N>G | p.Ile388Val | p.I388V | Q6TFL4 | protein_coding | tolerated(0.27) | benign(0.055) | TCGA-A8-A08F-01 | Breast | breast invasive carcinoma | Female | <65 | III/IV | Chemotherapy | 5-fluorouracil | CR | |
| KLHL24 | SNV | Missense_Mutation | c.1096N>G | p.Leu366Val | p.L366V | Q6TFL4 | protein_coding | tolerated(0.1) | benign(0.091) | TCGA-AC-A23H-01 | Breast | breast invasive carcinoma | Female | >=65 | I/II | Unknown | Unknown | PD | |
| KLHL24 | SNV | Missense_Mutation | rs763228635 | c.178N>T | p.Arg60Cys | p.R60C | Q6TFL4 | protein_coding | deleterious(0) | probably_damaging(0.999) | TCGA-AN-A046-01 | Breast | breast invasive carcinoma | Female | >=65 | I/II | Unknown | Unknown | SD |
| KLHL24 | deletion | Frame_Shift_Del | novel | c.947delN | p.Val317SerfsTer22 | p.V317Sfs*22 | Q6TFL4 | protein_coding | TCGA-D8-A27V-01 | Breast | breast invasive carcinoma | Female | <65 | I/II | Hormone Therapy | tamoxiphen | SD | ||
| KLHL24 | SNV | Missense_Mutation | c.604N>A | p.Glu202Lys | p.E202K | Q6TFL4 | protein_coding | deleterious(0.04) | possibly_damaging(0.904) | TCGA-EA-A410-01 | Cervix | cervical & endocervical cancer | Female | <65 | I/II | Unknown | Unknown | SD | |
| KLHL24 | SNV | Missense_Mutation | c.179N>A | p.Arg60His | p.R60H | Q6TFL4 | protein_coding | deleterious(0) | probably_damaging(0.998) | TCGA-MA-AA3Z-01 | Cervix | cervical & endocervical cancer | Female | <65 | I/II | Unknown | Unknown | SD | |
| KLHL24 | SNV | Missense_Mutation | c.1337N>A | p.Ser446Tyr | p.S446Y | Q6TFL4 | protein_coding | deleterious(0) | possibly_damaging(0.566) | TCGA-AA-3510-01 | Colorectum | colon adenocarcinoma | Male | >=65 | I/II | Unknown | Unknown | SD | |
| KLHL24 | SNV | Missense_Mutation | c.293N>G | p.Asp98Gly | p.D98G | Q6TFL4 | protein_coding | tolerated(0.56) | benign(0.042) | TCGA-AA-3715-01 | Colorectum | colon adenocarcinoma | Male | >=65 | I/II | Unknown | Unknown | PD | |
| KLHL24 | SNV | Missense_Mutation | c.698T>A | p.Val233Asp | p.V233D | Q6TFL4 | protein_coding | deleterious(0) | probably_damaging(0.986) | TCGA-AA-A02H-01 | Colorectum | colon adenocarcinoma | Female | >=65 | III/IV | Unknown | Unknown | PD |
| Page: 1 2 3 4 5 6 7 8 |
Top |
Related drugs of malignant transformation related genes |
| Identification of chemicals and drugs interact with genes involved in malignant transfromation |
| (DGIdb 4.0) |
| Entrez ID | Symbol | Category | Interaction Types | Drug Claim Name | Drug Name | PMIDs |
| Page: 1 |

Copyright 2023-Present -The University of Texas Health Science Center at Houston |