
|
|||||
|
 | |
| |
| |
| |
| |
| |
|
Gene: KLHL23 |
Gene summary for KLHL23 |
| Gene information | Species | Human | Gene symbol | KLHL23 | Gene ID | 151230 |
| Gene name | kelch like family member 23 | |
| Gene Alias | DITHP | |
| Cytomap | 2q31.1 | |
| Gene Type | protein-coding | GO ID | GO:0003674 | UniProtAcc | Q8NBE8 |
Top |
Malignant transformation analysis |
| Identification of the aberrant gene expression in precancerous and cancerous lesions by comparing the gene expression of stem-like cells in diseased tissues with normal stem cells |
| Entrez ID | Symbol | Replicates | Species | Organ | Tissue | Adj P-value | Log2FC | Malignancy |
| 151230 | KLHL23 | LZE7T | Human | Esophagus | ESCC | 4.48e-04 | 4.09e-01 | 0.0667 |
| 151230 | KLHL23 | LZE8T | Human | Esophagus | ESCC | 3.74e-02 | 8.77e-02 | 0.067 |
| 151230 | KLHL23 | P2T-E | Human | Esophagus | ESCC | 2.33e-27 | 5.07e-01 | 0.1177 |
| 151230 | KLHL23 | P4T-E | Human | Esophagus | ESCC | 6.89e-07 | 2.63e-01 | 0.1323 |
| 151230 | KLHL23 | P8T-E | Human | Esophagus | ESCC | 8.56e-12 | 1.81e-01 | 0.0889 |
| 151230 | KLHL23 | P9T-E | Human | Esophagus | ESCC | 5.62e-13 | 3.22e-01 | 0.1131 |
| 151230 | KLHL23 | P10T-E | Human | Esophagus | ESCC | 9.23e-24 | 4.85e-01 | 0.116 |
| 151230 | KLHL23 | P12T-E | Human | Esophagus | ESCC | 6.45e-14 | 2.94e-01 | 0.1122 |
| 151230 | KLHL23 | P15T-E | Human | Esophagus | ESCC | 9.83e-07 | 7.12e-02 | 0.1149 |
| 151230 | KLHL23 | P16T-E | Human | Esophagus | ESCC | 1.00e-20 | 4.64e-01 | 0.1153 |
| 151230 | KLHL23 | P20T-E | Human | Esophagus | ESCC | 2.49e-08 | 9.25e-02 | 0.1124 |
| 151230 | KLHL23 | P22T-E | Human | Esophagus | ESCC | 2.56e-11 | 2.00e-01 | 0.1236 |
| 151230 | KLHL23 | P23T-E | Human | Esophagus | ESCC | 2.00e-06 | 2.20e-01 | 0.108 |
| 151230 | KLHL23 | P26T-E | Human | Esophagus | ESCC | 9.22e-12 | 1.68e-01 | 0.1276 |
| 151230 | KLHL23 | P27T-E | Human | Esophagus | ESCC | 3.69e-07 | 1.91e-01 | 0.1055 |
| 151230 | KLHL23 | P28T-E | Human | Esophagus | ESCC | 1.47e-11 | 2.35e-01 | 0.1149 |
| 151230 | KLHL23 | P30T-E | Human | Esophagus | ESCC | 2.40e-07 | 4.05e-01 | 0.137 |
| 151230 | KLHL23 | P31T-E | Human | Esophagus | ESCC | 1.73e-02 | 6.28e-02 | 0.1251 |
| 151230 | KLHL23 | P40T-E | Human | Esophagus | ESCC | 3.48e-03 | 8.82e-02 | 0.109 |
| 151230 | KLHL23 | P42T-E | Human | Esophagus | ESCC | 1.43e-05 | 1.47e-01 | 0.1175 |
| Page: 1 2 3 |
| Tissue | Expression Dynamics | Abbreviation |
| Esophagus | 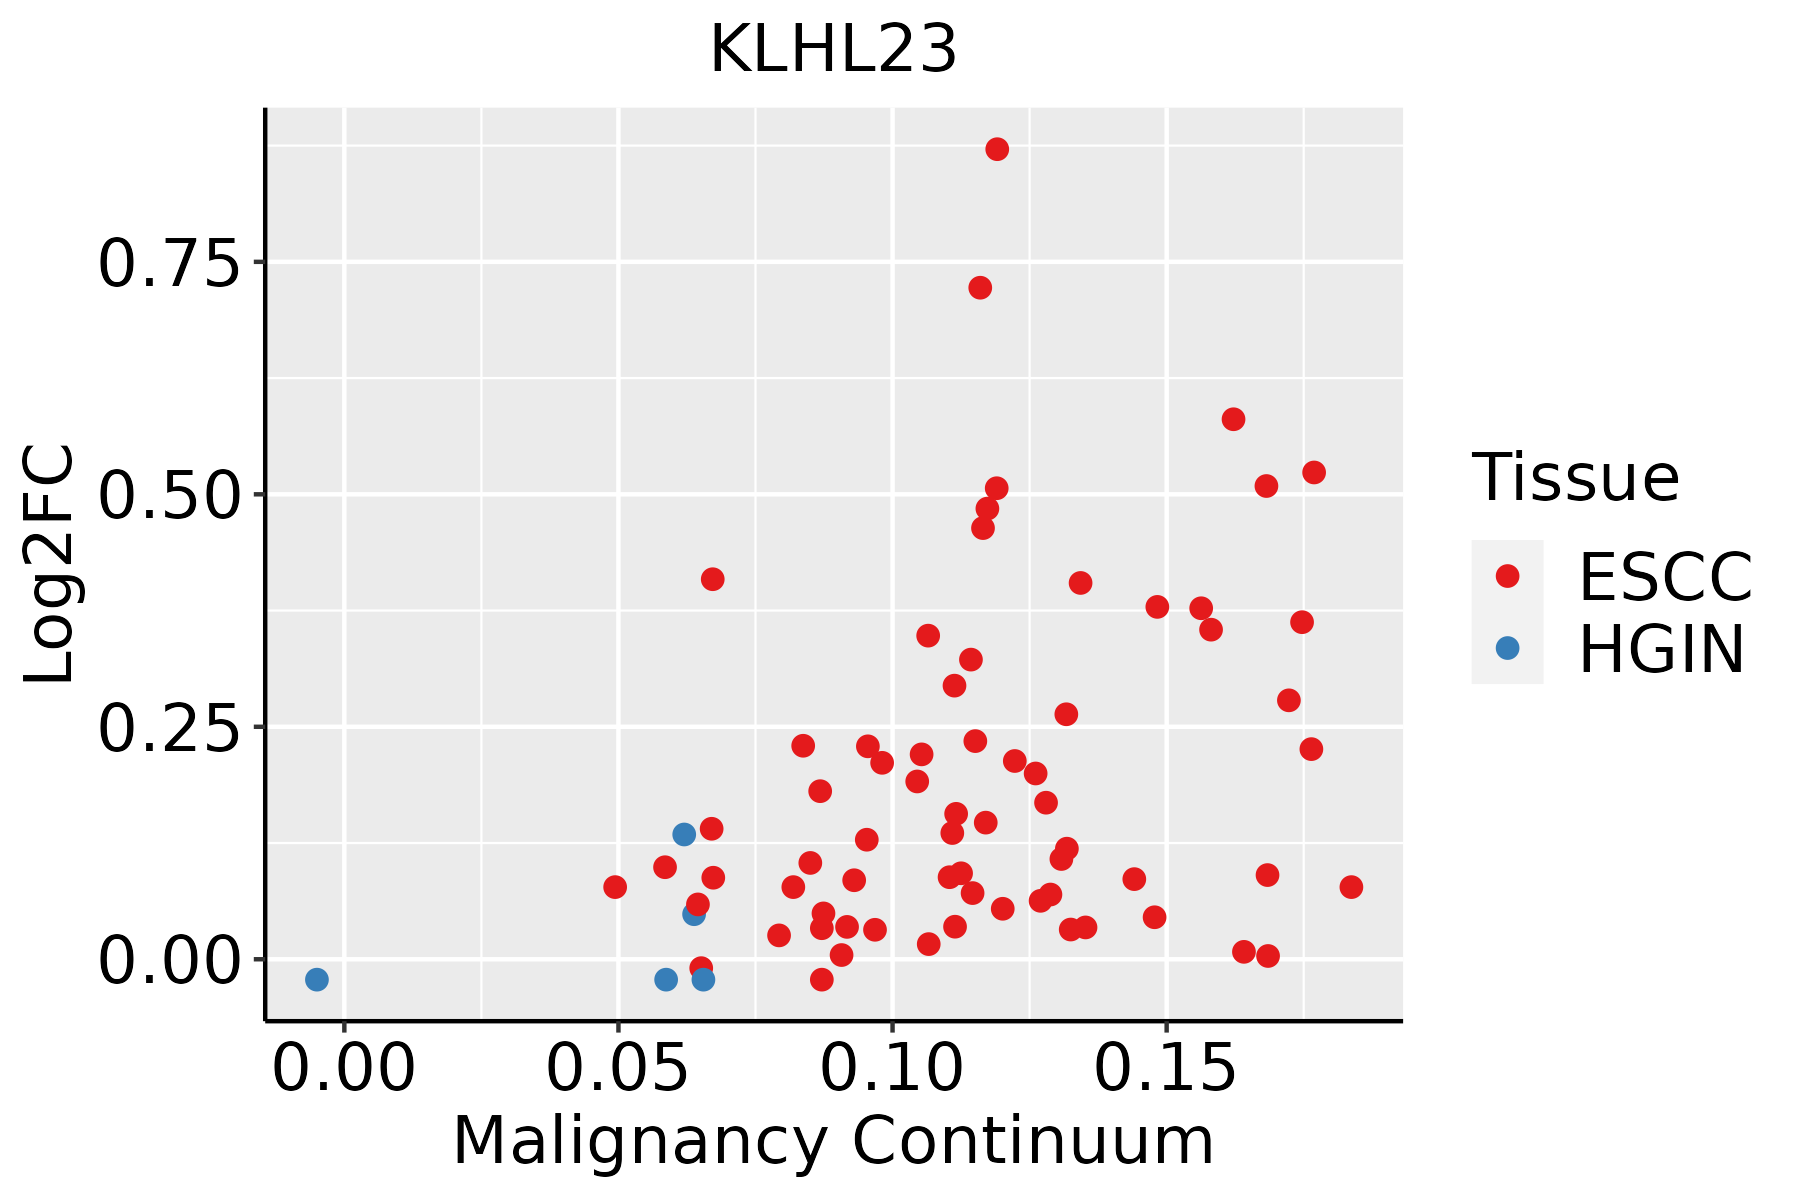 | ESCC: Esophageal squamous cell carcinoma |
| HGIN: High-grade intraepithelial neoplasias | ||
| LGIN: Low-grade intraepithelial neoplasias | ||
| Liver | 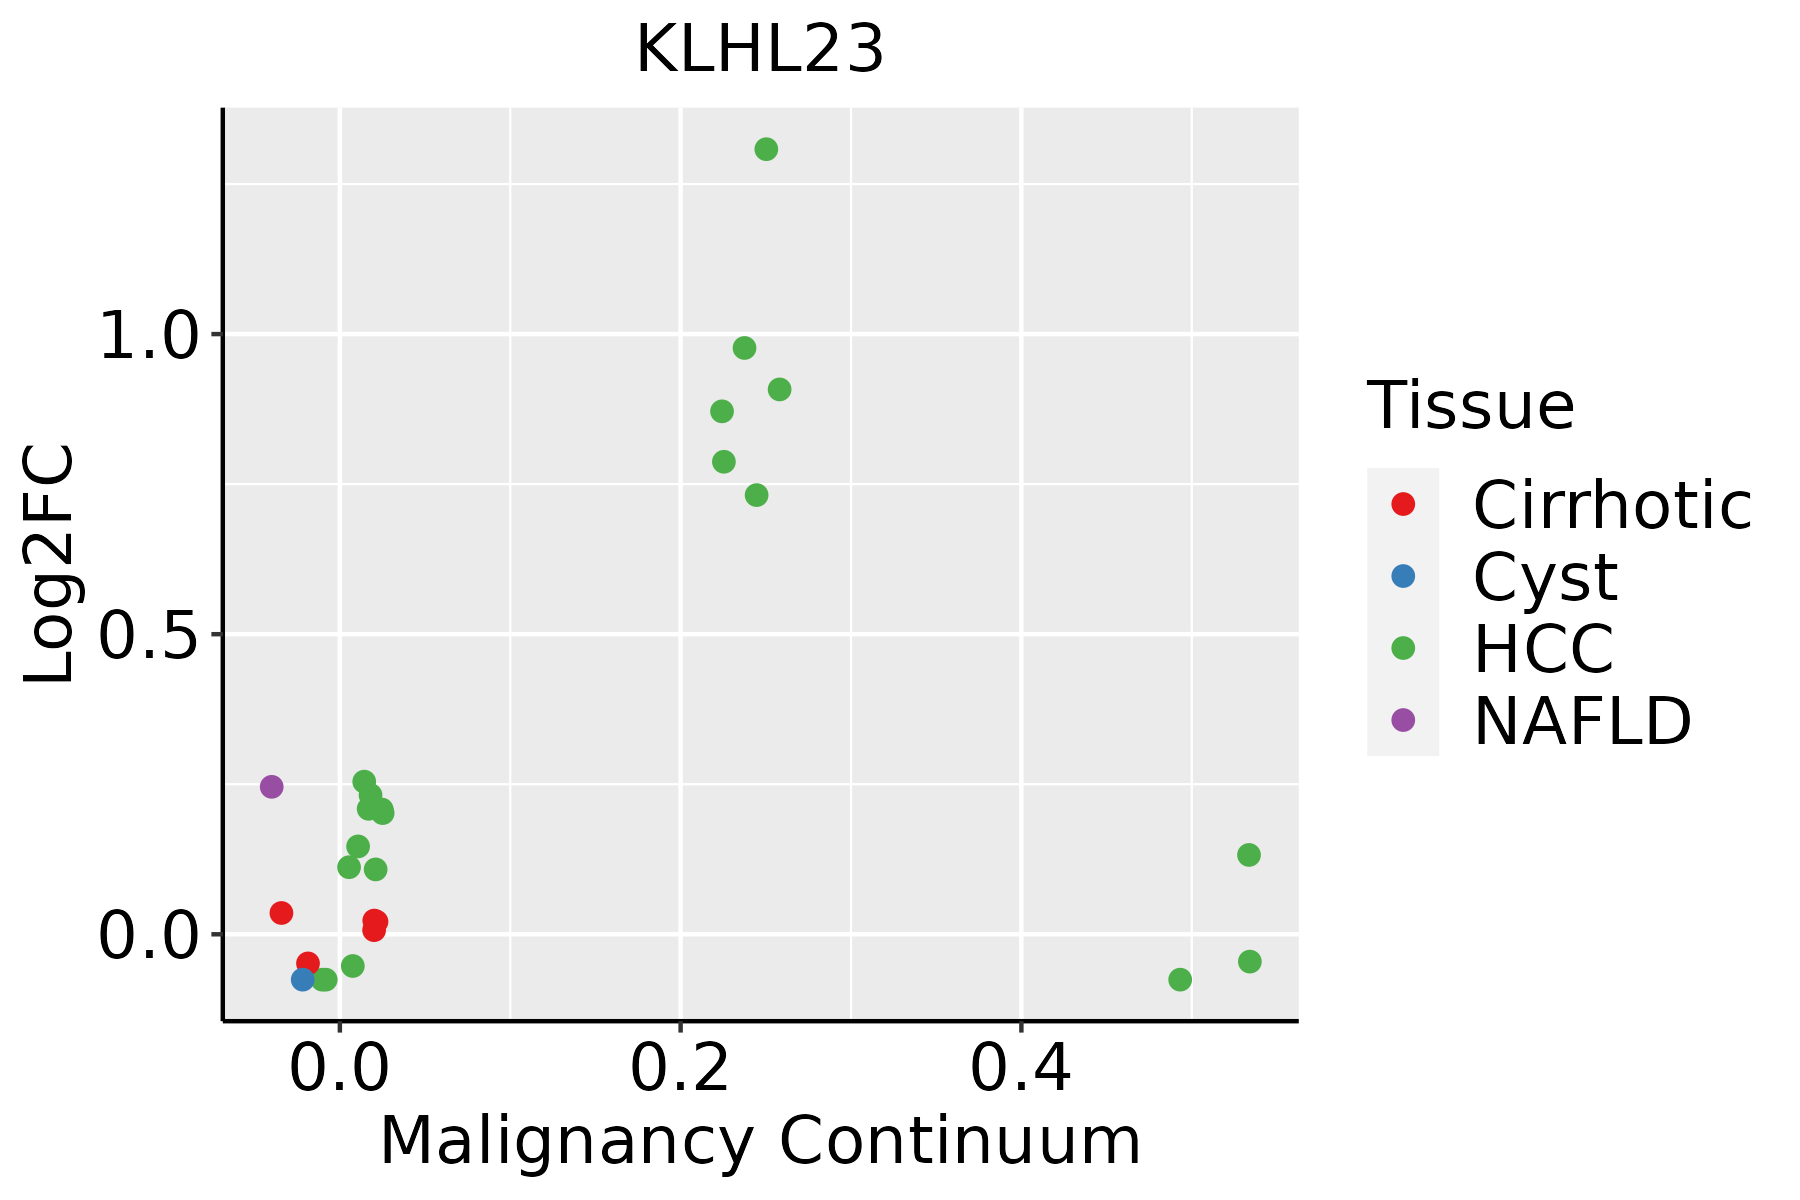 | HCC: Hepatocellular carcinoma |
| NAFLD: Non-alcoholic fatty liver disease | ||
| Prostate |  | BPH: Benign Prostatic Hyperplasia |
| ∗log2FC in expression of this searched gene in stem-like cells from each diseased tissue sample relative to stem-like cells in normal samples in each tissue plotted against the malignancy continuum. Samples are colored based on if they are from different disease stage. |
Top |
Malignant transformation related pathway analysis |
| Find out the enriched GO biological processes and KEGG pathways involved in transition from healthy to precancer to cancer |
| Tissue | Disease Stage | Enriched GO biological Processes |
| Colorectum | AD |  |
| Colorectum | SER |  |
| Colorectum | MSS |  |
| Colorectum | MSI-H |  |
| Colorectum | FAP |  |
| ∗Top 15 enriched GO BP terms are showed in the bar plot of each disease state in each tissue. Each row represents a significant GO biological process which is colored according to the -log10(p.adjust). |
| Page: 1 2 3 4 5 6 7 8 9 |
| GO ID | Tissue | Disease Stage | Description | Gene Ratio | Bg Ratio | pvalue | p.adjust | Count |
| Page: 1 |
| Pathway ID | Tissue | Disease Stage | Description | Gene Ratio | Bg Ratio | pvalue | p.adjust | qvalue | Count |
| Page: 1 |
Top |
Cell-cell communication analysis |
| Identification of potential cell-cell interactions between two cell types and their ligand-receptor pairs for different disease states |
| Ligand | Receptor | LRpair | Pathway | Tissue | Disease Stage |
| Page: 1 |
Top |
Single-cell gene regulatory network inference analysis |
| Find out the significant the regulons (TFs) and the target genes of each regulon across cell types for different disease states |
| TF | Cell Type | Tissue | Disease Stage | Target Gene | RSS | Regulon Activity |
| ∗The dot plots of a searched regulon are shown for all cell subpopulations in each disease state of each tissue based on the regulon specific score inferred using pySCENIC and by calculating the average expression. |
| Page: 1 |
Top |
Somatic mutation of malignant transformation related genes |
| Annotation of somatic variants for genes involved in malignant transformation |
| Hugo Symbol | Variant Class | Variant Classification | dbSNP RS | HGVSc | HGVSp | HGVSp Short | SWISSPROT | BIOTYPE | SIFT | PolyPhen | Tumor Sample Barcode | Tissue | Histology | Sex | Age | Stage | Therapy Types | Drugs | Outcome |
| KLHL23 | SNV | Missense_Mutation | c.742N>C | p.Thr248Pro | p.T248P | Q8NBE8 | protein_coding | tolerated(0.13) | benign(0.222) | TCGA-C8-A131-01 | Breast | breast invasive carcinoma | Female | >=65 | III/IV | Chemotherapy | 5-fluorouracil | CR | |
| KLHL23 | SNV | Missense_Mutation | novel | c.1013N>A | p.Thr338Lys | p.T338K | Q8NBE8 | protein_coding | tolerated(0.2) | benign(0.045) | TCGA-LL-A5YP-01 | Breast | breast invasive carcinoma | Female | <65 | I/II | Chemotherapy | cytoxan | SD |
| KLHL23 | insertion | Frame_Shift_Ins | novel | c.159_160insCGCGGGCGGCACGCGGCGCCCTCGAGTCCAGCCCCGCTCCT | p.Val54ArgfsTer16 | p.V54Rfs*16 | Q8NBE8 | protein_coding | TCGA-A8-A082-01 | Breast | breast invasive carcinoma | Female | <65 | I/II | Chemotherapy | 5-fluorouracil | CR | ||
| KLHL23 | insertion | Nonsense_Mutation | novel | c.1591_1592insGAAAGTTTCAGGTGTATTCCATTACCTGGGAGCAGACATGA | p.Asp531GlyfsTer14 | p.D531Gfs*14 | Q8NBE8 | protein_coding | TCGA-AN-A0FS-01 | Breast | breast invasive carcinoma | Female | <65 | I/II | Unknown | Unknown | SD | ||
| KLHL23 | SNV | Missense_Mutation | c.301G>C | p.Glu101Gln | p.E101Q | Q8NBE8 | protein_coding | tolerated(0.6) | benign(0.015) | TCGA-C5-A3HE-01 | Cervix | cervical & endocervical cancer | Female | <65 | I/II | Unknown | Unknown | PD | |
| KLHL23 | SNV | Missense_Mutation | c.1411N>T | p.Val471Phe | p.V471F | Q8NBE8 | protein_coding | deleterious(0) | possibly_damaging(0.884) | TCGA-DS-A1OC-01 | Cervix | cervical & endocervical cancer | Female | <65 | I/II | Chemotherapy | gemcitabine | SD | |
| KLHL23 | SNV | Missense_Mutation | c.383N>A | p.Arg128Gln | p.R128Q | Q8NBE8 | protein_coding | tolerated(0.9) | benign(0.009) | TCGA-A6-2686-01 | Colorectum | colon adenocarcinoma | Female | >=65 | I/II | Unknown | Unknown | SD | |
| KLHL23 | SNV | Missense_Mutation | c.383G>A | p.Arg128Gln | p.R128Q | Q8NBE8 | protein_coding | tolerated(0.9) | benign(0.009) | TCGA-AA-3663-01 | Colorectum | colon adenocarcinoma | Male | <65 | I/II | Unknown | Unknown | SD | |
| KLHL23 | SNV | Missense_Mutation | c.1164C>A | p.Phe388Leu | p.F388L | Q8NBE8 | protein_coding | tolerated(0.77) | benign(0.065) | TCGA-AA-3977-01 | Colorectum | colon adenocarcinoma | Male | >=65 | I/II | Unknown | Unknown | SD | |
| KLHL23 | SNV | Missense_Mutation | c.745G>A | p.Glu249Lys | p.E249K | Q8NBE8 | protein_coding | tolerated(0.42) | benign(0.095) | TCGA-AA-A00N-01 | Colorectum | colon adenocarcinoma | Male | >=65 | I/II | Unknown | Unknown | PD |
| Page: 1 2 3 4 5 6 7 8 |
Top |
Related drugs of malignant transformation related genes |
| Identification of chemicals and drugs interact with genes involved in malignant transfromation |
| (DGIdb 4.0) |
| Entrez ID | Symbol | Category | Interaction Types | Drug Claim Name | Drug Name | PMIDs |
| Page: 1 |

Copyright 2023-Present -The University of Texas Health Science Center at Houston |