
|
|||||
|
 | |
| |
| |
| |
| |
| |
|
Gene: KLHL22 |
Gene summary for KLHL22 |
| Gene information | Species | Human | Gene symbol | KLHL22 | Gene ID | 84861 |
| Gene name | kelch like family member 22 | |
| Gene Alias | KELCHL | |
| Cytomap | 22q11.21 | |
| Gene Type | protein-coding | GO ID | GO:0000070 | UniProtAcc | Q53GT1 |
Top |
Malignant transformation analysis |
| Identification of the aberrant gene expression in precancerous and cancerous lesions by comparing the gene expression of stem-like cells in diseased tissues with normal stem cells |
| Entrez ID | Symbol | Replicates | Species | Organ | Tissue | Adj P-value | Log2FC | Malignancy |
| 84861 | KLHL22 | LZE4T | Human | Esophagus | ESCC | 1.15e-03 | 1.12e-01 | 0.0811 |
| 84861 | KLHL22 | LZE7T | Human | Esophagus | ESCC | 9.69e-06 | 2.12e-01 | 0.0667 |
| 84861 | KLHL22 | LZE24T | Human | Esophagus | ESCC | 2.77e-05 | 9.44e-02 | 0.0596 |
| 84861 | KLHL22 | LZE21T | Human | Esophagus | ESCC | 2.64e-03 | 1.63e-01 | 0.0655 |
| 84861 | KLHL22 | LZE6T | Human | Esophagus | ESCC | 4.25e-03 | 1.20e-01 | 0.0845 |
| 84861 | KLHL22 | P2T-E | Human | Esophagus | ESCC | 4.84e-17 | 2.34e-01 | 0.1177 |
| 84861 | KLHL22 | P4T-E | Human | Esophagus | ESCC | 1.42e-05 | 1.10e-01 | 0.1323 |
| 84861 | KLHL22 | P8T-E | Human | Esophagus | ESCC | 1.14e-04 | 1.58e-01 | 0.0889 |
| 84861 | KLHL22 | P9T-E | Human | Esophagus | ESCC | 7.29e-09 | 1.23e-01 | 0.1131 |
| 84861 | KLHL22 | P10T-E | Human | Esophagus | ESCC | 8.86e-05 | 1.86e-01 | 0.116 |
| 84861 | KLHL22 | P11T-E | Human | Esophagus | ESCC | 3.39e-17 | 4.21e-01 | 0.1426 |
| 84861 | KLHL22 | P12T-E | Human | Esophagus | ESCC | 4.93e-15 | 3.08e-01 | 0.1122 |
| 84861 | KLHL22 | P15T-E | Human | Esophagus | ESCC | 3.06e-06 | 8.58e-02 | 0.1149 |
| 84861 | KLHL22 | P16T-E | Human | Esophagus | ESCC | 3.92e-12 | 2.56e-01 | 0.1153 |
| 84861 | KLHL22 | P17T-E | Human | Esophagus | ESCC | 1.01e-07 | 1.87e-01 | 0.1278 |
| 84861 | KLHL22 | P19T-E | Human | Esophagus | ESCC | 7.61e-06 | 2.63e-01 | 0.1662 |
| 84861 | KLHL22 | P20T-E | Human | Esophagus | ESCC | 4.76e-13 | 1.52e-01 | 0.1124 |
| 84861 | KLHL22 | P21T-E | Human | Esophagus | ESCC | 5.35e-20 | 4.16e-01 | 0.1617 |
| 84861 | KLHL22 | P22T-E | Human | Esophagus | ESCC | 4.08e-09 | 1.91e-01 | 0.1236 |
| 84861 | KLHL22 | P23T-E | Human | Esophagus | ESCC | 3.86e-17 | 3.37e-01 | 0.108 |
| Page: 1 2 3 |
| Tissue | Expression Dynamics | Abbreviation |
| Esophagus | 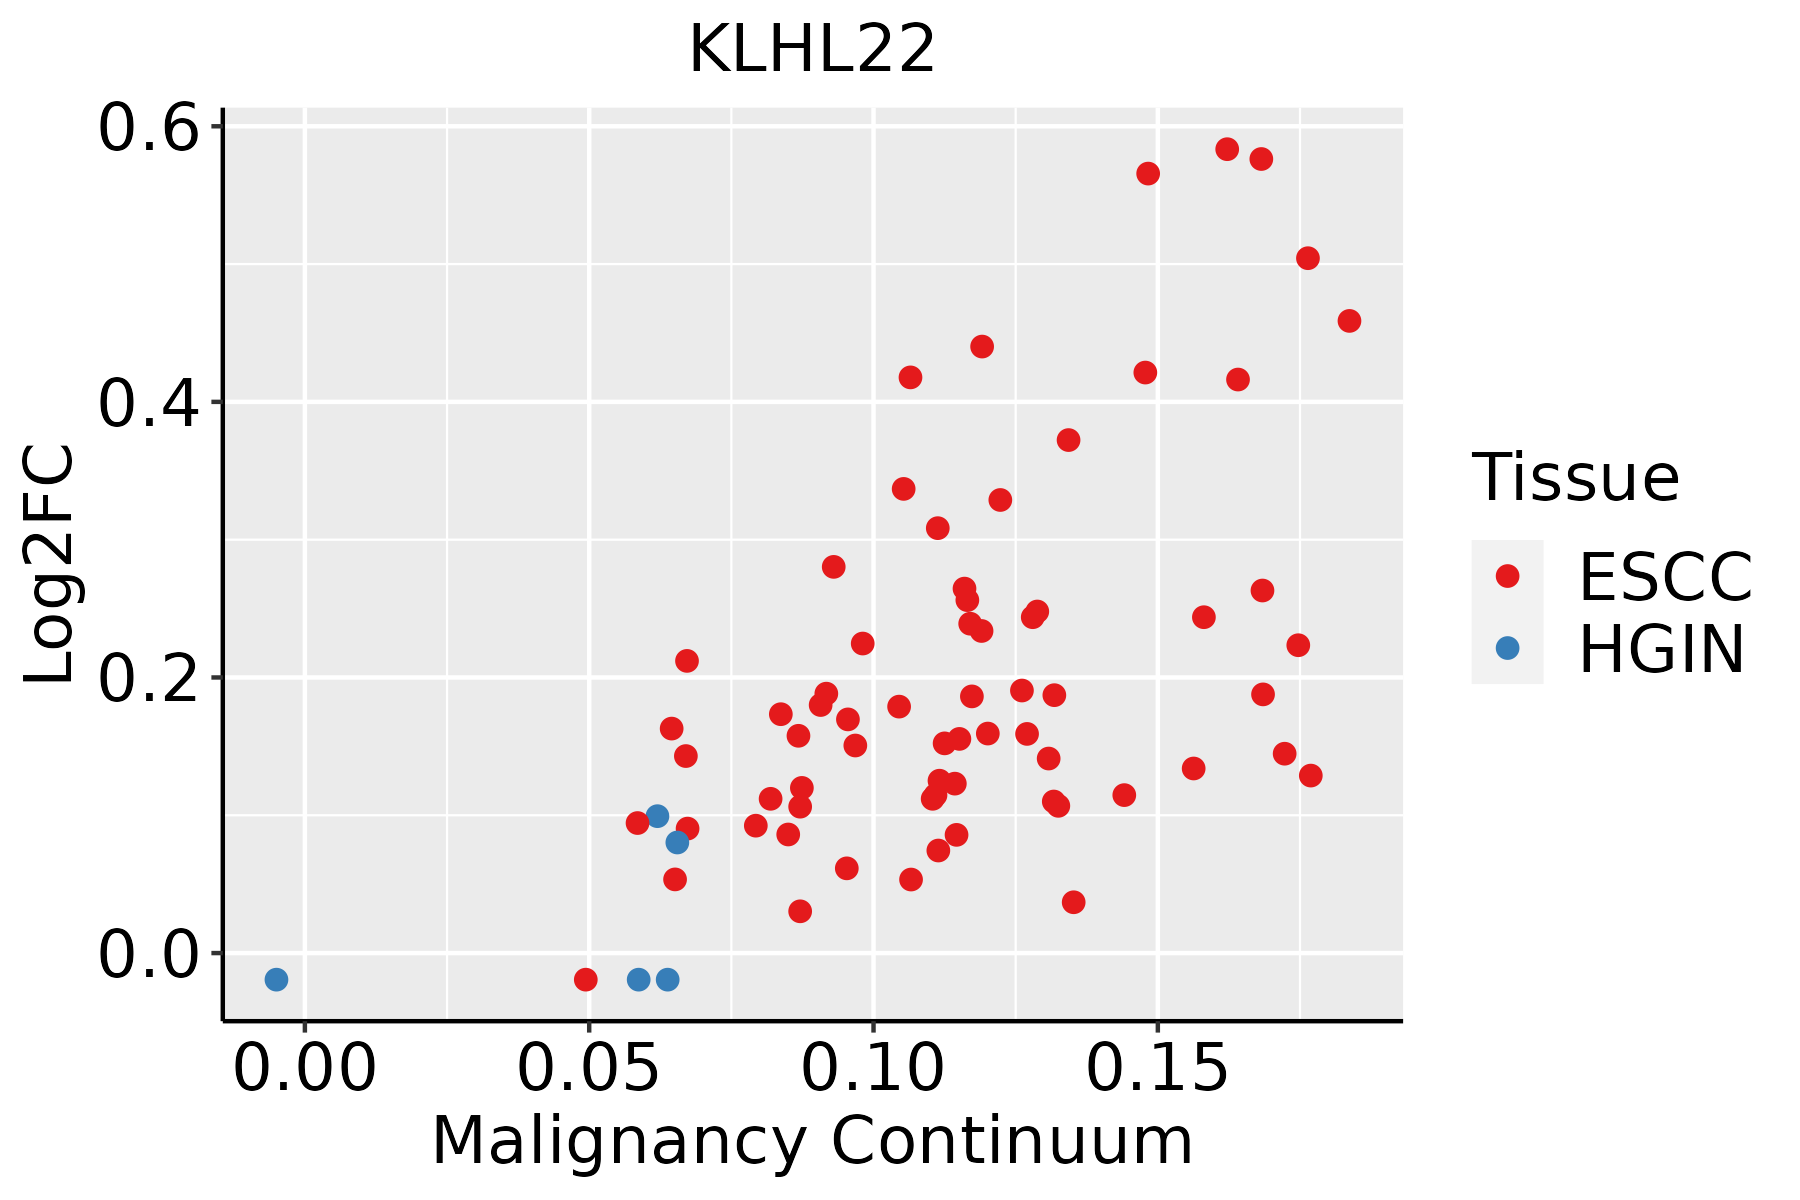 | ESCC: Esophageal squamous cell carcinoma |
| HGIN: High-grade intraepithelial neoplasias | ||
| LGIN: Low-grade intraepithelial neoplasias |
| ∗log2FC in expression of this searched gene in stem-like cells from each diseased tissue sample relative to stem-like cells in normal samples in each tissue plotted against the malignancy continuum. Samples are colored based on if they are from different disease stage. |
Top |
Malignant transformation related pathway analysis |
| Find out the enriched GO biological processes and KEGG pathways involved in transition from healthy to precancer to cancer |
| Tissue | Disease Stage | Enriched GO biological Processes |
| Colorectum | AD |  |
| Colorectum | SER |  |
| Colorectum | MSS |  |
| Colorectum | MSI-H |  |
| Colorectum | FAP |  |
| ∗Top 15 enriched GO BP terms are showed in the bar plot of each disease state in each tissue. Each row represents a significant GO biological process which is colored according to the -log10(p.adjust). |
| Page: 1 2 3 4 5 6 7 8 9 |
| GO ID | Tissue | Disease Stage | Description | Gene Ratio | Bg Ratio | pvalue | p.adjust | Count |
| GO:0010498111 | Esophagus | ESCC | proteasomal protein catabolic process | 369/8552 | 490/18723 | 1.13e-41 | 1.80e-38 | 369 |
| GO:0043161111 | Esophagus | ESCC | proteasome-mediated ubiquitin-dependent protein catabolic process | 312/8552 | 412/18723 | 3.53e-36 | 4.48e-33 | 312 |
| GO:014001414 | Esophagus | ESCC | mitotic nuclear division | 218/8552 | 287/18723 | 6.17e-26 | 1.78e-23 | 218 |
| GO:000007011 | Esophagus | ESCC | mitotic sister chromatid segregation | 138/8552 | 168/18723 | 1.37e-22 | 2.63e-20 | 138 |
| GO:00008194 | Esophagus | ESCC | sister chromatid segregation | 157/8552 | 202/18723 | 8.41e-21 | 1.33e-18 | 157 |
| GO:003304416 | Esophagus | ESCC | regulation of chromosome organization | 145/8552 | 187/18723 | 3.80e-19 | 4.31e-17 | 145 |
| GO:000705911 | Esophagus | ESCC | chromosome segregation | 238/8552 | 346/18723 | 1.72e-18 | 1.82e-16 | 238 |
| GO:004477216 | Esophagus | ESCC | mitotic cell cycle phase transition | 281/8552 | 424/18723 | 4.63e-18 | 4.45e-16 | 281 |
| GO:001050617 | Esophagus | ESCC | regulation of autophagy | 220/8552 | 317/18723 | 6.72e-18 | 6.36e-16 | 220 |
| GO:000734615 | Esophagus | ESCC | regulation of mitotic cell cycle | 293/8552 | 457/18723 | 8.00e-16 | 5.64e-14 | 293 |
| GO:00482853 | Esophagus | ESCC | organelle fission | 301/8552 | 488/18723 | 4.64e-13 | 2.12e-11 | 301 |
| GO:00988133 | Esophagus | ESCC | nuclear chromosome segregation | 187/8552 | 281/18723 | 1.00e-12 | 4.36e-11 | 187 |
| GO:00002802 | Esophagus | ESCC | nuclear division | 270/8552 | 439/18723 | 1.17e-11 | 4.24e-10 | 270 |
| GO:190198713 | Esophagus | ESCC | regulation of cell cycle phase transition | 242/8552 | 390/18723 | 3.86e-11 | 1.26e-09 | 242 |
| GO:0016049110 | Esophagus | ESCC | cell growth | 289/8552 | 482/18723 | 1.29e-10 | 3.77e-09 | 289 |
| GO:190199013 | Esophagus | ESCC | regulation of mitotic cell cycle phase transition | 191/8552 | 299/18723 | 1.35e-10 | 3.94e-09 | 191 |
| GO:00457865 | Esophagus | ESCC | negative regulation of cell cycle | 236/8552 | 385/18723 | 3.62e-10 | 9.93e-09 | 236 |
| GO:0009895111 | Esophagus | ESCC | negative regulation of catabolic process | 201/8552 | 320/18723 | 3.88e-10 | 1.05e-08 | 201 |
| GO:00000754 | Esophagus | ESCC | cell cycle checkpoint | 117/8552 | 169/18723 | 4.47e-10 | 1.17e-08 | 117 |
| GO:0010639110 | Esophagus | ESCC | negative regulation of organelle organization | 215/8552 | 348/18723 | 8.20e-10 | 2.01e-08 | 215 |
| Page: 1 2 3 4 |
| Pathway ID | Tissue | Disease Stage | Description | Gene Ratio | Bg Ratio | pvalue | p.adjust | qvalue | Count |
| Page: 1 |
Top |
Cell-cell communication analysis |
| Identification of potential cell-cell interactions between two cell types and their ligand-receptor pairs for different disease states |
| Ligand | Receptor | LRpair | Pathway | Tissue | Disease Stage |
| Page: 1 |
Top |
Single-cell gene regulatory network inference analysis |
| Find out the significant the regulons (TFs) and the target genes of each regulon across cell types for different disease states |
| TF | Cell Type | Tissue | Disease Stage | Target Gene | RSS | Regulon Activity |
| ∗The dot plots of a searched regulon are shown for all cell subpopulations in each disease state of each tissue based on the regulon specific score inferred using pySCENIC and by calculating the average expression. |
| Page: 1 |
Top |
Somatic mutation of malignant transformation related genes |
| Annotation of somatic variants for genes involved in malignant transformation |
| Hugo Symbol | Variant Class | Variant Classification | dbSNP RS | HGVSc | HGVSp | HGVSp Short | SWISSPROT | BIOTYPE | SIFT | PolyPhen | Tumor Sample Barcode | Tissue | Histology | Sex | Age | Stage | Therapy Types | Drugs | Outcome |
| KLHL22 | insertion | In_Frame_Ins | novel | c.963_964insCGG | p.Leu321_Asn322insArg | p.L321_N322insR | Q53GT1 | protein_coding | TCGA-A7-A0CD-01 | Breast | breast invasive carcinoma | Female | >=65 | I/II | Hormone Therapy | arimidex | SD | ||
| KLHL22 | insertion | Nonsense_Mutation | novel | c.962_963insCTTTGGGGTAGGCTAGGTTGCGAGTGCATTGTGCAGGAGGAG | p.Leu321_Asn322insPheGlyValGlyTerValAlaSerAlaLeuCysArgArgArg | p.L321_N322insFGVG*VASALCRRR | Q53GT1 | protein_coding | TCGA-A7-A0CD-01 | Breast | breast invasive carcinoma | Female | >=65 | I/II | Hormone Therapy | arimidex | SD | ||
| KLHL22 | insertion | In_Frame_Ins | novel | c.909_910insAGA | p.Phe303_Gly304insArg | p.F303_G304insR | Q53GT1 | protein_coding | TCGA-BH-A0E2-01 | Breast | breast invasive carcinoma | Female | <65 | III/IV | Chemotherapy | doxorubicin | SD | ||
| KLHL22 | insertion | Nonsense_Mutation | novel | c.908_909insAAGCTGATGAGACT | p.Phe303LeufsTer3 | p.F303Lfs*3 | Q53GT1 | protein_coding | TCGA-BH-A0E2-01 | Breast | breast invasive carcinoma | Female | <65 | III/IV | Chemotherapy | doxorubicin | SD | ||
| KLHL22 | deletion | Frame_Shift_Del | novel | c.143delT | p.Ile48ThrfsTer36 | p.I48Tfs*36 | Q53GT1 | protein_coding | TCGA-D8-A27V-01 | Breast | breast invasive carcinoma | Female | <65 | I/II | Hormone Therapy | tamoxiphen | SD | ||
| KLHL22 | SNV | Missense_Mutation | rs184134803 | c.1207N>A | p.Ala403Thr | p.A403T | Q53GT1 | protein_coding | deleterious(0) | possibly_damaging(0.859) | TCGA-2W-A8YY-01 | Cervix | cervical & endocervical cancer | Female | <65 | I/II | Chemotherapy | cisplatin | CR |
| KLHL22 | SNV | Missense_Mutation | c.1655G>A | p.Arg552His | p.R552H | Q53GT1 | protein_coding | tolerated(0.09) | probably_damaging(0.999) | TCGA-EA-A5O9-01 | Cervix | cervical & endocervical cancer | Female | <65 | I/II | Unknown | Unknown | SD | |
| KLHL22 | SNV | Missense_Mutation | c.194N>A | p.Arg65His | p.R65H | Q53GT1 | protein_coding | deleterious(0) | probably_damaging(0.999) | TCGA-A6-2686-01 | Colorectum | colon adenocarcinoma | Female | >=65 | I/II | Unknown | Unknown | SD | |
| KLHL22 | SNV | Missense_Mutation | rs775705834 | c.1823G>A | p.Arg608His | p.R608H | Q53GT1 | protein_coding | deleterious(0.02) | benign(0) | TCGA-AA-3519-01 | Colorectum | colon adenocarcinoma | Male | <65 | III/IV | Unknown | Unknown | SD |
| KLHL22 | SNV | Missense_Mutation | c.1406G>A | p.Gly469Asp | p.G469D | Q53GT1 | protein_coding | tolerated(0.71) | benign(0) | TCGA-AD-6964-01 | Colorectum | colon adenocarcinoma | Male | <65 | III/IV | Chemotherapy | folfox | PD |
| Page: 1 2 3 4 5 6 7 8 |
Top |
Related drugs of malignant transformation related genes |
| Identification of chemicals and drugs interact with genes involved in malignant transfromation |
| (DGIdb 4.0) |
| Entrez ID | Symbol | Category | Interaction Types | Drug Claim Name | Drug Name | PMIDs |
| Page: 1 |

Copyright 2023-Present -The University of Texas Health Science Center at Houston |