
|
|||||
|
 | |
| |
| |
| |
| |
| |
|
Gene: KLHL21 |
Gene summary for KLHL21 |
| Gene information | Species | Human | Gene symbol | KLHL21 | Gene ID | 9903 |
| Gene name | kelch like family member 21 | |
| Gene Alias | KLHL21 | |
| Cytomap | 1p36.31 | |
| Gene Type | protein-coding | GO ID | GO:0000910 | UniProtAcc | Q9UJP4 |
Top |
Malignant transformation analysis |
| Identification of the aberrant gene expression in precancerous and cancerous lesions by comparing the gene expression of stem-like cells in diseased tissues with normal stem cells |
| Entrez ID | Symbol | Replicates | Species | Organ | Tissue | Adj P-value | Log2FC | Malignancy |
| 9903 | KLHL21 | LZE4T | Human | Esophagus | ESCC | 4.57e-11 | -2.51e-01 | 0.0811 |
| 9903 | KLHL21 | LZE7T | Human | Esophagus | ESCC | 4.54e-04 | 1.31e-02 | 0.0667 |
| 9903 | KLHL21 | LZE8T | Human | Esophagus | ESCC | 3.12e-09 | -2.07e-01 | 0.067 |
| 9903 | KLHL21 | LZE20T | Human | Esophagus | ESCC | 6.63e-06 | -2.32e-01 | 0.0662 |
| 9903 | KLHL21 | LZE21T | Human | Esophagus | ESCC | 3.00e-03 | -2.16e-01 | 0.0655 |
| 9903 | KLHL21 | P1T-E | Human | Esophagus | ESCC | 1.03e-06 | -1.39e-02 | 0.0875 |
| 9903 | KLHL21 | P2T-E | Human | Esophagus | ESCC | 2.03e-20 | -2.41e-01 | 0.1177 |
| 9903 | KLHL21 | P4T-E | Human | Esophagus | ESCC | 1.46e-11 | -1.01e-01 | 0.1323 |
| 9903 | KLHL21 | P5T-E | Human | Esophagus | ESCC | 4.09e-06 | -1.99e-01 | 0.1327 |
| 9903 | KLHL21 | P8T-E | Human | Esophagus | ESCC | 6.31e-12 | -3.23e-01 | 0.0889 |
| 9903 | KLHL21 | P9T-E | Human | Esophagus | ESCC | 3.47e-07 | -9.12e-02 | 0.1131 |
| 9903 | KLHL21 | P10T-E | Human | Esophagus | ESCC | 3.39e-12 | -2.13e-01 | 0.116 |
| 9903 | KLHL21 | P12T-E | Human | Esophagus | ESCC | 3.93e-12 | -2.12e-01 | 0.1122 |
| 9903 | KLHL21 | P15T-E | Human | Esophagus | ESCC | 8.58e-23 | 2.41e-02 | 0.1149 |
| 9903 | KLHL21 | P16T-E | Human | Esophagus | ESCC | 2.92e-18 | -2.09e-01 | 0.1153 |
| 9903 | KLHL21 | P19T-E | Human | Esophagus | ESCC | 8.69e-05 | -8.78e-02 | 0.1662 |
| 9903 | KLHL21 | P20T-E | Human | Esophagus | ESCC | 3.01e-16 | 1.91e-01 | 0.1124 |
| 9903 | KLHL21 | P21T-E | Human | Esophagus | ESCC | 5.75e-13 | 1.25e-01 | 0.1617 |
| 9903 | KLHL21 | P22T-E | Human | Esophagus | ESCC | 1.51e-11 | -2.95e-01 | 0.1236 |
| 9903 | KLHL21 | P23T-E | Human | Esophagus | ESCC | 1.71e-11 | -1.11e-01 | 0.108 |
| Page: 1 2 3 4 5 |
| Tissue | Expression Dynamics | Abbreviation |
| Esophagus | 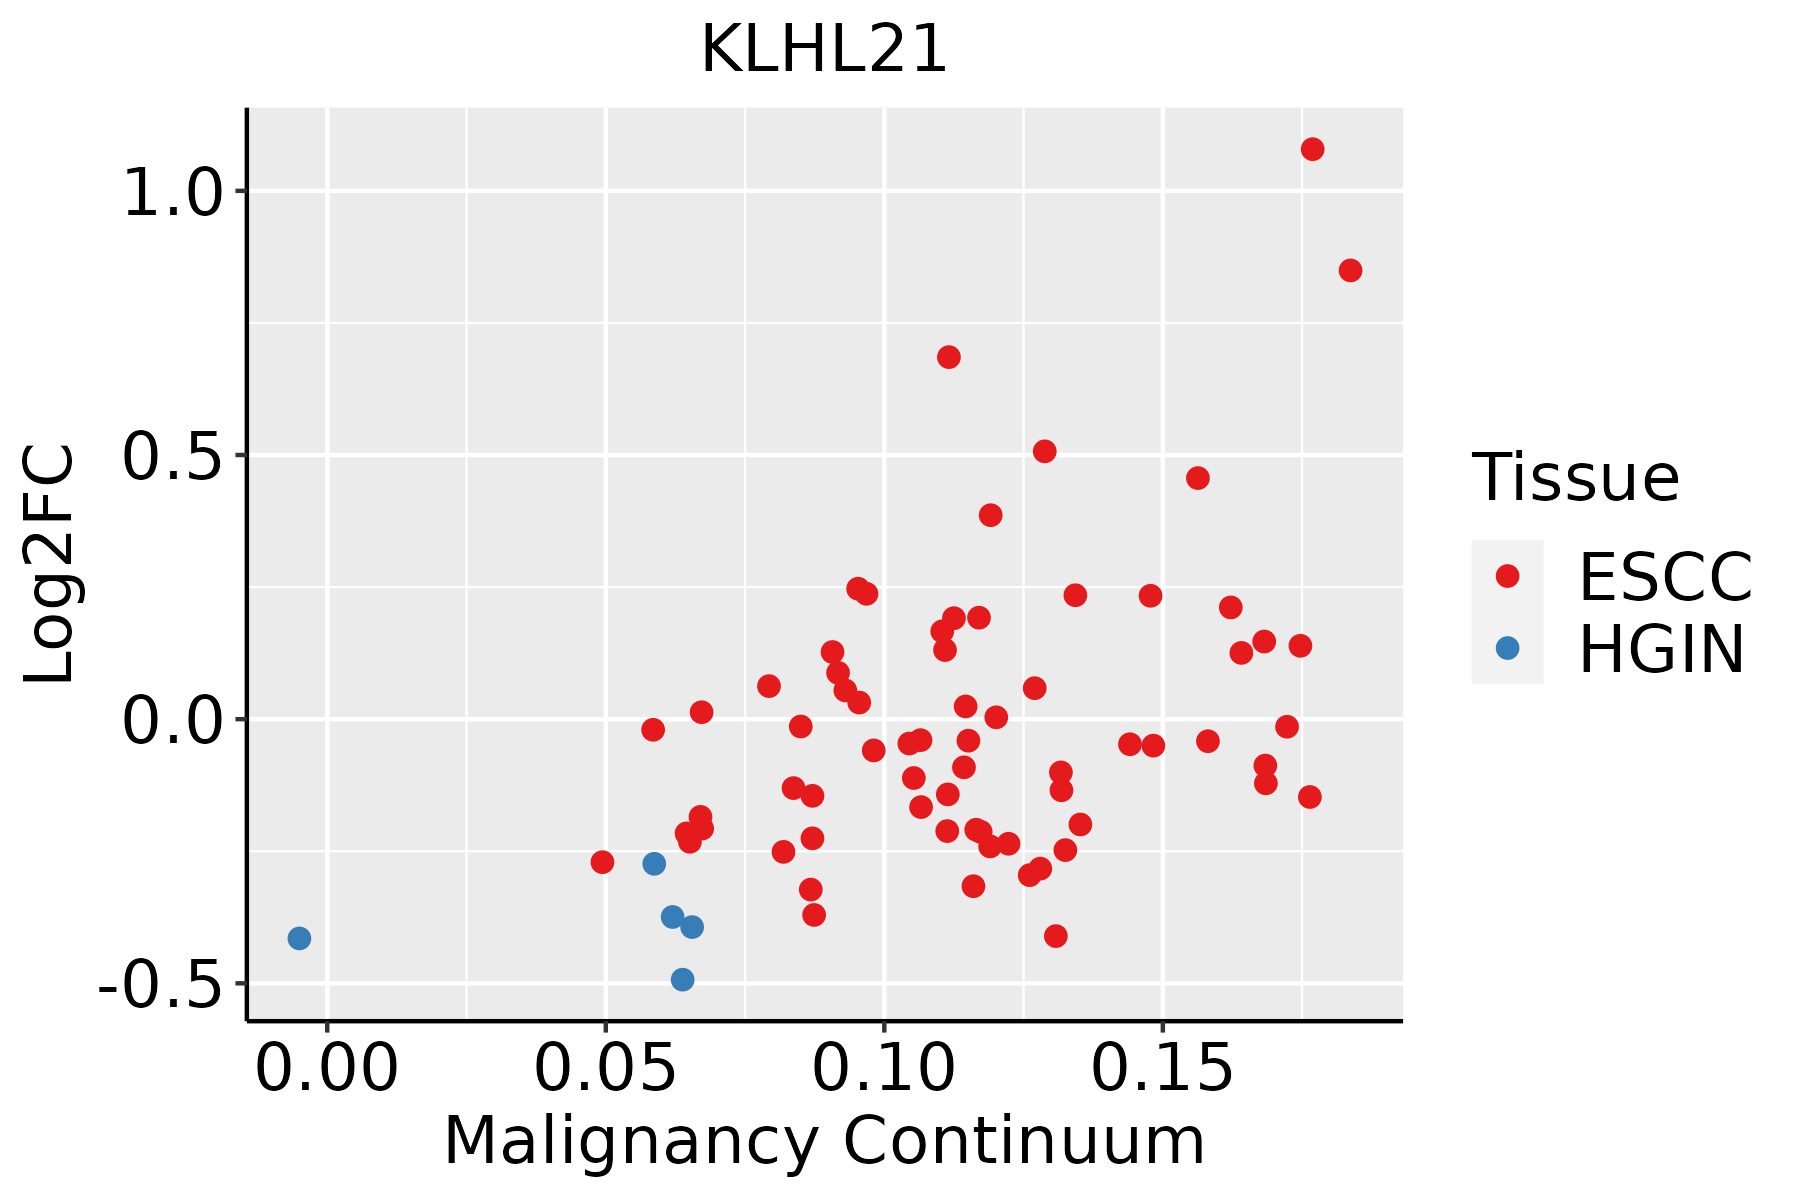 | ESCC: Esophageal squamous cell carcinoma |
| HGIN: High-grade intraepithelial neoplasias | ||
| LGIN: Low-grade intraepithelial neoplasias | ||
| Liver |  | HCC: Hepatocellular carcinoma |
| NAFLD: Non-alcoholic fatty liver disease | ||
| Oral Cavity | 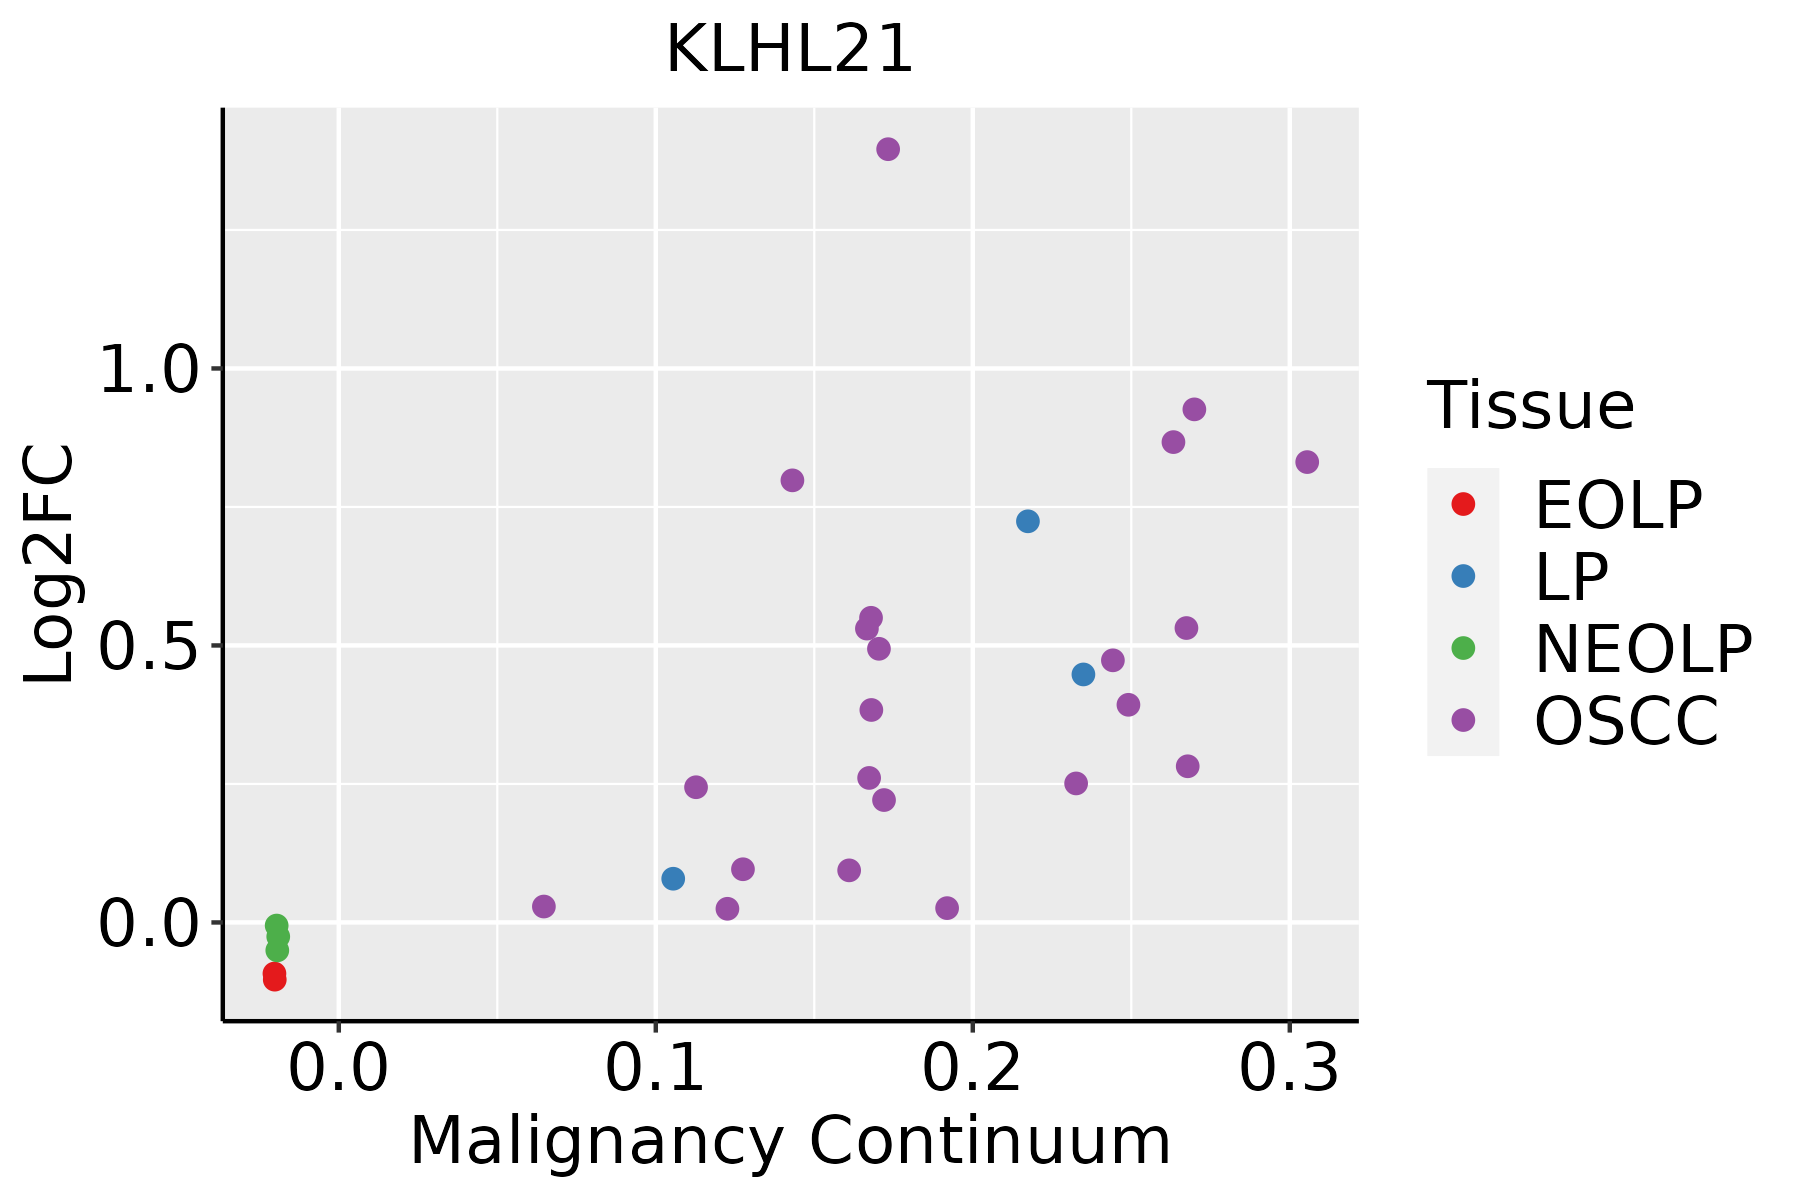 | EOLP: Erosive Oral lichen planus |
| LP: leukoplakia | ||
| NEOLP: Non-erosive oral lichen planus | ||
| OSCC: Oral squamous cell carcinoma | ||
| Prostate | 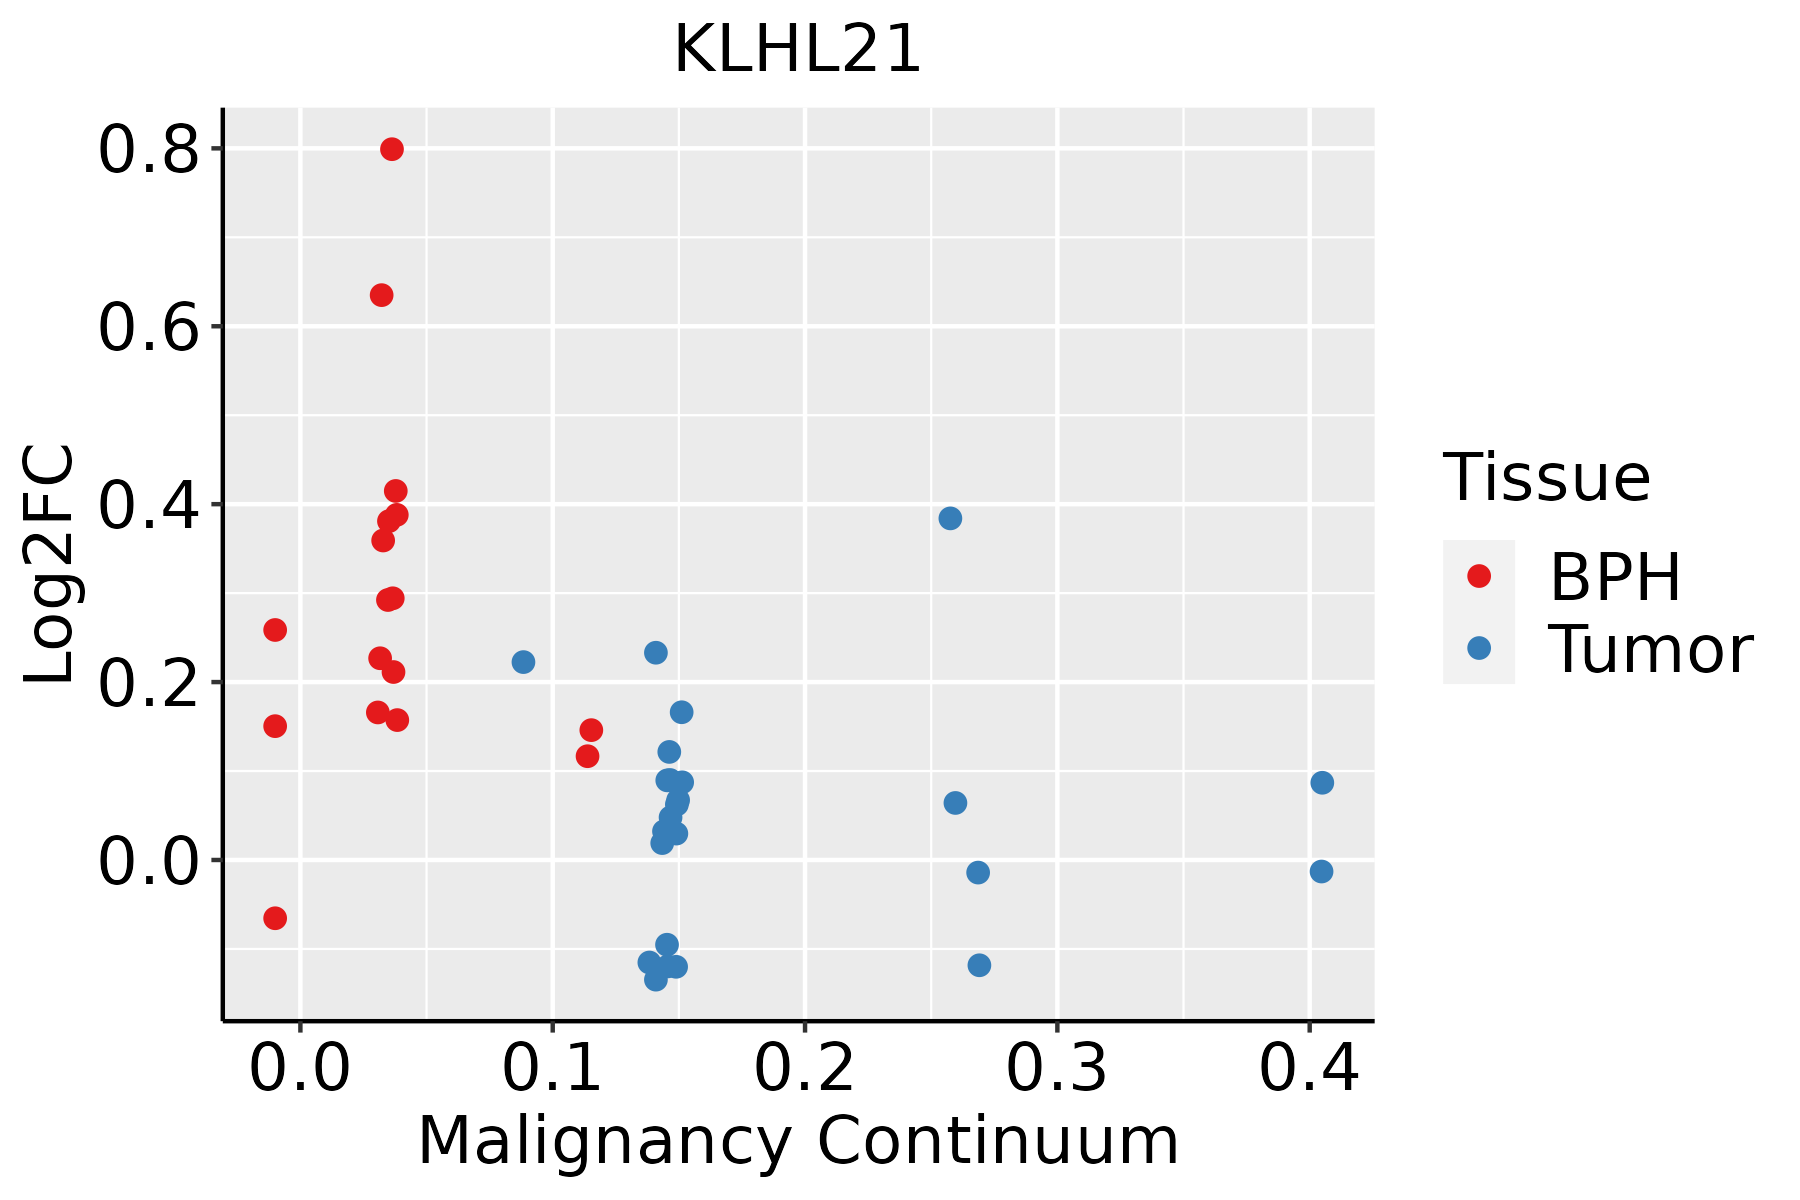 | BPH: Benign Prostatic Hyperplasia |
| Skin |  | AK: Actinic keratosis |
| cSCC: Cutaneous squamous cell carcinoma | ||
| SCCIS:squamous cell carcinoma in situ |
| ∗log2FC in expression of this searched gene in stem-like cells from each diseased tissue sample relative to stem-like cells in normal samples in each tissue plotted against the malignancy continuum. Samples are colored based on if they are from different disease stage. |
Top |
Malignant transformation related pathway analysis |
| Find out the enriched GO biological processes and KEGG pathways involved in transition from healthy to precancer to cancer |
| Tissue | Disease Stage | Enriched GO biological Processes |
| Colorectum | AD |  |
| Colorectum | SER |  |
| Colorectum | MSS |  |
| Colorectum | MSI-H |  |
| Colorectum | FAP |  |
| ∗Top 15 enriched GO BP terms are showed in the bar plot of each disease state in each tissue. Each row represents a significant GO biological process which is colored according to the -log10(p.adjust). |
| Page: 1 2 3 4 5 6 7 8 9 |
| GO ID | Tissue | Disease Stage | Description | Gene Ratio | Bg Ratio | pvalue | p.adjust | Count |
| GO:000091016 | Esophagus | ESCC | cytokinesis | 115/8552 | 173/18723 | 2.48e-08 | 4.68e-07 | 115 |
| GO:003150314 | Esophagus | ESCC | protein-containing complex localization | 139/8552 | 220/18723 | 1.14e-07 | 1.85e-06 | 139 |
| GO:00443804 | Esophagus | ESCC | protein localization to cytoskeleton | 45/8552 | 58/18723 | 6.89e-07 | 8.99e-06 | 45 |
| GO:00324653 | Esophagus | ESCC | regulation of cytokinesis | 57/8552 | 92/18723 | 1.20e-03 | 5.88e-03 | 57 |
| GO:00513025 | Esophagus | ESCC | regulation of cell division | 97/8552 | 177/18723 | 8.93e-03 | 3.12e-02 | 97 |
| GO:00315031 | Liver | HCC | protein-containing complex localization | 129/7958 | 220/18723 | 9.38e-07 | 1.42e-05 | 129 |
| GO:000091011 | Liver | HCC | cytokinesis | 100/7958 | 173/18723 | 3.38e-05 | 3.39e-04 | 100 |
| GO:00443802 | Liver | HCC | protein localization to cytoskeleton | 38/7958 | 58/18723 | 3.37e-04 | 2.36e-03 | 38 |
| GO:0034629 | Liver | HCC | cellular protein-containing complex localization | 17/7958 | 22/18723 | 9.84e-04 | 5.70e-03 | 17 |
| GO:00315034 | Oral cavity | OSCC | protein-containing complex localization | 123/7305 | 220/18723 | 2.54e-07 | 4.00e-06 | 123 |
| GO:000091010 | Oral cavity | OSCC | cytokinesis | 97/7305 | 173/18723 | 3.82e-06 | 4.51e-05 | 97 |
| GO:00513024 | Oral cavity | OSCC | regulation of cell division | 87/7305 | 177/18723 | 3.75e-03 | 1.55e-02 | 87 |
| GO:00324652 | Oral cavity | OSCC | regulation of cytokinesis | 49/7305 | 92/18723 | 3.81e-03 | 1.57e-02 | 49 |
| GO:00443803 | Oral cavity | OSCC | protein localization to cytoskeleton | 33/7305 | 58/18723 | 4.32e-03 | 1.75e-02 | 33 |
| GO:00009109 | Prostate | BPH | cytokinesis | 55/3107 | 173/18723 | 5.81e-07 | 1.15e-05 | 55 |
| GO:00315033 | Prostate | BPH | protein-containing complex localization | 59/3107 | 220/18723 | 8.01e-05 | 7.66e-04 | 59 |
| GO:00324651 | Prostate | BPH | regulation of cytokinesis | 25/3107 | 92/18723 | 7.02e-03 | 3.14e-02 | 25 |
| GO:00513023 | Prostate | BPH | regulation of cell division | 42/3107 | 177/18723 | 8.93e-03 | 3.82e-02 | 42 |
| GO:000091014 | Prostate | Tumor | cytokinesis | 55/3246 | 173/18723 | 2.37e-06 | 4.02e-05 | 55 |
| GO:003150312 | Prostate | Tumor | protein-containing complex localization | 59/3246 | 220/18723 | 2.71e-04 | 2.24e-03 | 59 |
| Page: 1 2 |
| Pathway ID | Tissue | Disease Stage | Description | Gene Ratio | Bg Ratio | pvalue | p.adjust | qvalue | Count |
| Page: 1 |
Top |
Cell-cell communication analysis |
| Identification of potential cell-cell interactions between two cell types and their ligand-receptor pairs for different disease states |
| Ligand | Receptor | LRpair | Pathway | Tissue | Disease Stage |
| Page: 1 |
Top |
Single-cell gene regulatory network inference analysis |
| Find out the significant the regulons (TFs) and the target genes of each regulon across cell types for different disease states |
| TF | Cell Type | Tissue | Disease Stage | Target Gene | RSS | Regulon Activity |
| ∗The dot plots of a searched regulon are shown for all cell subpopulations in each disease state of each tissue based on the regulon specific score inferred using pySCENIC and by calculating the average expression. |
| Page: 1 |
Top |
Somatic mutation of malignant transformation related genes |
| Annotation of somatic variants for genes involved in malignant transformation |
| Hugo Symbol | Variant Class | Variant Classification | dbSNP RS | HGVSc | HGVSp | HGVSp Short | SWISSPROT | BIOTYPE | SIFT | PolyPhen | Tumor Sample Barcode | Tissue | Histology | Sex | Age | Stage | Therapy Types | Drugs | Outcome |
| KLHL21 | SNV | Missense_Mutation | novel | c.862C>G | p.Leu288Val | p.L288V | Q9UJP4 | protein_coding | deleterious(0.02) | possibly_damaging(0.746) | TCGA-C5-A8XI-01 | Cervix | cervical & endocervical cancer | Female | >=65 | I/II | Chemotherapy | cisplatin | SD |
| KLHL21 | SNV | Missense_Mutation | novel | c.1726N>A | p.Asp576Asn | p.D576N | Q9UJP4 | protein_coding | tolerated_low_confidence(0.15) | benign(0.243) | TCGA-VS-A8EB-01 | Cervix | cervical & endocervical cancer | Female | <65 | III/IV | Unknown | Unknown | PD |
| KLHL21 | SNV | Missense_Mutation | rs760923196 | c.1633N>T | p.Arg545Trp | p.R545W | Q9UJP4 | protein_coding | deleterious(0.01) | benign(0.015) | TCGA-VS-A8EG-01 | Cervix | cervical & endocervical cancer | Female | <65 | I/II | Unknown | Unknown | SD |
| KLHL21 | SNV | Missense_Mutation | rs140427901 | c.1525N>A | p.Val509Ile | p.V509I | Q9UJP4 | protein_coding | deleterious(0.02) | benign(0.335) | TCGA-AA-3492-01 | Colorectum | colon adenocarcinoma | Female | >=65 | I/II | Unknown | Unknown | SD |
| KLHL21 | SNV | Missense_Mutation | rs760923196 | c.1633N>T | p.Arg545Trp | p.R545W | Q9UJP4 | protein_coding | deleterious(0.01) | benign(0.015) | TCGA-AD-6895-01 | Colorectum | colon adenocarcinoma | Male | >=65 | III/IV | Unknown | Unknown | SD |
| KLHL21 | SNV | Missense_Mutation | rs771664109 | c.1196C>T | p.Thr399Ile | p.T399I | Q9UJP4 | protein_coding | tolerated(0.42) | benign(0.001) | TCGA-AZ-6607-01 | Colorectum | colon adenocarcinoma | Male | >=65 | III/IV | Unknown | Unknown | PD |
| KLHL21 | SNV | Missense_Mutation | rs758876745 | c.1616N>T | p.Ala539Val | p.A539V | Q9UJP4 | protein_coding | tolerated(0.29) | benign(0.104) | TCGA-NH-A5IV-01 | Colorectum | colon adenocarcinoma | Female | >=65 | I/II | Unknown | Unknown | SD |
| KLHL21 | SNV | Missense_Mutation | novel | c.1460C>T | p.Pro487Leu | p.P487L | Q9UJP4 | protein_coding | deleterious(0) | probably_damaging(0.999) | TCGA-A5-A1OF-01 | Endometrium | uterine corpus endometrioid carcinoma | Female | <65 | I/II | Unknown | Unknown | SD |
| KLHL21 | SNV | Missense_Mutation | rs140427901 | c.1525N>A | p.Val509Ile | p.V509I | Q9UJP4 | protein_coding | deleterious(0.02) | benign(0.335) | TCGA-AJ-A3OJ-01 | Endometrium | uterine corpus endometrioid carcinoma | Female | <65 | I/II | Chemotherapy | carboplatin | CR |
| KLHL21 | SNV | Missense_Mutation | novel | c.1579N>C | p.Ser527Pro | p.S527P | Q9UJP4 | protein_coding | deleterious(0.01) | probably_damaging(0.995) | TCGA-AP-A059-01 | Endometrium | uterine corpus endometrioid carcinoma | Female | >=65 | I/II | Unknown | Unknown | SD |
| Page: 1 2 3 |
Top |
Related drugs of malignant transformation related genes |
| Identification of chemicals and drugs interact with genes involved in malignant transfromation |
| (DGIdb 4.0) |
| Entrez ID | Symbol | Category | Interaction Types | Drug Claim Name | Drug Name | PMIDs |
| Page: 1 |

Copyright 2023-Present -The University of Texas Health Science Center at Houston |