
|
|||||
|
 | |
| |
| |
| |
| |
| |
|
Gene: KLHL20 |
Gene summary for KLHL20 |
| Gene information | Species | Human | Gene symbol | KLHL20 | Gene ID | 27252 |
| Gene name | kelch like family member 20 | |
| Gene Alias | KHLHX | |
| Cytomap | 1q25.1 | |
| Gene Type | protein-coding | GO ID | GO:0000209 | UniProtAcc | A0A024R940 |
Top |
Malignant transformation analysis |
| Identification of the aberrant gene expression in precancerous and cancerous lesions by comparing the gene expression of stem-like cells in diseased tissues with normal stem cells |
| Entrez ID | Symbol | Replicates | Species | Organ | Tissue | Adj P-value | Log2FC | Malignancy |
| 27252 | KLHL20 | CCI_1 | Human | Cervix | CC | 9.74e-09 | 7.44e-01 | 0.528 |
| 27252 | KLHL20 | CCI_3 | Human | Cervix | CC | 1.33e-05 | 6.39e-01 | 0.516 |
| 27252 | KLHL20 | LZE4T | Human | Esophagus | ESCC | 2.71e-02 | 1.35e-01 | 0.0811 |
| 27252 | KLHL20 | LZE24T | Human | Esophagus | ESCC | 7.17e-05 | 1.48e-01 | 0.0596 |
| 27252 | KLHL20 | P2T-E | Human | Esophagus | ESCC | 1.64e-19 | 2.93e-01 | 0.1177 |
| 27252 | KLHL20 | P4T-E | Human | Esophagus | ESCC | 5.40e-11 | 2.42e-01 | 0.1323 |
| 27252 | KLHL20 | P5T-E | Human | Esophagus | ESCC | 1.13e-07 | 1.28e-01 | 0.1327 |
| 27252 | KLHL20 | P8T-E | Human | Esophagus | ESCC | 7.68e-11 | 2.20e-01 | 0.0889 |
| 27252 | KLHL20 | P9T-E | Human | Esophagus | ESCC | 3.52e-11 | 2.77e-01 | 0.1131 |
| 27252 | KLHL20 | P10T-E | Human | Esophagus | ESCC | 7.67e-14 | 2.96e-01 | 0.116 |
| 27252 | KLHL20 | P11T-E | Human | Esophagus | ESCC | 2.44e-07 | 2.71e-01 | 0.1426 |
| 27252 | KLHL20 | P12T-E | Human | Esophagus | ESCC | 5.60e-06 | 1.90e-01 | 0.1122 |
| 27252 | KLHL20 | P15T-E | Human | Esophagus | ESCC | 2.60e-13 | 2.15e-01 | 0.1149 |
| 27252 | KLHL20 | P16T-E | Human | Esophagus | ESCC | 1.55e-09 | 2.30e-01 | 0.1153 |
| 27252 | KLHL20 | P20T-E | Human | Esophagus | ESCC | 1.22e-09 | 2.59e-01 | 0.1124 |
| 27252 | KLHL20 | P21T-E | Human | Esophagus | ESCC | 4.82e-13 | 2.82e-01 | 0.1617 |
| 27252 | KLHL20 | P22T-E | Human | Esophagus | ESCC | 2.31e-18 | 2.43e-01 | 0.1236 |
| 27252 | KLHL20 | P23T-E | Human | Esophagus | ESCC | 9.45e-10 | 2.60e-01 | 0.108 |
| 27252 | KLHL20 | P26T-E | Human | Esophagus | ESCC | 6.62e-13 | 2.35e-01 | 0.1276 |
| 27252 | KLHL20 | P27T-E | Human | Esophagus | ESCC | 1.68e-07 | 1.64e-01 | 0.1055 |
| Page: 1 2 3 |
| Tissue | Expression Dynamics | Abbreviation |
| Cervix |  | CC: Cervix cancer |
| HSIL_HPV: HPV-infected high-grade squamous intraepithelial lesions | ||
| N_HPV: HPV-infected normal cervix | ||
| Esophagus | 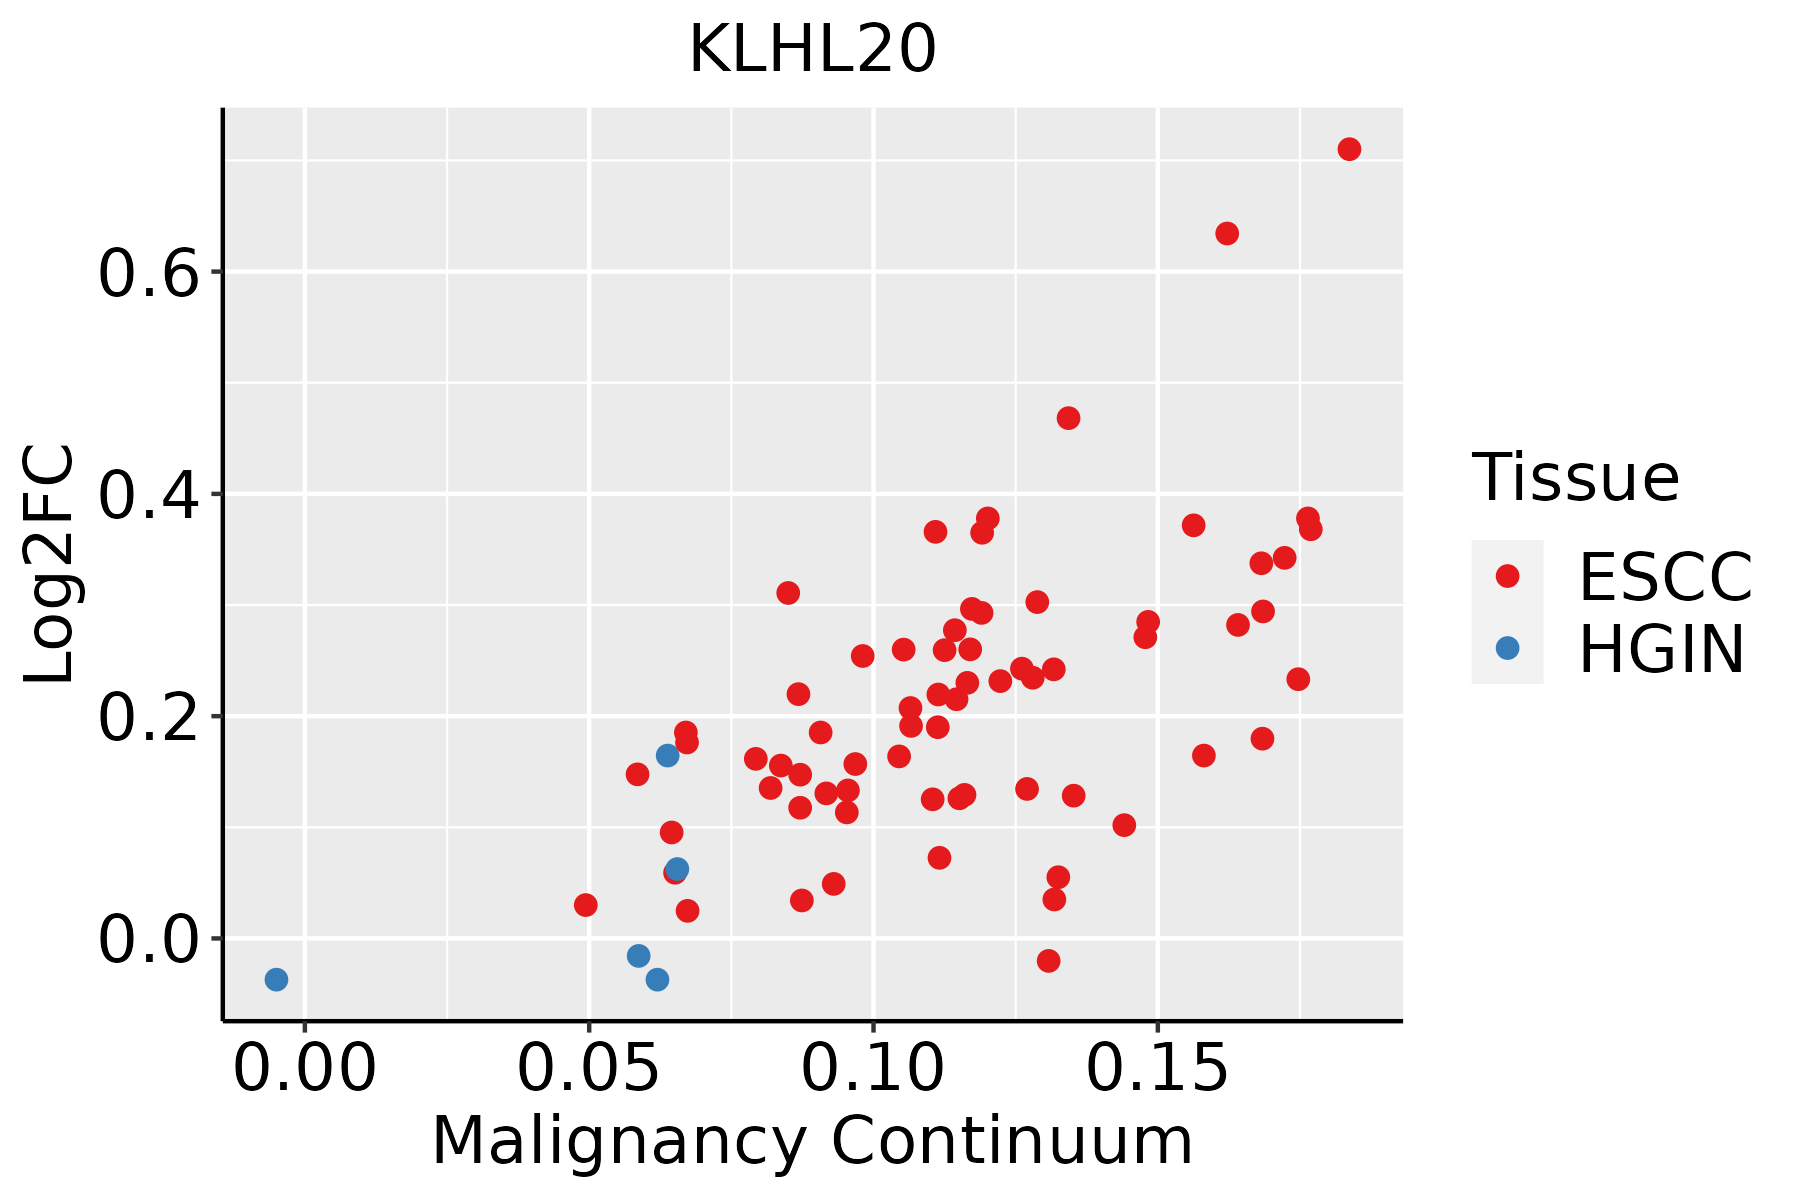 | ESCC: Esophageal squamous cell carcinoma |
| HGIN: High-grade intraepithelial neoplasias | ||
| LGIN: Low-grade intraepithelial neoplasias | ||
| Lung | 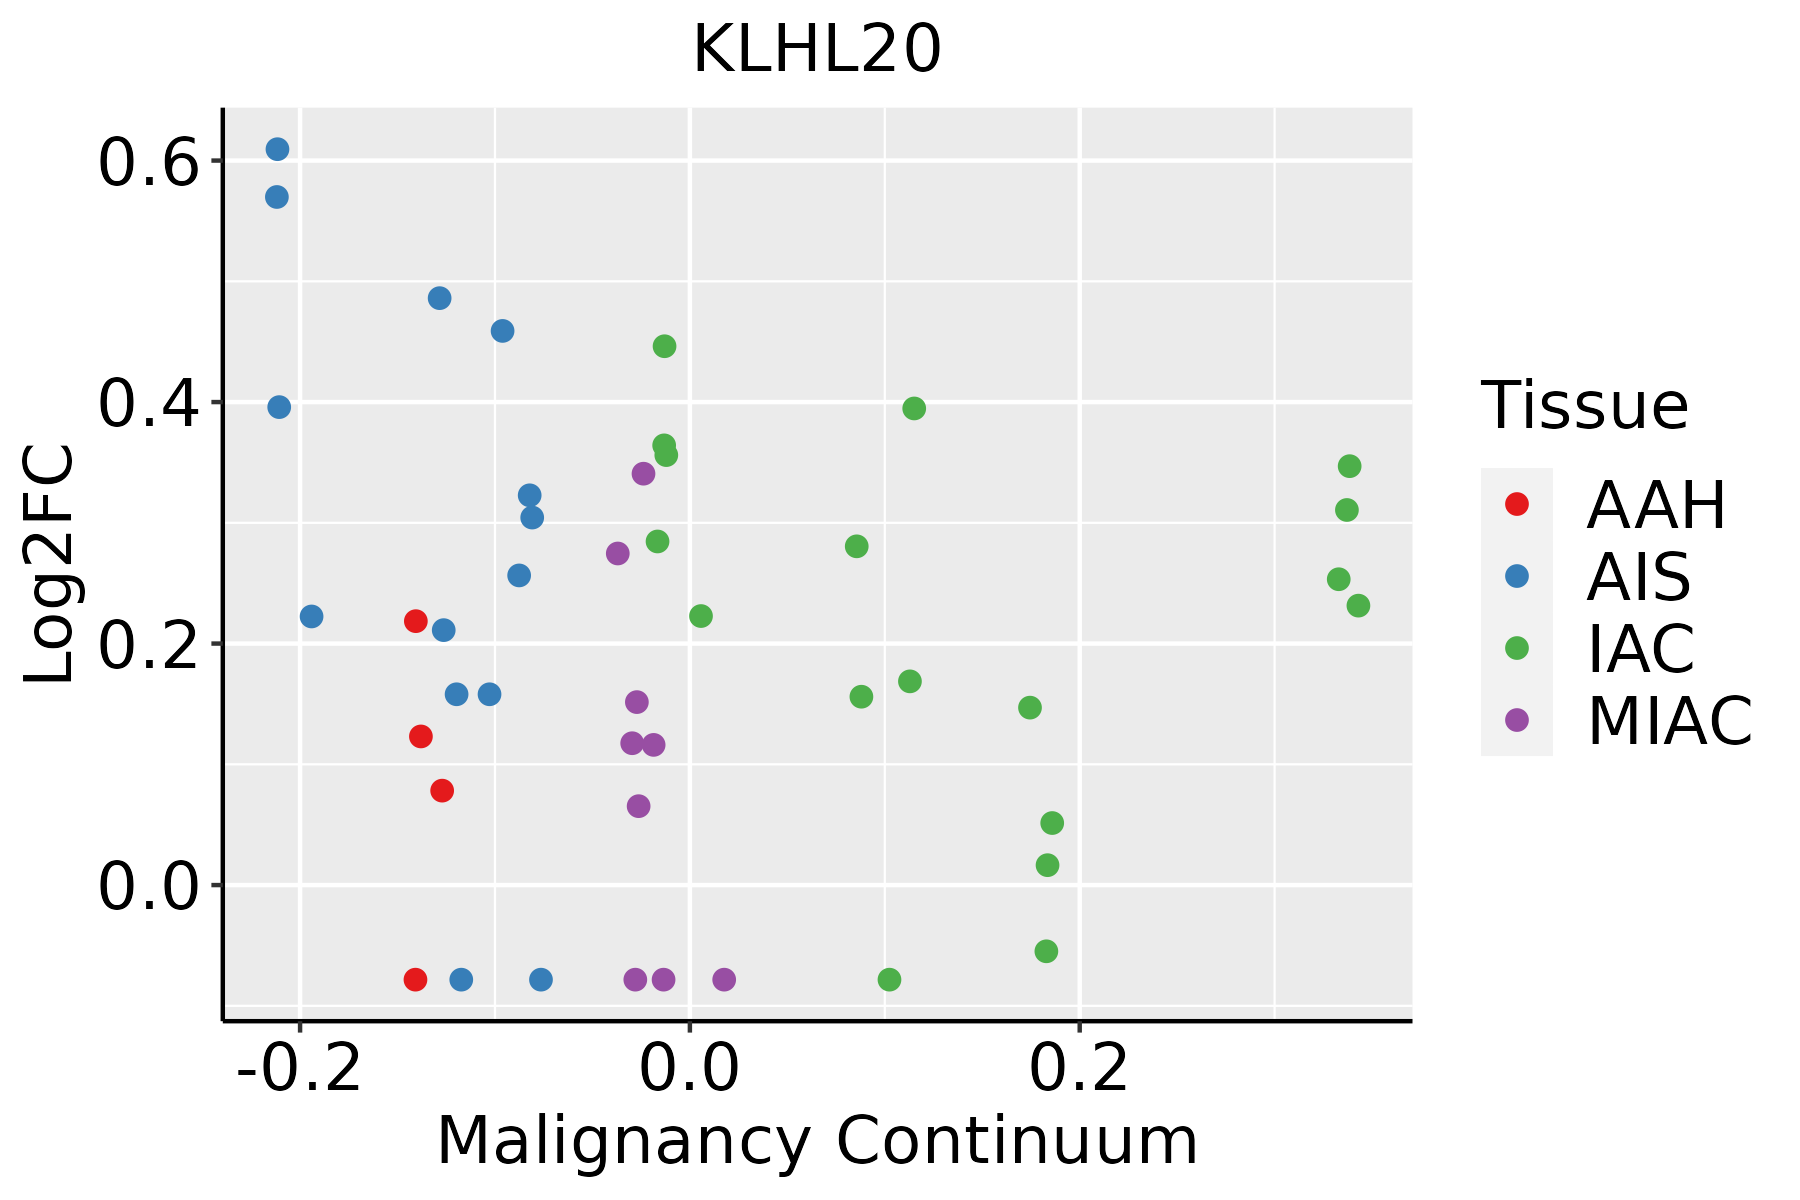 | AAH: Atypical adenomatous hyperplasia |
| AIS: Adenocarcinoma in situ | ||
| IAC: Invasive lung adenocarcinoma | ||
| MIA: Minimally invasive adenocarcinoma |
| ∗log2FC in expression of this searched gene in stem-like cells from each diseased tissue sample relative to stem-like cells in normal samples in each tissue plotted against the malignancy continuum. Samples are colored based on if they are from different disease stage. |
Top |
Malignant transformation related pathway analysis |
| Find out the enriched GO biological processes and KEGG pathways involved in transition from healthy to precancer to cancer |
| Tissue | Disease Stage | Enriched GO biological Processes |
| Colorectum | AD |  |
| Colorectum | SER |  |
| Colorectum | MSS |  |
| Colorectum | MSI-H |  |
| Colorectum | FAP |  |
| ∗Top 15 enriched GO BP terms are showed in the bar plot of each disease state in each tissue. Each row represents a significant GO biological process which is colored according to the -log10(p.adjust). |
| Page: 1 2 3 4 5 6 7 8 9 |
| GO ID | Tissue | Disease Stage | Description | Gene Ratio | Bg Ratio | pvalue | p.adjust | Count |
| GO:001049810 | Cervix | CC | proteasomal protein catabolic process | 111/2311 | 490/18723 | 8.98e-11 | 1.58e-08 | 111 |
| GO:004316110 | Cervix | CC | proteasome-mediated ubiquitin-dependent protein catabolic process | 91/2311 | 412/18723 | 1.65e-08 | 1.25e-06 | 91 |
| GO:00002097 | Cervix | CC | protein polyubiquitination | 58/2311 | 236/18723 | 1.57e-07 | 7.41e-06 | 58 |
| GO:00068927 | Cervix | CC | post-Golgi vesicle-mediated transport | 28/2311 | 104/18723 | 4.31e-05 | 6.61e-04 | 28 |
| GO:00481938 | Cervix | CC | Golgi vesicle transport | 58/2311 | 296/18723 | 2.24e-04 | 2.54e-03 | 58 |
| GO:00164827 | Cervix | CC | cytosolic transport | 33/2311 | 168/18723 | 4.43e-03 | 2.70e-02 | 33 |
| GO:0010498111 | Esophagus | ESCC | proteasomal protein catabolic process | 369/8552 | 490/18723 | 1.13e-41 | 1.80e-38 | 369 |
| GO:0043161111 | Esophagus | ESCC | proteasome-mediated ubiquitin-dependent protein catabolic process | 312/8552 | 412/18723 | 3.53e-36 | 4.48e-33 | 312 |
| GO:004819318 | Esophagus | ESCC | Golgi vesicle transport | 231/8552 | 296/18723 | 1.82e-30 | 9.63e-28 | 231 |
| GO:000020917 | Esophagus | ESCC | protein polyubiquitination | 170/8552 | 236/18723 | 1.40e-16 | 1.09e-14 | 170 |
| GO:001648210 | Esophagus | ESCC | cytosolic transport | 124/8552 | 168/18723 | 9.69e-14 | 4.69e-12 | 124 |
| GO:000689215 | Esophagus | ESCC | post-Golgi vesicle-mediated transport | 82/8552 | 104/18723 | 4.00e-12 | 1.55e-10 | 82 |
| GO:00354555 | Esophagus | ESCC | response to interferon-alpha | 17/8552 | 21/18723 | 1.03e-03 | 5.19e-03 | 17 |
| GO:00068953 | Esophagus | ESCC | Golgi to endosome transport | 13/8552 | 17/18723 | 1.00e-02 | 3.42e-02 | 13 |
| GO:00104988 | Lung | IAC | proteasomal protein catabolic process | 90/2061 | 490/18723 | 6.69e-07 | 3.89e-05 | 90 |
| GO:00431618 | Lung | IAC | proteasome-mediated ubiquitin-dependent protein catabolic process | 78/2061 | 412/18723 | 1.10e-06 | 6.02e-05 | 78 |
| GO:00002096 | Lung | IAC | protein polyubiquitination | 49/2061 | 236/18723 | 8.51e-06 | 2.89e-04 | 49 |
| GO:00068926 | Lung | IAC | post-Golgi vesicle-mediated transport | 27/2061 | 104/18723 | 1.54e-05 | 4.49e-04 | 27 |
| GO:00164826 | Lung | IAC | cytosolic transport | 37/2061 | 168/18723 | 2.74e-05 | 7.26e-04 | 37 |
| GO:00068952 | Lung | IAC | Golgi to endosome transport | 7/2061 | 17/18723 | 1.39e-03 | 1.53e-02 | 7 |
| Page: 1 2 |
| Pathway ID | Tissue | Disease Stage | Description | Gene Ratio | Bg Ratio | pvalue | p.adjust | qvalue | Count |
| Page: 1 |
Top |
Cell-cell communication analysis |
| Identification of potential cell-cell interactions between two cell types and their ligand-receptor pairs for different disease states |
| Ligand | Receptor | LRpair | Pathway | Tissue | Disease Stage |
| Page: 1 |
Top |
Single-cell gene regulatory network inference analysis |
| Find out the significant the regulons (TFs) and the target genes of each regulon across cell types for different disease states |
| TF | Cell Type | Tissue | Disease Stage | Target Gene | RSS | Regulon Activity |
| ∗The dot plots of a searched regulon are shown for all cell subpopulations in each disease state of each tissue based on the regulon specific score inferred using pySCENIC and by calculating the average expression. |
| Page: 1 |
Top |
Somatic mutation of malignant transformation related genes |
| Annotation of somatic variants for genes involved in malignant transformation |
| Hugo Symbol | Variant Class | Variant Classification | dbSNP RS | HGVSc | HGVSp | HGVSp Short | SWISSPROT | BIOTYPE | SIFT | PolyPhen | Tumor Sample Barcode | Tissue | Histology | Sex | Age | Stage | Therapy Types | Drugs | Outcome |
| KLHL20 | SNV | Missense_Mutation | c.514G>T | p.Gly172Cys | p.G172C | Q9Y2M5 | protein_coding | deleterious(0) | probably_damaging(0.999) | TCGA-A2-A25A-01 | Breast | breast invasive carcinoma | Female | <65 | I/II | Unspecific | Cytoxan | SD | |
| KLHL20 | SNV | Missense_Mutation | c.417N>T | p.Gln139His | p.Q139H | Q9Y2M5 | protein_coding | deleterious(0) | possibly_damaging(0.774) | TCGA-AO-A03R-01 | Breast | breast invasive carcinoma | Female | <65 | I/II | Chemotherapy | doxorubicin | SD | |
| KLHL20 | SNV | Missense_Mutation | c.1111N>C | p.Gly371Arg | p.G371R | Q9Y2M5 | protein_coding | deleterious(0) | probably_damaging(0.999) | TCGA-B6-A0RG-01 | Breast | breast invasive carcinoma | Female | <65 | I/II | Unknown | Unknown | SD | |
| KLHL20 | SNV | Missense_Mutation | novel | c.664G>A | p.Glu222Lys | p.E222K | Q9Y2M5 | protein_coding | tolerated(0.29) | benign(0.062) | TCGA-C8-A3M7-01 | Breast | breast invasive carcinoma | Female | <65 | III/IV | Unknown | Unknown | PD |
| KLHL20 | SNV | Missense_Mutation | c.1648G>A | p.Ala550Thr | p.A550T | Q9Y2M5 | protein_coding | deleterious(0.03) | possibly_damaging(0.629) | TCGA-E9-A1NA-01 | Breast | breast invasive carcinoma | Female | <65 | I/II | Chemotherapy | cyclophosphamide | SD | |
| KLHL20 | SNV | Missense_Mutation | novel | c.71G>A | p.Arg24His | p.R24H | Q9Y2M5 | protein_coding | deleterious(0.04) | benign(0.099) | TCGA-2W-A8YY-01 | Cervix | cervical & endocervical cancer | Female | <65 | I/II | Chemotherapy | cisplatin | CR |
| KLHL20 | SNV | Missense_Mutation | novel | c.1363G>C | p.Val455Leu | p.V455L | Q9Y2M5 | protein_coding | tolerated(0.12) | probably_damaging(0.955) | TCGA-2W-A8YY-01 | Cervix | cervical & endocervical cancer | Female | <65 | I/II | Chemotherapy | cisplatin | CR |
| KLHL20 | SNV | Missense_Mutation | c.1183G>A | p.Asp395Asn | p.D395N | Q9Y2M5 | protein_coding | tolerated(0.24) | benign(0.025) | TCGA-C5-A3HE-01 | Cervix | cervical & endocervical cancer | Female | <65 | I/II | Unknown | Unknown | PD | |
| KLHL20 | SNV | Missense_Mutation | c.1349N>T | p.Arg450Ile | p.R450I | Q9Y2M5 | protein_coding | deleterious(0) | probably_damaging(1) | TCGA-IR-A3LA-01 | Cervix | cervical & endocervical cancer | Female | <65 | I/II | Chemotherapy | cisplatin | CR | |
| KLHL20 | SNV | Missense_Mutation | novel | c.1070N>A | p.Gly357Glu | p.G357E | Q9Y2M5 | protein_coding | tolerated(0.17) | probably_damaging(1) | TCGA-VS-A959-01 | Cervix | cervical & endocervical cancer | Female | >=65 | I/II | Unknown | Unknown | SD |
| Page: 1 2 3 4 5 6 7 |
Top |
Related drugs of malignant transformation related genes |
| Identification of chemicals and drugs interact with genes involved in malignant transfromation |
| (DGIdb 4.0) |
| Entrez ID | Symbol | Category | Interaction Types | Drug Claim Name | Drug Name | PMIDs |
| Page: 1 |

Copyright 2023-Present -The University of Texas Health Science Center at Houston |