
|
|||||
|
 | |
| |
| |
| |
| |
| |
|
Gene: KLHL18 |
Gene summary for KLHL18 |
| Gene information | Species | Human | Gene symbol | KLHL18 | Gene ID | 23276 |
| Gene name | kelch like family member 18 | |
| Gene Alias | KLHL18 | |
| Cytomap | 3p21.31 | |
| Gene Type | protein-coding | GO ID | GO:0000278 | UniProtAcc | A0A024R2T4 |
Top |
Malignant transformation analysis |
| Identification of the aberrant gene expression in precancerous and cancerous lesions by comparing the gene expression of stem-like cells in diseased tissues with normal stem cells |
| Entrez ID | Symbol | Replicates | Species | Organ | Tissue | Adj P-value | Log2FC | Malignancy |
| 23276 | KLHL18 | LZE4T | Human | Esophagus | ESCC | 1.20e-04 | 7.69e-02 | 0.0811 |
| 23276 | KLHL18 | LZE22T | Human | Esophagus | ESCC | 4.50e-02 | 2.05e-01 | 0.068 |
| 23276 | KLHL18 | P2T-E | Human | Esophagus | ESCC | 1.12e-05 | 5.65e-02 | 0.1177 |
| 23276 | KLHL18 | P4T-E | Human | Esophagus | ESCC | 1.00e-07 | 1.41e-01 | 0.1323 |
| 23276 | KLHL18 | P5T-E | Human | Esophagus | ESCC | 1.82e-12 | 6.80e-02 | 0.1327 |
| 23276 | KLHL18 | P8T-E | Human | Esophagus | ESCC | 3.00e-04 | 3.55e-02 | 0.0889 |
| 23276 | KLHL18 | P9T-E | Human | Esophagus | ESCC | 1.08e-02 | 1.20e-02 | 0.1131 |
| 23276 | KLHL18 | P10T-E | Human | Esophagus | ESCC | 7.79e-07 | 1.03e-01 | 0.116 |
| 23276 | KLHL18 | P11T-E | Human | Esophagus | ESCC | 1.07e-02 | 7.18e-02 | 0.1426 |
| 23276 | KLHL18 | P12T-E | Human | Esophagus | ESCC | 1.46e-05 | 1.13e-01 | 0.1122 |
| 23276 | KLHL18 | P15T-E | Human | Esophagus | ESCC | 2.05e-04 | 8.84e-02 | 0.1149 |
| 23276 | KLHL18 | P16T-E | Human | Esophagus | ESCC | 3.27e-06 | 3.94e-02 | 0.1153 |
| 23276 | KLHL18 | P17T-E | Human | Esophagus | ESCC | 5.04e-03 | 1.15e-01 | 0.1278 |
| 23276 | KLHL18 | P19T-E | Human | Esophagus | ESCC | 4.82e-02 | 1.42e-01 | 0.1662 |
| 23276 | KLHL18 | P20T-E | Human | Esophagus | ESCC | 1.31e-06 | 9.64e-02 | 0.1124 |
| 23276 | KLHL18 | P21T-E | Human | Esophagus | ESCC | 1.06e-09 | 6.37e-02 | 0.1617 |
| 23276 | KLHL18 | P22T-E | Human | Esophagus | ESCC | 5.62e-12 | 6.54e-02 | 0.1236 |
| 23276 | KLHL18 | P23T-E | Human | Esophagus | ESCC | 1.49e-03 | 9.58e-02 | 0.108 |
| 23276 | KLHL18 | P24T-E | Human | Esophagus | ESCC | 3.16e-09 | 1.67e-01 | 0.1287 |
| 23276 | KLHL18 | P26T-E | Human | Esophagus | ESCC | 1.08e-13 | 1.86e-01 | 0.1276 |
| Page: 1 2 3 4 |
| Tissue | Expression Dynamics | Abbreviation |
| Esophagus | 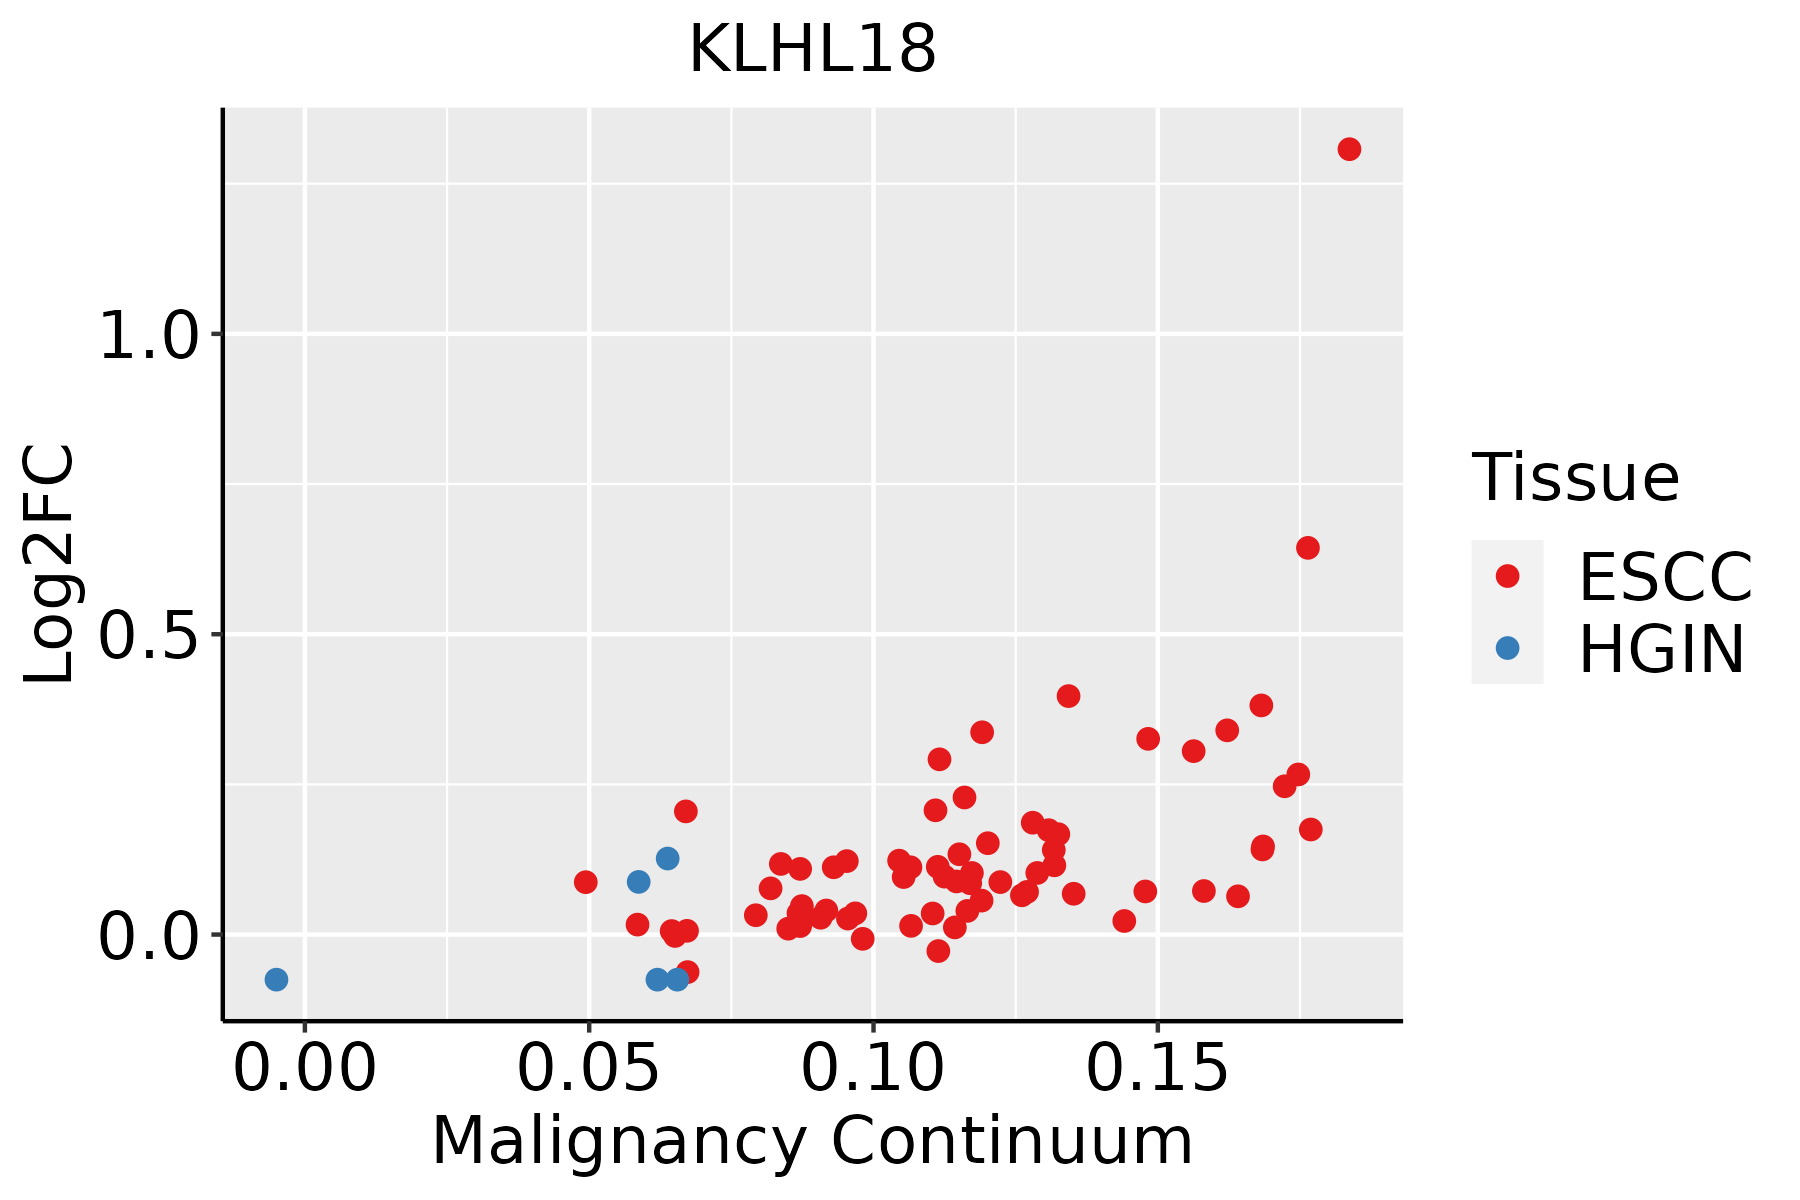 | ESCC: Esophageal squamous cell carcinoma |
| HGIN: High-grade intraepithelial neoplasias | ||
| LGIN: Low-grade intraepithelial neoplasias | ||
| Liver |  | HCC: Hepatocellular carcinoma |
| NAFLD: Non-alcoholic fatty liver disease |
| ∗log2FC in expression of this searched gene in stem-like cells from each diseased tissue sample relative to stem-like cells in normal samples in each tissue plotted against the malignancy continuum. Samples are colored based on if they are from different disease stage. |
Top |
Malignant transformation related pathway analysis |
| Find out the enriched GO biological processes and KEGG pathways involved in transition from healthy to precancer to cancer |
| Tissue | Disease Stage | Enriched GO biological Processes |
| Colorectum | AD |  |
| Colorectum | SER |  |
| Colorectum | MSS |  |
| Colorectum | MSI-H |  |
| Colorectum | FAP |  |
| ∗Top 15 enriched GO BP terms are showed in the bar plot of each disease state in each tissue. Each row represents a significant GO biological process which is colored according to the -log10(p.adjust). |
| Page: 1 2 3 4 5 6 7 8 9 |
| GO ID | Tissue | Disease Stage | Description | Gene Ratio | Bg Ratio | pvalue | p.adjust | Count |
| GO:004477216 | Esophagus | ESCC | mitotic cell cycle phase transition | 281/8552 | 424/18723 | 4.63e-18 | 4.45e-16 | 281 |
| GO:000734615 | Esophagus | ESCC | regulation of mitotic cell cycle | 293/8552 | 457/18723 | 8.00e-16 | 5.64e-14 | 293 |
| GO:190198713 | Esophagus | ESCC | regulation of cell cycle phase transition | 242/8552 | 390/18723 | 3.86e-11 | 1.26e-09 | 242 |
| GO:190199013 | Esophagus | ESCC | regulation of mitotic cell cycle phase transition | 191/8552 | 299/18723 | 1.35e-10 | 3.94e-09 | 191 |
| GO:004578710 | Esophagus | ESCC | positive regulation of cell cycle | 196/8552 | 313/18723 | 9.27e-10 | 2.24e-08 | 196 |
| GO:004593116 | Esophagus | ESCC | positive regulation of mitotic cell cycle | 83/8552 | 121/18723 | 2.78e-07 | 4.08e-06 | 83 |
| GO:19019896 | Esophagus | ESCC | positive regulation of cell cycle phase transition | 77/8552 | 115/18723 | 3.20e-06 | 3.58e-05 | 77 |
| GO:00900689 | Esophagus | ESCC | positive regulation of cell cycle process | 142/8552 | 236/18723 | 4.79e-06 | 5.08e-05 | 142 |
| GO:19019925 | Esophagus | ESCC | positive regulation of mitotic cell cycle phase transition | 62/8552 | 93/18723 | 3.47e-05 | 2.83e-04 | 62 |
| GO:00447722 | Liver | HCC | mitotic cell cycle phase transition | 240/7958 | 424/18723 | 2.47e-09 | 6.84e-08 | 240 |
| GO:000734611 | Liver | HCC | regulation of mitotic cell cycle | 255/7958 | 457/18723 | 4.96e-09 | 1.30e-07 | 255 |
| GO:19019901 | Liver | HCC | regulation of mitotic cell cycle phase transition | 167/7958 | 299/18723 | 1.96e-06 | 2.71e-05 | 167 |
| GO:19019871 | Liver | HCC | regulation of cell cycle phase transition | 211/7958 | 390/18723 | 2.11e-06 | 2.89e-05 | 211 |
| GO:004578711 | Liver | HCC | positive regulation of cell cycle | 172/7958 | 313/18723 | 5.29e-06 | 6.58e-05 | 172 |
| GO:00900683 | Liver | HCC | positive regulation of cell cycle process | 125/7958 | 236/18723 | 7.21e-04 | 4.40e-03 | 125 |
| GO:004593111 | Liver | HCC | positive regulation of mitotic cell cycle | 69/7958 | 121/18723 | 8.79e-04 | 5.20e-03 | 69 |
| GO:1901989 | Liver | HCC | positive regulation of cell cycle phase transition | 63/7958 | 115/18723 | 5.21e-03 | 2.18e-02 | 63 |
| GO:19019921 | Liver | HCC | positive regulation of mitotic cell cycle phase transition | 51/7958 | 93/18723 | 1.09e-02 | 4.04e-02 | 51 |
| Page: 1 |
| Pathway ID | Tissue | Disease Stage | Description | Gene Ratio | Bg Ratio | pvalue | p.adjust | qvalue | Count |
| Page: 1 |
Top |
Cell-cell communication analysis |
| Identification of potential cell-cell interactions between two cell types and their ligand-receptor pairs for different disease states |
| Ligand | Receptor | LRpair | Pathway | Tissue | Disease Stage |
| Page: 1 |
Top |
Single-cell gene regulatory network inference analysis |
| Find out the significant the regulons (TFs) and the target genes of each regulon across cell types for different disease states |
| TF | Cell Type | Tissue | Disease Stage | Target Gene | RSS | Regulon Activity |
| ∗The dot plots of a searched regulon are shown for all cell subpopulations in each disease state of each tissue based on the regulon specific score inferred using pySCENIC and by calculating the average expression. |
| Page: 1 |
Top |
Somatic mutation of malignant transformation related genes |
| Annotation of somatic variants for genes involved in malignant transformation |
| Hugo Symbol | Variant Class | Variant Classification | dbSNP RS | HGVSc | HGVSp | HGVSp Short | SWISSPROT | BIOTYPE | SIFT | PolyPhen | Tumor Sample Barcode | Tissue | Histology | Sex | Age | Stage | Therapy Types | Drugs | Outcome |
| KLHL18 | SNV | Missense_Mutation | novel | c.815N>C | p.His272Pro | p.H272P | O94889 | protein_coding | tolerated(0.2) | benign(0.268) | TCGA-A8-A0A6-01 | Breast | breast invasive carcinoma | Female | <65 | III/IV | Chemotherapy | epirubicin | CR |
| KLHL18 | SNV | Missense_Mutation | c.1153N>T | p.Ile385Phe | p.I385F | O94889 | protein_coding | deleterious(0) | possibly_damaging(0.908) | TCGA-BH-A0B4-01 | Breast | breast invasive carcinoma | Male | >=65 | III/IV | Hormone Therapy | tamoxiphen | SD | |
| KLHL18 | SNV | Missense_Mutation | rs759741447 | c.1417G>A | p.Ala473Thr | p.A473T | O94889 | protein_coding | tolerated(0.1) | possibly_damaging(0.669) | TCGA-E2-A1LL-01 | Breast | breast invasive carcinoma | Female | >=65 | III/IV | Chemotherapy | docetaxel | PD |
| KLHL18 | insertion | Frame_Shift_Ins | novel | c.587_588insGTCTCGGCTCACTGCAAGCTCCGCCTCCTGGGTTCACAGC | p.Glu198ArgfsTer14 | p.E198Rfs*14 | O94889 | protein_coding | TCGA-A8-A095-01 | Breast | breast invasive carcinoma | Female | <65 | I/II | Chemotherapy | 5-fluorouracil | CR | ||
| KLHL18 | insertion | Frame_Shift_Ins | novel | c.589_590insTCTC | p.Ser197PhefsTer3 | p.S197Ffs*3 | O94889 | protein_coding | TCGA-A8-A095-01 | Breast | breast invasive carcinoma | Female | <65 | I/II | Chemotherapy | 5-fluorouracil | CR | ||
| KLHL18 | insertion | Nonsense_Mutation | novel | c.1016_1017insGCTGTGCTCTAAACAAGTGGTCTCATTTGTTTTAAT | p.Tyr339delinsTer | p.Y339delins* | O94889 | protein_coding | TCGA-AQ-A04J-01 | Breast | breast invasive carcinoma | Female | <65 | I/II | Chemotherapy | cytoxan | SD | ||
| KLHL18 | SNV | Missense_Mutation | rs748872849 | c.1244N>T | p.Ser415Leu | p.S415L | O94889 | protein_coding | deleterious(0.01) | benign(0.347) | TCGA-LP-A5U2-01 | Cervix | cervical & endocervical cancer | Female | <65 | III/IV | Unknown | Unknown | SD |
| KLHL18 | insertion | In_Frame_Ins | novel | c.100_101insGCCGGA | p.Gln34delinsArgArgLys | p.Q34delinsRRK | O94889 | protein_coding | TCGA-DS-A1OB-01 | Cervix | cervical & endocervical cancer | Female | <65 | I/II | Chemotherapy | carboplatin | PD | ||
| KLHL18 | SNV | Missense_Mutation | novel | c.290N>G | p.Tyr97Cys | p.Y97C | O94889 | protein_coding | deleterious(0) | probably_damaging(1) | TCGA-A6-2672-01 | Colorectum | colon adenocarcinoma | Female | >=65 | III/IV | Unknown | Unknown | SD |
| KLHL18 | SNV | Missense_Mutation | rs777261722 | c.842N>A | p.Arg281His | p.R281H | O94889 | protein_coding | deleterious(0) | probably_damaging(1) | TCGA-AA-3492-01 | Colorectum | colon adenocarcinoma | Female | >=65 | I/II | Unknown | Unknown | SD |
| Page: 1 2 3 4 5 6 |
Top |
Related drugs of malignant transformation related genes |
| Identification of chemicals and drugs interact with genes involved in malignant transfromation |
| (DGIdb 4.0) |
| Entrez ID | Symbol | Category | Interaction Types | Drug Claim Name | Drug Name | PMIDs |
| Page: 1 |

Copyright 2023-Present -The University of Texas Health Science Center at Houston |