
|
|||||
|
 | |
| |
| |
| |
| |
| |
|
Gene: KLHL12 |
Gene summary for KLHL12 |
| Gene information | Species | Human | Gene symbol | KLHL12 | Gene ID | 59349 |
| Gene name | kelch like family member 12 | |
| Gene Alias | C3IP1 | |
| Cytomap | 1q32.1 | |
| Gene Type | protein-coding | GO ID | GO:0001837 | UniProtAcc | Q53G59 |
Top |
Malignant transformation analysis |
| Identification of the aberrant gene expression in precancerous and cancerous lesions by comparing the gene expression of stem-like cells in diseased tissues with normal stem cells |
| Entrez ID | Symbol | Replicates | Species | Organ | Tissue | Adj P-value | Log2FC | Malignancy |
| 59349 | KLHL12 | LZE2T | Human | Esophagus | ESCC | 1.37e-02 | 5.38e-01 | 0.082 |
| 59349 | KLHL12 | LZE4T | Human | Esophagus | ESCC | 4.25e-07 | 2.18e-01 | 0.0811 |
| 59349 | KLHL12 | LZE7T | Human | Esophagus | ESCC | 1.82e-07 | 3.27e-01 | 0.0667 |
| 59349 | KLHL12 | LZE22T | Human | Esophagus | ESCC | 6.28e-05 | 3.12e-01 | 0.068 |
| 59349 | KLHL12 | LZE24T | Human | Esophagus | ESCC | 8.67e-15 | 3.73e-01 | 0.0596 |
| 59349 | KLHL12 | LZE21T | Human | Esophagus | ESCC | 7.69e-07 | 3.20e-01 | 0.0655 |
| 59349 | KLHL12 | P1T-E | Human | Esophagus | ESCC | 8.75e-05 | 2.35e-01 | 0.0875 |
| 59349 | KLHL12 | P2T-E | Human | Esophagus | ESCC | 7.07e-16 | 3.54e-01 | 0.1177 |
| 59349 | KLHL12 | P4T-E | Human | Esophagus | ESCC | 3.76e-08 | 2.55e-01 | 0.1323 |
| 59349 | KLHL12 | P5T-E | Human | Esophagus | ESCC | 1.27e-08 | 2.13e-01 | 0.1327 |
| 59349 | KLHL12 | P8T-E | Human | Esophagus | ESCC | 2.01e-09 | 1.51e-01 | 0.0889 |
| 59349 | KLHL12 | P9T-E | Human | Esophagus | ESCC | 4.82e-04 | 1.18e-01 | 0.1131 |
| 59349 | KLHL12 | P10T-E | Human | Esophagus | ESCC | 1.96e-13 | 2.49e-01 | 0.116 |
| 59349 | KLHL12 | P11T-E | Human | Esophagus | ESCC | 5.08e-07 | 2.84e-01 | 0.1426 |
| 59349 | KLHL12 | P12T-E | Human | Esophagus | ESCC | 7.80e-19 | 2.39e-01 | 0.1122 |
| 59349 | KLHL12 | P15T-E | Human | Esophagus | ESCC | 1.35e-22 | 4.24e-01 | 0.1149 |
| 59349 | KLHL12 | P16T-E | Human | Esophagus | ESCC | 8.40e-17 | 3.16e-01 | 0.1153 |
| 59349 | KLHL12 | P17T-E | Human | Esophagus | ESCC | 7.04e-07 | 2.30e-01 | 0.1278 |
| 59349 | KLHL12 | P19T-E | Human | Esophagus | ESCC | 3.04e-03 | 3.21e-01 | 0.1662 |
| 59349 | KLHL12 | P20T-E | Human | Esophagus | ESCC | 7.49e-03 | 1.22e-01 | 0.1124 |
| Page: 1 2 3 4 5 |
| Tissue | Expression Dynamics | Abbreviation |
| Esophagus |  | ESCC: Esophageal squamous cell carcinoma |
| HGIN: High-grade intraepithelial neoplasias | ||
| LGIN: Low-grade intraepithelial neoplasias | ||
| Liver |  | HCC: Hepatocellular carcinoma |
| NAFLD: Non-alcoholic fatty liver disease | ||
| Oral Cavity | 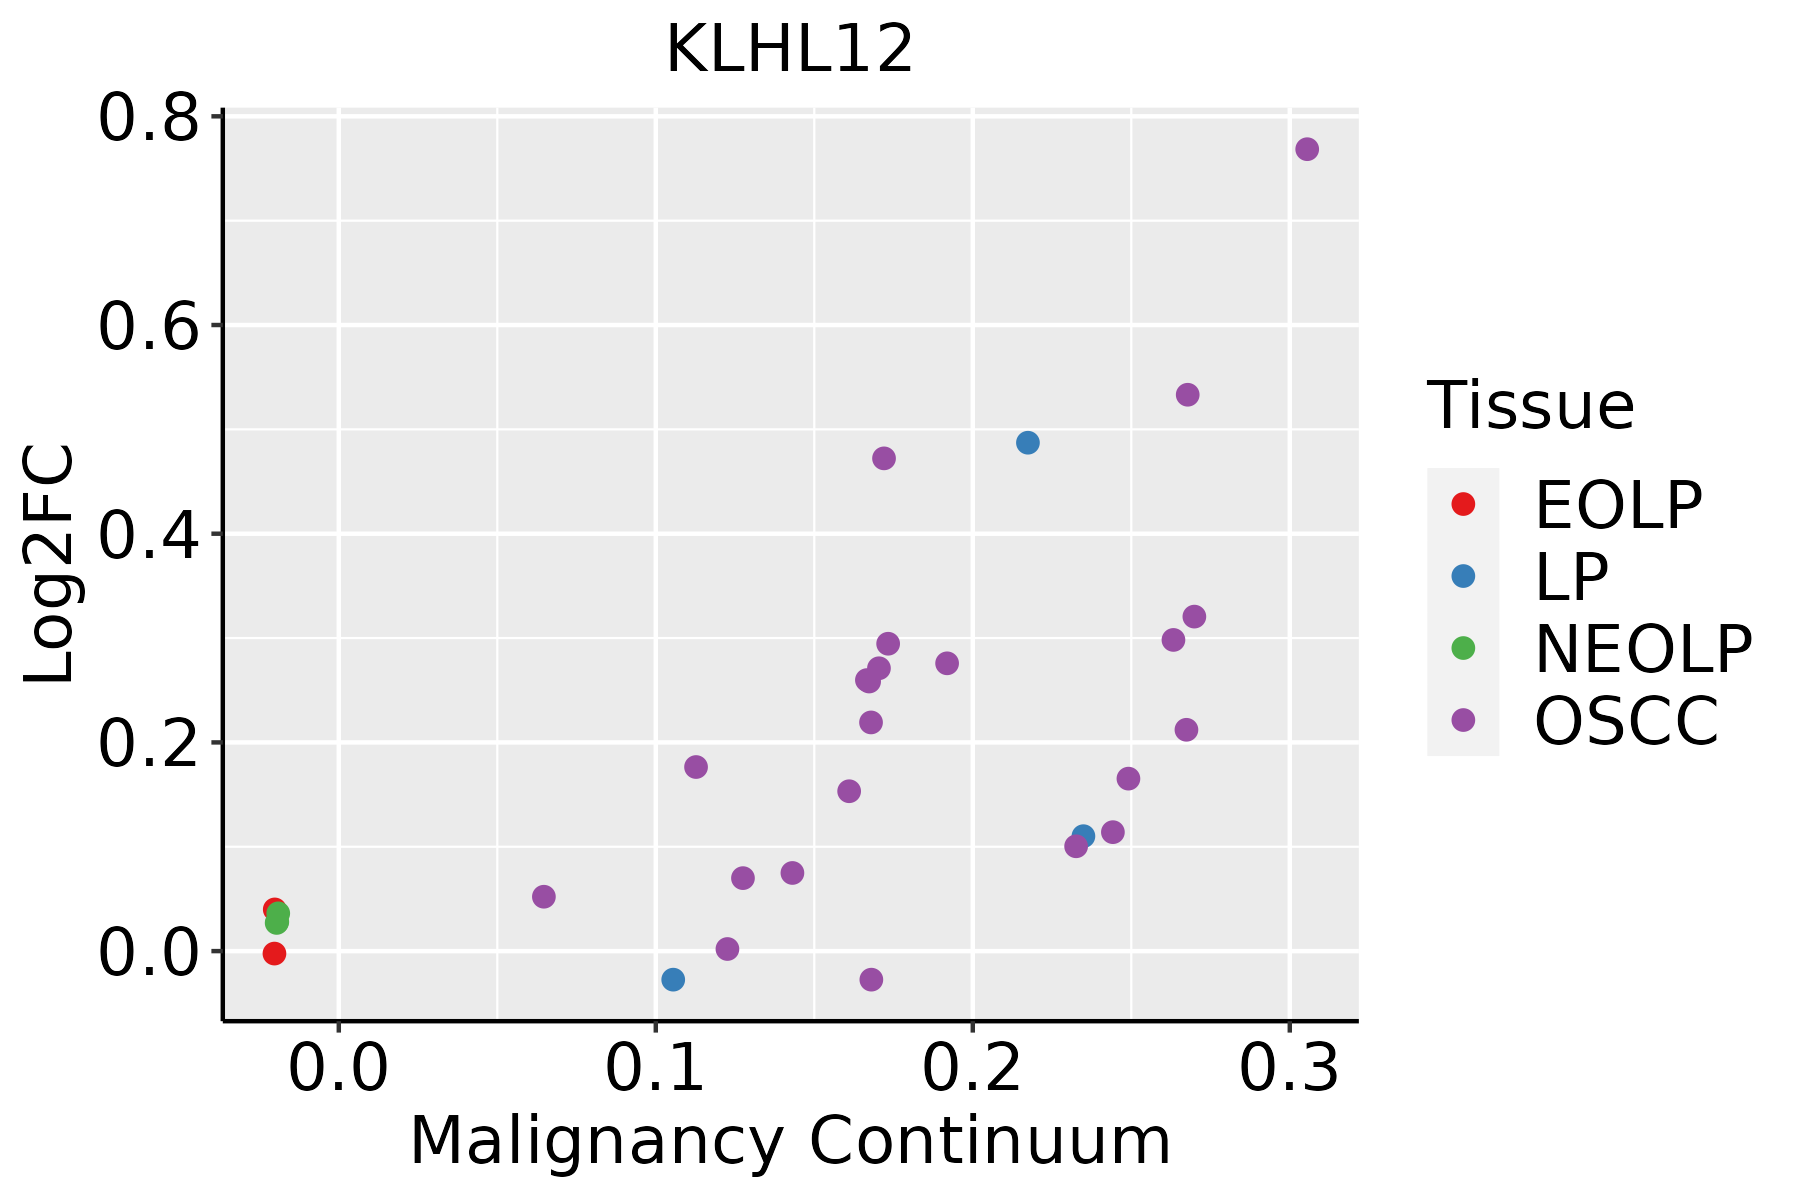 | EOLP: Erosive Oral lichen planus |
| LP: leukoplakia | ||
| NEOLP: Non-erosive oral lichen planus | ||
| OSCC: Oral squamous cell carcinoma |
| ∗log2FC in expression of this searched gene in stem-like cells from each diseased tissue sample relative to stem-like cells in normal samples in each tissue plotted against the malignancy continuum. Samples are colored based on if they are from different disease stage. |
Top |
Malignant transformation related pathway analysis |
| Find out the enriched GO biological processes and KEGG pathways involved in transition from healthy to precancer to cancer |
| Tissue | Disease Stage | Enriched GO biological Processes |
| Colorectum | AD |  |
| Colorectum | SER |  |
| Colorectum | MSS |  |
| Colorectum | MSI-H |  |
| Colorectum | FAP |  |
| ∗Top 15 enriched GO BP terms are showed in the bar plot of each disease state in each tissue. Each row represents a significant GO biological process which is colored according to the -log10(p.adjust). |
| Page: 1 2 3 4 5 6 7 8 9 |
| GO ID | Tissue | Disease Stage | Description | Gene Ratio | Bg Ratio | pvalue | p.adjust | Count |
| GO:004819318 | Esophagus | ESCC | Golgi vesicle transport | 231/8552 | 296/18723 | 1.82e-30 | 9.63e-28 | 231 |
| GO:005165617 | Esophagus | ESCC | establishment of organelle localization | 273/8552 | 390/18723 | 9.13e-23 | 1.81e-20 | 273 |
| GO:001605014 | Esophagus | ESCC | vesicle organization | 211/8552 | 300/18723 | 2.85e-18 | 2.87e-16 | 211 |
| GO:000688815 | Esophagus | ESCC | endoplasmic reticulum to Golgi vesicle-mediated transport | 102/8552 | 130/18723 | 1.73e-14 | 9.22e-13 | 102 |
| GO:0006900111 | Esophagus | ESCC | vesicle budding from membrane | 54/8552 | 61/18723 | 2.66e-12 | 1.07e-10 | 54 |
| GO:005165016 | Esophagus | ESCC | establishment of vesicle localization | 114/8552 | 161/18723 | 8.20e-11 | 2.53e-09 | 114 |
| GO:001605517 | Esophagus | ESCC | Wnt signaling pathway | 268/8552 | 444/18723 | 2.32e-10 | 6.58e-09 | 268 |
| GO:019873817 | Esophagus | ESCC | cell-cell signaling by wnt | 269/8552 | 446/18723 | 2.41e-10 | 6.79e-09 | 269 |
| GO:005164815 | Esophagus | ESCC | vesicle localization | 119/8552 | 177/18723 | 5.16e-09 | 1.08e-07 | 119 |
| GO:00065136 | Esophagus | ESCC | protein monoubiquitination | 53/8552 | 67/18723 | 2.11e-08 | 4.03e-07 | 53 |
| GO:009011414 | Esophagus | ESCC | COPII-coated vesicle budding | 27/8552 | 29/18723 | 8.09e-08 | 1.39e-06 | 27 |
| GO:00069038 | Esophagus | ESCC | vesicle targeting | 38/8552 | 45/18723 | 8.42e-08 | 1.43e-06 | 38 |
| GO:004819914 | Esophagus | ESCC | vesicle targeting, to, from or within Golgi | 19/8552 | 21/18723 | 2.28e-05 | 1.96e-04 | 19 |
| GO:000690115 | Esophagus | ESCC | vesicle coating | 16/8552 | 17/18723 | 3.46e-05 | 2.82e-04 | 16 |
| GO:00488638 | Esophagus | ESCC | stem cell differentiation | 122/8552 | 206/18723 | 5.95e-05 | 4.59e-04 | 122 |
| GO:00018378 | Esophagus | ESCC | epithelial to mesenchymal transition | 95/8552 | 157/18723 | 1.25e-04 | 8.56e-04 | 95 |
| GO:00487628 | Esophagus | ESCC | mesenchymal cell differentiation | 133/8552 | 236/18723 | 5.94e-04 | 3.22e-03 | 133 |
| GO:004820714 | Esophagus | ESCC | vesicle targeting, rough ER to cis-Golgi | 12/8552 | 13/18723 | 6.18e-04 | 3.32e-03 | 12 |
| GO:004820814 | Esophagus | ESCC | COPII vesicle coating | 12/8552 | 13/18723 | 6.18e-04 | 3.32e-03 | 12 |
| GO:00604856 | Esophagus | ESCC | mesenchyme development | 156/8552 | 291/18723 | 3.76e-03 | 1.53e-02 | 156 |
| Page: 1 2 3 4 |
| Pathway ID | Tissue | Disease Stage | Description | Gene Ratio | Bg Ratio | pvalue | p.adjust | qvalue | Count |
| Page: 1 |
Top |
Cell-cell communication analysis |
| Identification of potential cell-cell interactions between two cell types and their ligand-receptor pairs for different disease states |
| Ligand | Receptor | LRpair | Pathway | Tissue | Disease Stage |
| Page: 1 |
Top |
Single-cell gene regulatory network inference analysis |
| Find out the significant the regulons (TFs) and the target genes of each regulon across cell types for different disease states |
| TF | Cell Type | Tissue | Disease Stage | Target Gene | RSS | Regulon Activity |
| ∗The dot plots of a searched regulon are shown for all cell subpopulations in each disease state of each tissue based on the regulon specific score inferred using pySCENIC and by calculating the average expression. |
| Page: 1 |
Top |
Somatic mutation of malignant transformation related genes |
| Annotation of somatic variants for genes involved in malignant transformation |
| Hugo Symbol | Variant Class | Variant Classification | dbSNP RS | HGVSc | HGVSp | HGVSp Short | SWISSPROT | BIOTYPE | SIFT | PolyPhen | Tumor Sample Barcode | Tissue | Histology | Sex | Age | Stage | Therapy Types | Drugs | Outcome |
| KLHL12 | SNV | Missense_Mutation | c.1533C>G | p.Cys511Trp | p.C511W | Q53G59 | protein_coding | deleterious(0.01) | probably_damaging(1) | TCGA-A8-A09N-01 | Breast | breast invasive carcinoma | Female | <65 | III/IV | Unknown | Unknown | SD | |
| KLHL12 | SNV | Missense_Mutation | c.793C>T | p.Arg265Trp | p.R265W | Q53G59 | protein_coding | deleterious(0) | probably_damaging(0.973) | TCGA-AN-A046-01 | Breast | breast invasive carcinoma | Female | >=65 | I/II | Unknown | Unknown | SD | |
| KLHL12 | SNV | Missense_Mutation | c.1412T>C | p.Leu471Pro | p.L471P | Q53G59 | protein_coding | deleterious(0.02) | probably_damaging(0.998) | TCGA-EW-A1P8-01 | Breast | breast invasive carcinoma | Female | <65 | III/IV | Chemotherapy | fluorouracil | PD | |
| KLHL12 | deletion | Frame_Shift_Del | novel | c.1378delG | p.Ala460ProfsTer9 | p.A460Pfs*9 | Q53G59 | protein_coding | TCGA-D8-A27V-01 | Breast | breast invasive carcinoma | Female | <65 | I/II | Hormone Therapy | tamoxiphen | SD | ||
| KLHL12 | SNV | Missense_Mutation | rs754879214 | c.977C>T | p.Ser326Phe | p.S326F | Q53G59 | protein_coding | deleterious(0.02) | benign(0.025) | TCGA-2W-A8YY-01 | Cervix | cervical & endocervical cancer | Female | <65 | I/II | Chemotherapy | cisplatin | CR |
| KLHL12 | SNV | Missense_Mutation | c.596C>A | p.Ala199Asp | p.A199D | Q53G59 | protein_coding | deleterious(0.03) | probably_damaging(0.997) | TCGA-2W-A8YY-01 | Cervix | cervical & endocervical cancer | Female | <65 | I/II | Chemotherapy | cisplatin | CR | |
| KLHL12 | SNV | Missense_Mutation | novel | c.580G>C | p.Glu194Gln | p.E194Q | Q53G59 | protein_coding | deleterious(0) | probably_damaging(0.988) | TCGA-EA-A3HU-01 | Cervix | cervical & endocervical cancer | Female | <65 | I/II | Unknown | Unknown | SD |
| KLHL12 | SNV | Missense_Mutation | c.949C>T | p.Arg317Cys | p.R317C | Q53G59 | protein_coding | deleterious(0) | benign(0.399) | TCGA-VS-A953-01 | Cervix | cervical & endocervical cancer | Female | <65 | I/II | Unknown | Unknown | PD | |
| KLHL12 | SNV | Missense_Mutation | novel | c.166G>C | p.Asp56His | p.D56H | Q53G59 | protein_coding | tolerated(0.05) | probably_damaging(0.998) | TCGA-VS-AA62-01 | Cervix | cervical & endocervical cancer | Female | <65 | I/II | Chemotherapy | cisplatin | PD |
| KLHL12 | SNV | Missense_Mutation | novel | c.958N>T | p.Arg320Cys | p.R320C | Q53G59 | protein_coding | tolerated(0.05) | probably_damaging(0.999) | TCGA-5M-AAT6-01 | Colorectum | colon adenocarcinoma | Female | <65 | III/IV | Unknown | Unknown | PD |
| Page: 1 2 3 4 5 6 7 |
Top |
Related drugs of malignant transformation related genes |
| Identification of chemicals and drugs interact with genes involved in malignant transfromation |
| (DGIdb 4.0) |
| Entrez ID | Symbol | Category | Interaction Types | Drug Claim Name | Drug Name | PMIDs |
| Page: 1 |

Copyright 2023-Present -The University of Texas Health Science Center at Houston |