
|
|||||
|
 | |
| |
| |
| |
| |
| |
|
Gene: KLHL11 |
Gene summary for KLHL11 |
| Gene information | Species | Human | Gene symbol | KLHL11 | Gene ID | 55175 |
| Gene name | kelch like family member 11 | |
| Gene Alias | KLHL11 | |
| Cytomap | 17q21.2 | |
| Gene Type | protein-coding | GO ID | GO:0005575 | UniProtAcc | A0A024R1T8 |
Top |
Malignant transformation analysis |
| Identification of the aberrant gene expression in precancerous and cancerous lesions by comparing the gene expression of stem-like cells in diseased tissues with normal stem cells |
| Entrez ID | Symbol | Replicates | Species | Organ | Tissue | Adj P-value | Log2FC | Malignancy |
| 55175 | KLHL11 | LZE4T | Human | Esophagus | ESCC | 7.96e-15 | 3.63e-01 | 0.0811 |
| 55175 | KLHL11 | LZE7T | Human | Esophagus | ESCC | 3.01e-10 | 3.83e-01 | 0.0667 |
| 55175 | KLHL11 | LZE21D1 | Human | Esophagus | HGIN | 4.41e-04 | 2.97e-01 | 0.0632 |
| 55175 | KLHL11 | LZE22T | Human | Esophagus | ESCC | 1.57e-02 | 3.63e-01 | 0.068 |
| 55175 | KLHL11 | LZE24T | Human | Esophagus | ESCC | 7.41e-13 | 2.98e-01 | 0.0596 |
| 55175 | KLHL11 | LZE22D3 | Human | Esophagus | HGIN | 1.73e-02 | 3.63e-01 | 0.0653 |
| 55175 | KLHL11 | LZE21T | Human | Esophagus | ESCC | 6.52e-03 | 2.06e-01 | 0.0655 |
| 55175 | KLHL11 | P1T-E | Human | Esophagus | ESCC | 3.58e-07 | 3.13e-01 | 0.0875 |
| 55175 | KLHL11 | P2T-E | Human | Esophagus | ESCC | 4.30e-10 | 2.12e-01 | 0.1177 |
| 55175 | KLHL11 | P4T-E | Human | Esophagus | ESCC | 1.05e-03 | 1.29e-01 | 0.1323 |
| 55175 | KLHL11 | P5T-E | Human | Esophagus | ESCC | 4.17e-05 | 1.72e-01 | 0.1327 |
| 55175 | KLHL11 | P8T-E | Human | Esophagus | ESCC | 1.66e-02 | 8.31e-02 | 0.0889 |
| 55175 | KLHL11 | P11T-E | Human | Esophagus | ESCC | 1.13e-06 | 2.94e-01 | 0.1426 |
| 55175 | KLHL11 | P12T-E | Human | Esophagus | ESCC | 1.76e-12 | 2.65e-01 | 0.1122 |
| 55175 | KLHL11 | P15T-E | Human | Esophagus | ESCC | 4.46e-14 | 2.79e-01 | 0.1149 |
| 55175 | KLHL11 | P16T-E | Human | Esophagus | ESCC | 8.56e-12 | 2.43e-01 | 0.1153 |
| 55175 | KLHL11 | P20T-E | Human | Esophagus | ESCC | 1.16e-15 | 3.36e-01 | 0.1124 |
| 55175 | KLHL11 | P21T-E | Human | Esophagus | ESCC | 8.40e-04 | 1.29e-01 | 0.1617 |
| 55175 | KLHL11 | P22T-E | Human | Esophagus | ESCC | 3.52e-19 | 3.39e-01 | 0.1236 |
| 55175 | KLHL11 | P23T-E | Human | Esophagus | ESCC | 2.37e-12 | 2.90e-01 | 0.108 |
| Page: 1 2 3 |
| Tissue | Expression Dynamics | Abbreviation |
| Esophagus | 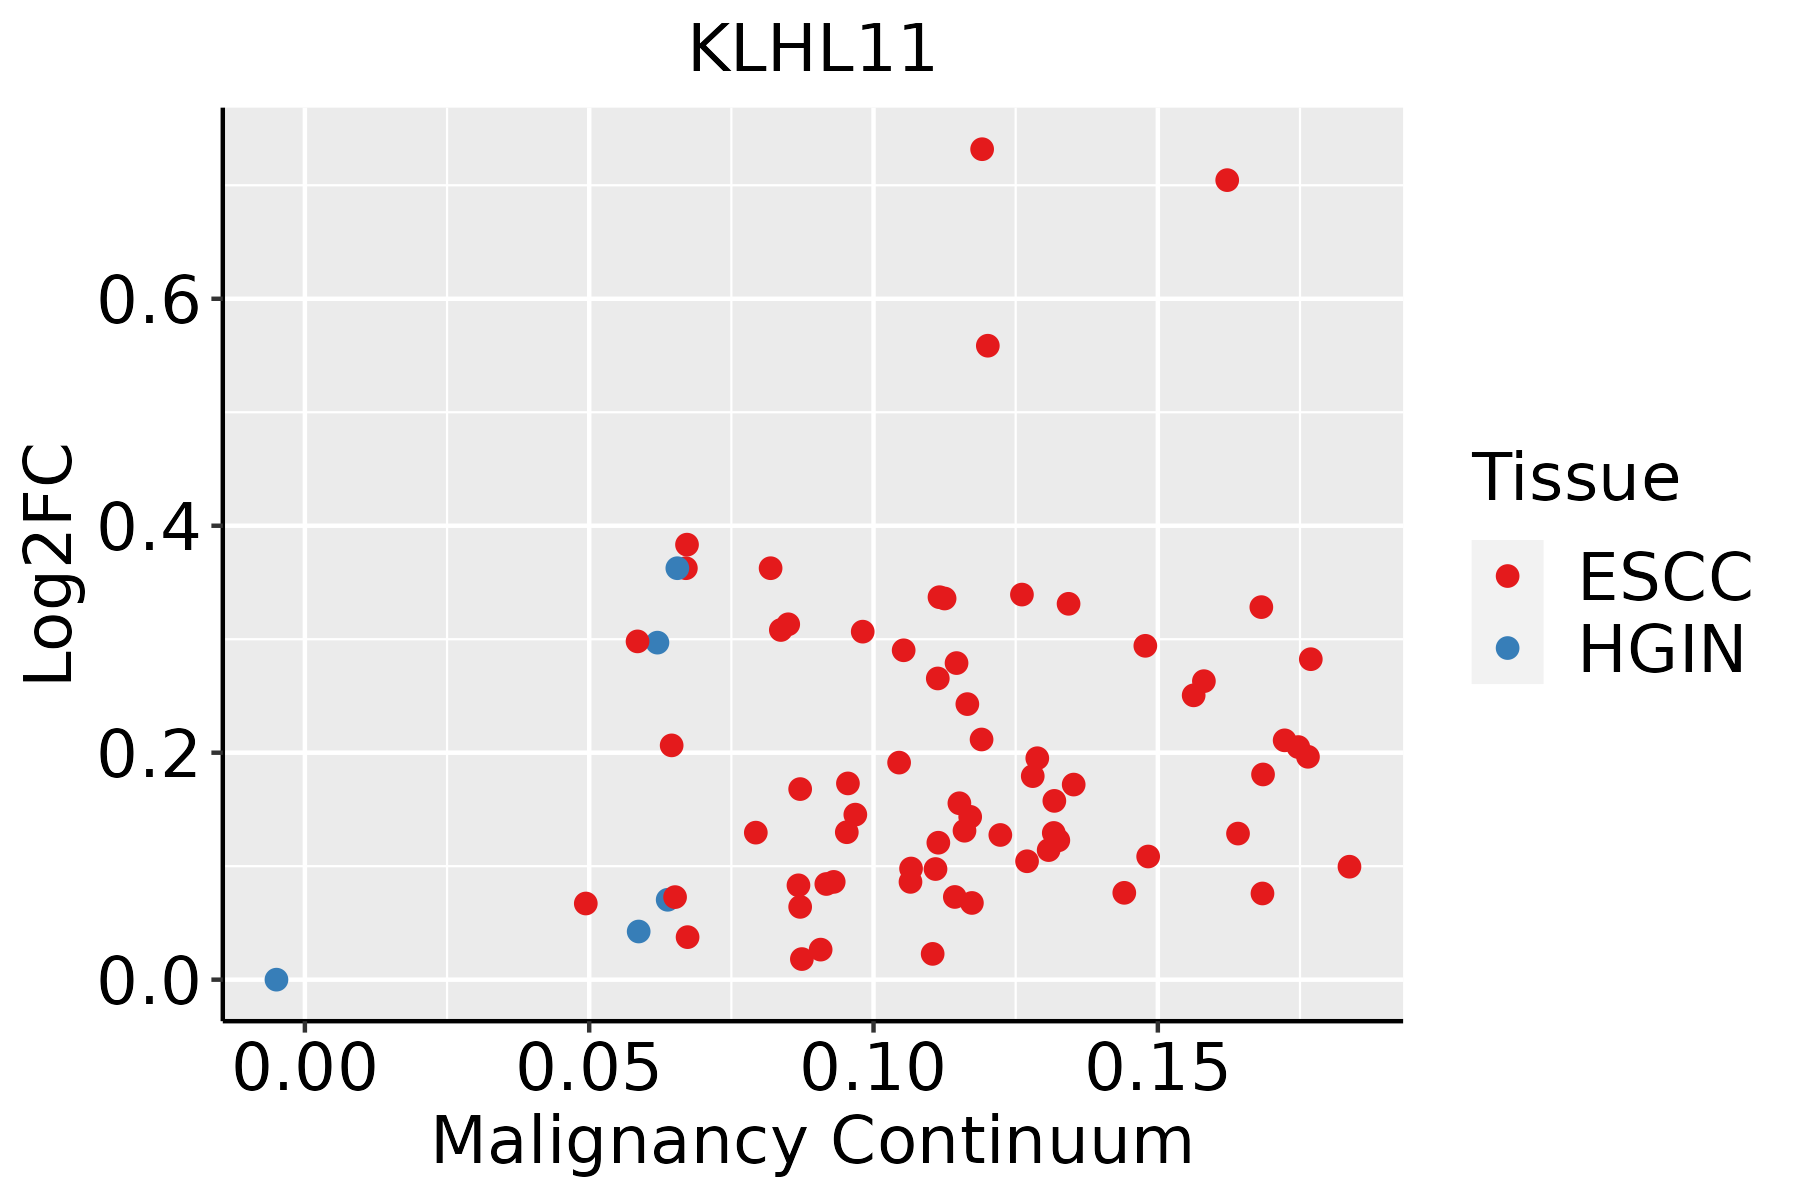 | ESCC: Esophageal squamous cell carcinoma |
| HGIN: High-grade intraepithelial neoplasias | ||
| LGIN: Low-grade intraepithelial neoplasias |
| ∗log2FC in expression of this searched gene in stem-like cells from each diseased tissue sample relative to stem-like cells in normal samples in each tissue plotted against the malignancy continuum. Samples are colored based on if they are from different disease stage. |
Top |
Malignant transformation related pathway analysis |
| Find out the enriched GO biological processes and KEGG pathways involved in transition from healthy to precancer to cancer |
| Tissue | Disease Stage | Enriched GO biological Processes |
| Colorectum | AD |  |
| Colorectum | SER |  |
| Colorectum | MSS |  |
| Colorectum | MSI-H |  |
| Colorectum | FAP |  |
| ∗Top 15 enriched GO BP terms are showed in the bar plot of each disease state in each tissue. Each row represents a significant GO biological process which is colored according to the -log10(p.adjust). |
| Page: 1 2 3 4 5 6 7 8 9 |
| GO ID | Tissue | Disease Stage | Description | Gene Ratio | Bg Ratio | pvalue | p.adjust | Count |
| Page: 1 |
| Pathway ID | Tissue | Disease Stage | Description | Gene Ratio | Bg Ratio | pvalue | p.adjust | qvalue | Count |
| Page: 1 |
Top |
Cell-cell communication analysis |
| Identification of potential cell-cell interactions between two cell types and their ligand-receptor pairs for different disease states |
| Ligand | Receptor | LRpair | Pathway | Tissue | Disease Stage |
| Page: 1 |
Top |
Single-cell gene regulatory network inference analysis |
| Find out the significant the regulons (TFs) and the target genes of each regulon across cell types for different disease states |
| TF | Cell Type | Tissue | Disease Stage | Target Gene | RSS | Regulon Activity |
| ∗The dot plots of a searched regulon are shown for all cell subpopulations in each disease state of each tissue based on the regulon specific score inferred using pySCENIC and by calculating the average expression. |
| Page: 1 |
Top |
Somatic mutation of malignant transformation related genes |
| Annotation of somatic variants for genes involved in malignant transformation |
| Hugo Symbol | Variant Class | Variant Classification | dbSNP RS | HGVSc | HGVSp | HGVSp Short | SWISSPROT | BIOTYPE | SIFT | PolyPhen | Tumor Sample Barcode | Tissue | Histology | Sex | Age | Stage | Therapy Types | Drugs | Outcome |
| KLHL11 | SNV | Missense_Mutation | c.1592N>A | p.Thr531Asn | p.T531N | Q9NVR0 | protein_coding | deleterious(0.04) | benign(0.243) | TCGA-BH-A0AY-01 | Breast | breast invasive carcinoma | Female | <65 | I/II | Chemotherapy | SD | ||
| KLHL11 | insertion | Nonsense_Mutation | novel | c.1774_1775insAGGTTCTCTCAAGCG | p.Leu592delinsTer | p.L592delins* | Q9NVR0 | protein_coding | TCGA-A7-A0CE-01 | Breast | breast invasive carcinoma | Female | <65 | I/II | Chemotherapy | adriamycin | SD | ||
| KLHL11 | deletion | Frame_Shift_Del | c.827_870delNNNNNNNNNNNNNNNNNNNNNNNNNNNNNNNNNNNNNNNNNNNN | p.Arg276IlefsTer25 | p.R276Ifs*25 | Q9NVR0 | protein_coding | TCGA-AR-A0TS-01 | Breast | breast invasive carcinoma | Female | <65 | I/II | Chemotherapy | doxorubicin | SD | |||
| KLHL11 | SNV | Missense_Mutation | novel | c.523N>A | p.Glu175Lys | p.E175K | Q9NVR0 | protein_coding | deleterious(0.03) | benign(0.175) | TCGA-C5-A8YQ-01 | Cervix | cervical & endocervical cancer | Female | >=65 | I/II | Chemotherapy | cisplatin | PD |
| KLHL11 | SNV | Missense_Mutation | c.2094G>A | p.Met698Ile | p.M698I | Q9NVR0 | protein_coding | deleterious_low_confidence(0.04) | benign(0) | TCGA-EK-A3GK-01 | Cervix | cervical & endocervical cancer | Female | <65 | I/II | Unknown | Unknown | SD | |
| KLHL11 | SNV | Missense_Mutation | c.1844G>C | p.Gly615Ala | p.G615A | Q9NVR0 | protein_coding | deleterious(0.04) | probably_damaging(1) | TCGA-IR-A3LK-01 | Cervix | cervical & endocervical cancer | Female | >=65 | I/II | Chemotherapy | cisplatin | PD | |
| KLHL11 | SNV | Missense_Mutation | novel | c.1126N>A | p.Glu376Lys | p.E376K | Q9NVR0 | protein_coding | tolerated(0.06) | benign(0.099) | TCGA-MY-A913-01 | Cervix | cervical & endocervical cancer | Female | <65 | I/II | Chemotherapy | cisplatin | CR |
| KLHL11 | SNV | Missense_Mutation | novel | c.1483N>G | p.Lys495Glu | p.K495E | Q9NVR0 | protein_coding | tolerated(0.13) | benign(0.028) | TCGA-VS-A9UJ-01 | Cervix | cervical & endocervical cancer | Female | <65 | I/II | Unknown | Unknown | PD |
| KLHL11 | SNV | Missense_Mutation | novel | c.307N>A | p.Ala103Thr | p.A103T | Q9NVR0 | protein_coding | tolerated(0.22) | benign(0.239) | TCGA-VS-A9V4-01 | Cervix | cervical & endocervical cancer | Female | <65 | I/II | Chemotherapy | cisplatin | PD |
| KLHL11 | SNV | Missense_Mutation | c.1358N>T | p.Gly453Val | p.G453V | Q9NVR0 | protein_coding | deleterious(0) | probably_damaging(0.989) | TCGA-AA-3492-01 | Colorectum | colon adenocarcinoma | Female | >=65 | I/II | Unknown | Unknown | SD |
| Page: 1 2 3 4 5 6 |
Top |
Related drugs of malignant transformation related genes |
| Identification of chemicals and drugs interact with genes involved in malignant transfromation |
| (DGIdb 4.0) |
| Entrez ID | Symbol | Category | Interaction Types | Drug Claim Name | Drug Name | PMIDs |
| Page: 1 |

Copyright 2023-Present -The University of Texas Health Science Center at Houston |