
|
|||||
|
 | |
| |
| |
| |
| |
| |
|
Gene: KLHDC8B |
Gene summary for KLHDC8B |
| Gene information | Species | Human | Gene symbol | KLHDC8B | Gene ID | 200942 |
| Gene name | kelch domain containing 8B | |
| Gene Alias | CHL | |
| Cytomap | 3p21.31 | |
| Gene Type | protein-coding | GO ID | GO:0000278 | UniProtAcc | A0A024R2X4 |
Top |
Malignant transformation analysis |
| Identification of the aberrant gene expression in precancerous and cancerous lesions by comparing the gene expression of stem-like cells in diseased tissues with normal stem cells |
| Entrez ID | Symbol | Replicates | Species | Organ | Tissue | Adj P-value | Log2FC | Malignancy |
| 200942 | KLHDC8B | LZE4T | Human | Esophagus | ESCC | 2.02e-04 | 1.87e-01 | 0.0811 |
| 200942 | KLHDC8B | LZE24T | Human | Esophagus | ESCC | 3.04e-12 | 3.17e-01 | 0.0596 |
| 200942 | KLHDC8B | P2T-E | Human | Esophagus | ESCC | 1.19e-04 | 6.31e-02 | 0.1177 |
| 200942 | KLHDC8B | P4T-E | Human | Esophagus | ESCC | 1.01e-08 | 2.29e-01 | 0.1323 |
| 200942 | KLHDC8B | P5T-E | Human | Esophagus | ESCC | 1.46e-09 | 2.03e-01 | 0.1327 |
| 200942 | KLHDC8B | P8T-E | Human | Esophagus | ESCC | 5.61e-03 | 5.78e-02 | 0.0889 |
| 200942 | KLHDC8B | P9T-E | Human | Esophagus | ESCC | 2.91e-05 | 1.70e-01 | 0.1131 |
| 200942 | KLHDC8B | P10T-E | Human | Esophagus | ESCC | 1.02e-06 | 4.48e-02 | 0.116 |
| 200942 | KLHDC8B | P11T-E | Human | Esophagus | ESCC | 8.61e-09 | 4.15e-01 | 0.1426 |
| 200942 | KLHDC8B | P12T-E | Human | Esophagus | ESCC | 1.16e-17 | 1.92e-01 | 0.1122 |
| 200942 | KLHDC8B | P15T-E | Human | Esophagus | ESCC | 8.19e-04 | 1.21e-01 | 0.1149 |
| 200942 | KLHDC8B | P16T-E | Human | Esophagus | ESCC | 5.22e-08 | 7.91e-02 | 0.1153 |
| 200942 | KLHDC8B | P17T-E | Human | Esophagus | ESCC | 2.24e-02 | 1.65e-01 | 0.1278 |
| 200942 | KLHDC8B | P19T-E | Human | Esophagus | ESCC | 3.79e-02 | 2.89e-01 | 0.1662 |
| 200942 | KLHDC8B | P20T-E | Human | Esophagus | ESCC | 2.84e-07 | 1.95e-01 | 0.1124 |
| 200942 | KLHDC8B | P21T-E | Human | Esophagus | ESCC | 2.23e-28 | 4.83e-01 | 0.1617 |
| 200942 | KLHDC8B | P22T-E | Human | Esophagus | ESCC | 1.28e-05 | 8.55e-02 | 0.1236 |
| 200942 | KLHDC8B | P23T-E | Human | Esophagus | ESCC | 4.49e-09 | 2.51e-01 | 0.108 |
| 200942 | KLHDC8B | P24T-E | Human | Esophagus | ESCC | 2.03e-09 | 1.73e-01 | 0.1287 |
| 200942 | KLHDC8B | P26T-E | Human | Esophagus | ESCC | 8.65e-09 | 9.79e-02 | 0.1276 |
| Page: 1 2 3 4 |
| Tissue | Expression Dynamics | Abbreviation |
| Esophagus | 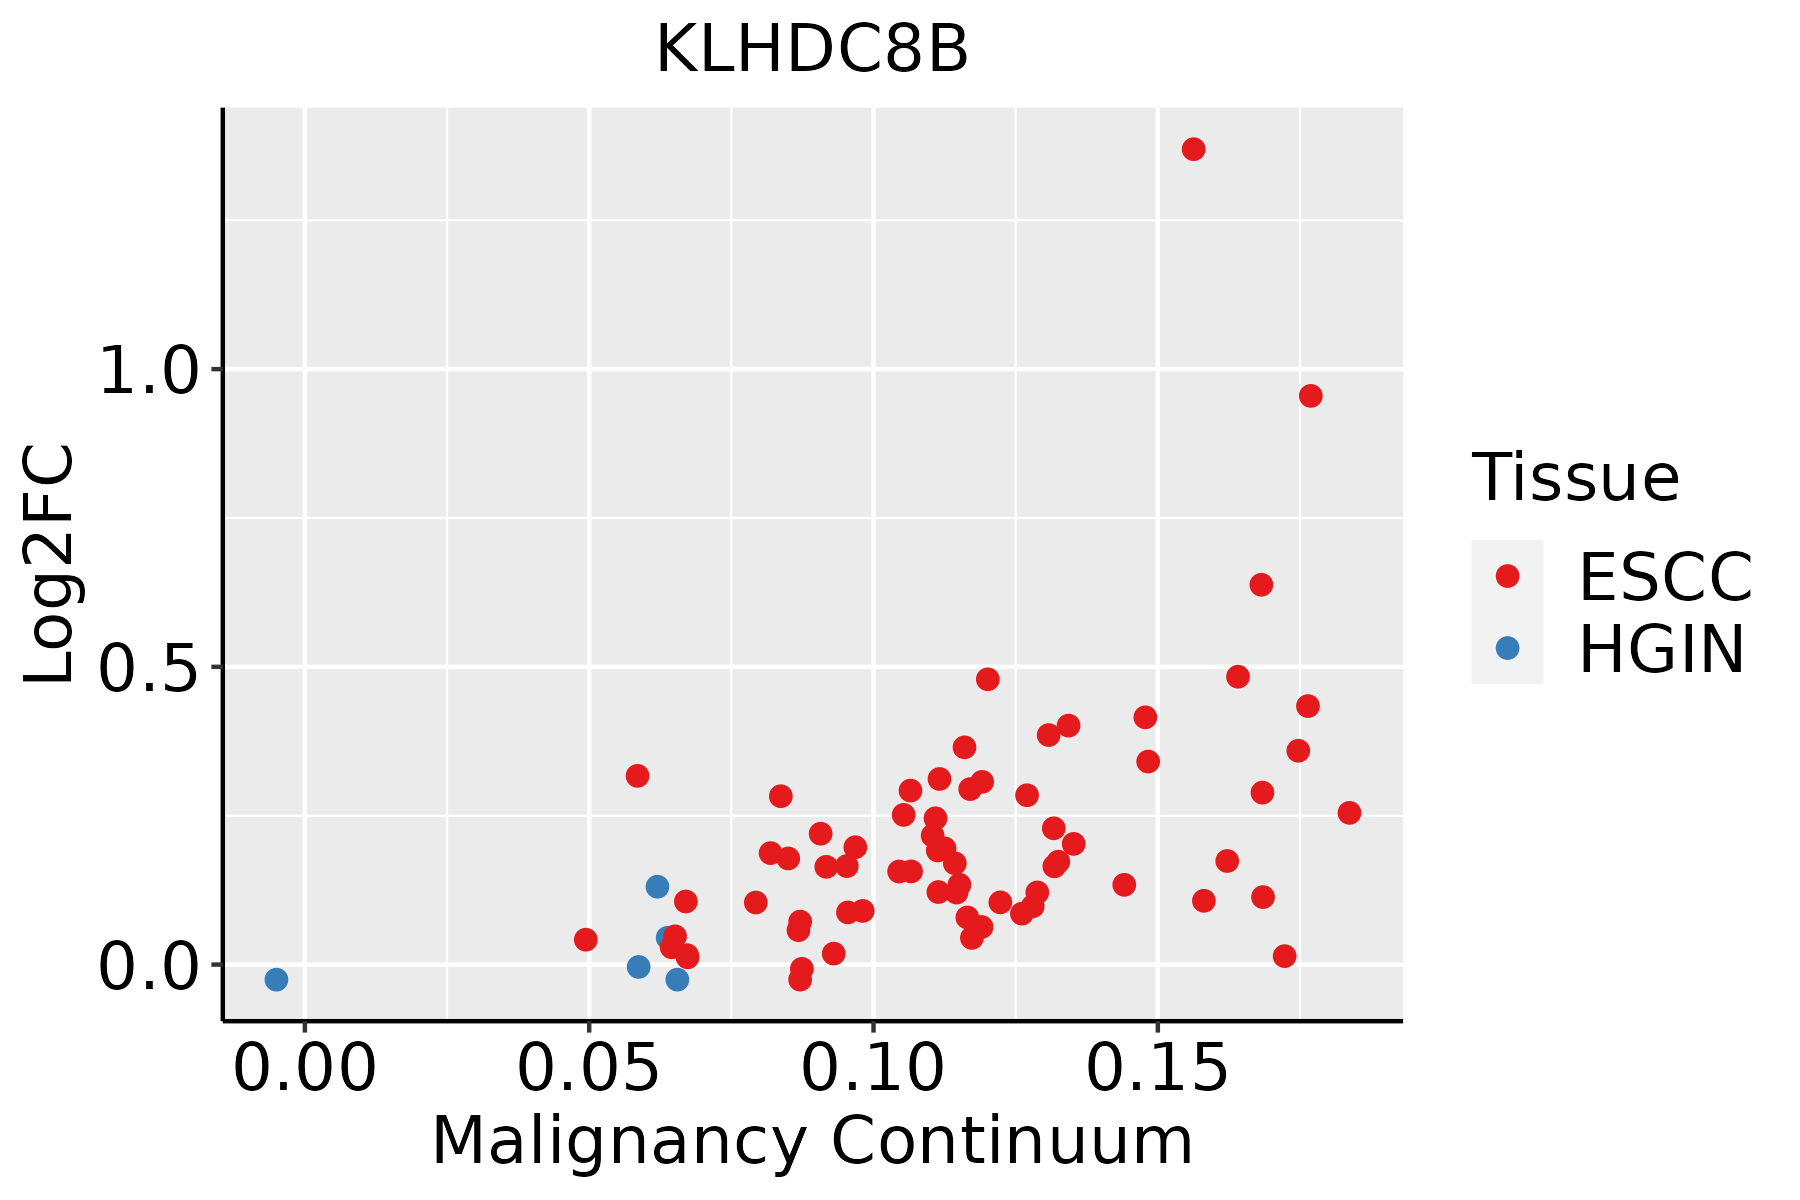 | ESCC: Esophageal squamous cell carcinoma |
| HGIN: High-grade intraepithelial neoplasias | ||
| LGIN: Low-grade intraepithelial neoplasias | ||
| Liver | 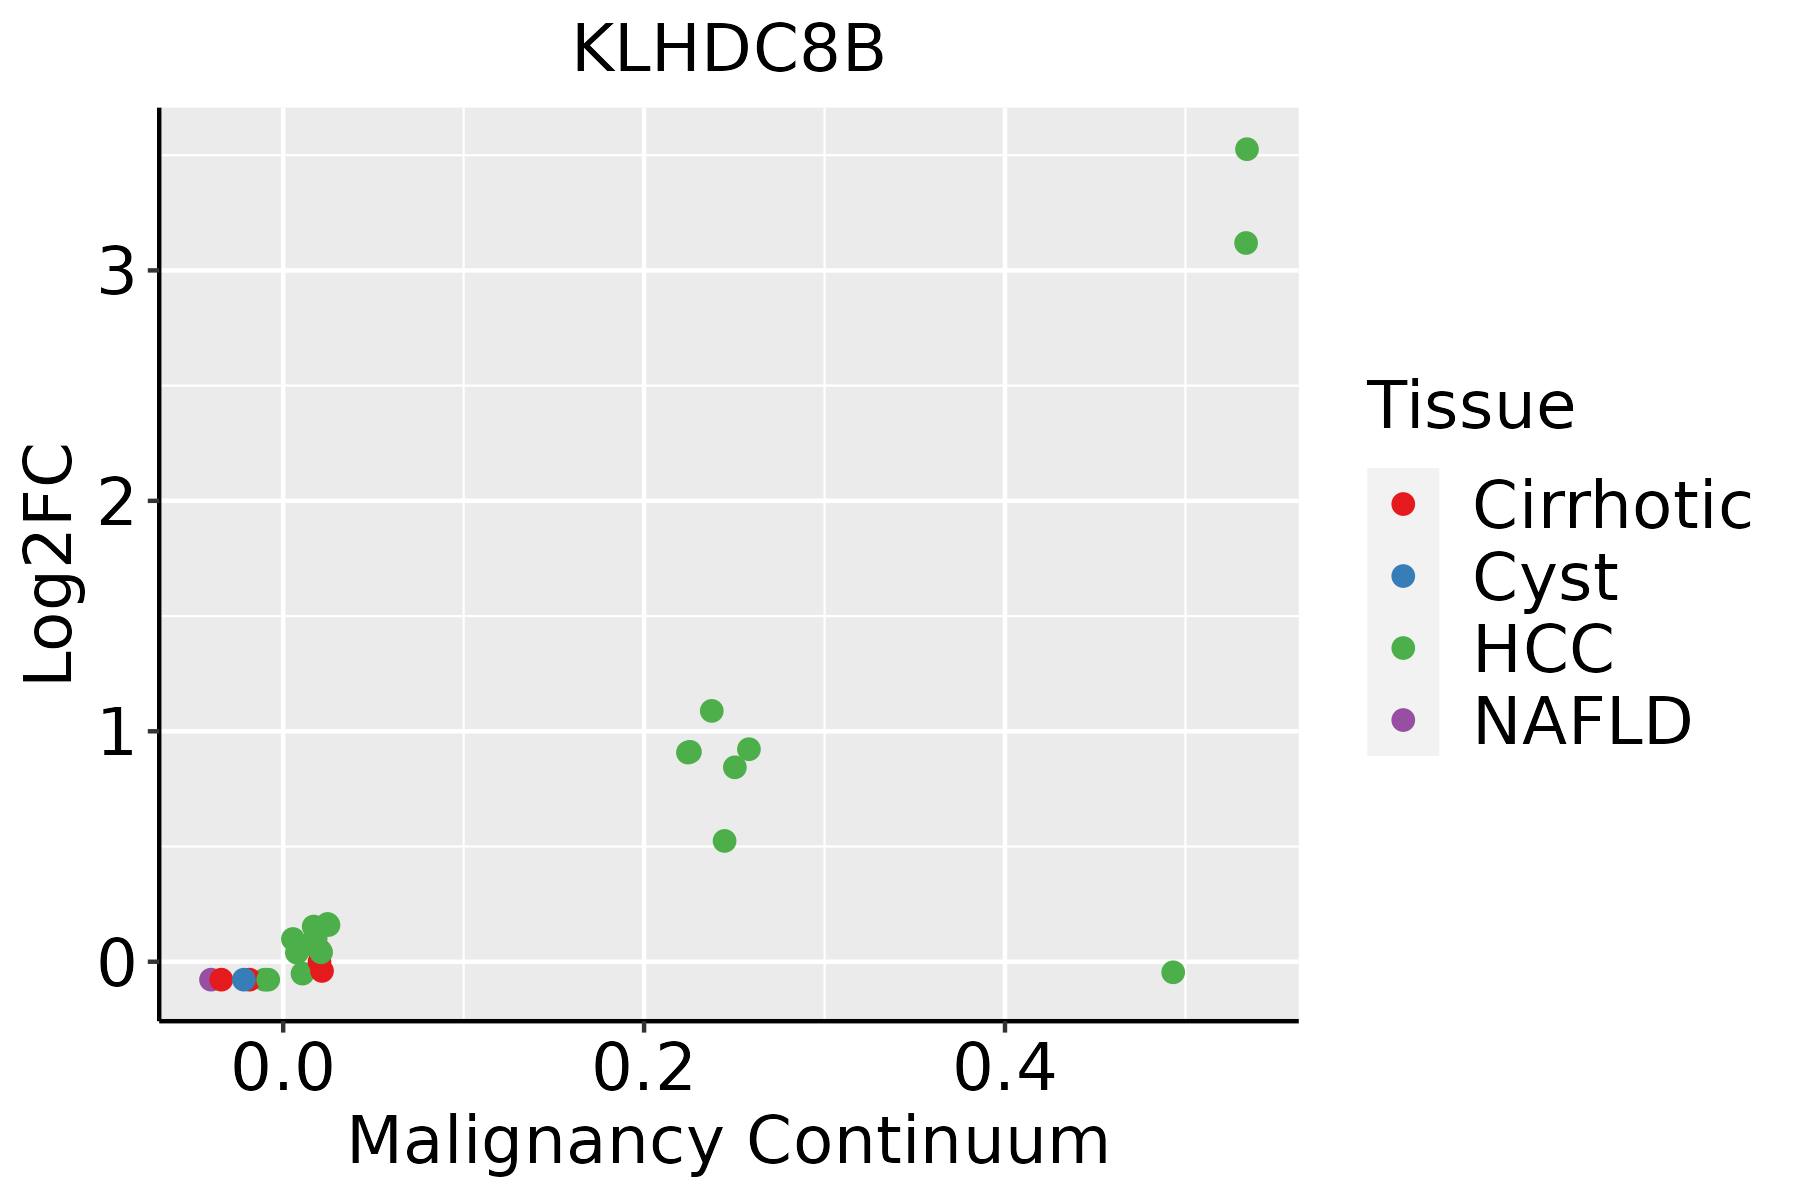 | HCC: Hepatocellular carcinoma |
| NAFLD: Non-alcoholic fatty liver disease |
| ∗log2FC in expression of this searched gene in stem-like cells from each diseased tissue sample relative to stem-like cells in normal samples in each tissue plotted against the malignancy continuum. Samples are colored based on if they are from different disease stage. |
Top |
Malignant transformation related pathway analysis |
| Find out the enriched GO biological processes and KEGG pathways involved in transition from healthy to precancer to cancer |
| Tissue | Disease Stage | Enriched GO biological Processes |
| Colorectum | AD |  |
| Colorectum | SER |  |
| Colorectum | MSS |  |
| Colorectum | MSI-H |  |
| Colorectum | FAP |  |
| ∗Top 15 enriched GO BP terms are showed in the bar plot of each disease state in each tissue. Each row represents a significant GO biological process which is colored according to the -log10(p.adjust). |
| Page: 1 2 3 4 5 6 7 8 9 |
| GO ID | Tissue | Disease Stage | Description | Gene Ratio | Bg Ratio | pvalue | p.adjust | Count |
| GO:014001414 | Esophagus | ESCC | mitotic nuclear division | 218/8552 | 287/18723 | 6.17e-26 | 1.78e-23 | 218 |
| GO:000705911 | Esophagus | ESCC | chromosome segregation | 238/8552 | 346/18723 | 1.72e-18 | 1.82e-16 | 238 |
| GO:00482853 | Esophagus | ESCC | organelle fission | 301/8552 | 488/18723 | 4.64e-13 | 2.12e-11 | 301 |
| GO:00988133 | Esophagus | ESCC | nuclear chromosome segregation | 187/8552 | 281/18723 | 1.00e-12 | 4.36e-11 | 187 |
| GO:00002802 | Esophagus | ESCC | nuclear division | 270/8552 | 439/18723 | 1.17e-11 | 4.24e-10 | 270 |
| GO:000028115 | Esophagus | ESCC | mitotic cytokinesis | 58/8552 | 71/18723 | 4.34e-10 | 1.15e-08 | 58 |
| GO:003250614 | Esophagus | ESCC | cytokinetic process | 35/8552 | 39/18723 | 9.38e-09 | 1.90e-07 | 35 |
| GO:000091016 | Esophagus | ESCC | cytokinesis | 115/8552 | 173/18723 | 2.48e-08 | 4.68e-07 | 115 |
| GO:006164015 | Esophagus | ESCC | cytoskeleton-dependent cytokinesis | 72/8552 | 100/18723 | 8.10e-08 | 1.39e-06 | 72 |
| GO:190241014 | Esophagus | ESCC | mitotic cytokinetic process | 22/8552 | 23/18723 | 4.17e-07 | 5.71e-06 | 22 |
| GO:19024105 | Liver | Cirrhotic | mitotic cytokinetic process | 15/4634 | 23/18723 | 4.75e-05 | 5.50e-04 | 15 |
| GO:00325063 | Liver | Cirrhotic | cytokinetic process | 21/4634 | 39/18723 | 9.13e-05 | 9.74e-04 | 21 |
| GO:00002812 | Liver | Cirrhotic | mitotic cytokinesis | 32/4634 | 71/18723 | 1.48e-04 | 1.42e-03 | 32 |
| GO:01400142 | Liver | Cirrhotic | mitotic nuclear division | 97/4634 | 287/18723 | 3.32e-04 | 2.87e-03 | 97 |
| GO:00009105 | Liver | Cirrhotic | cytokinesis | 62/4634 | 173/18723 | 7.13e-04 | 5.33e-03 | 62 |
| GO:00616402 | Liver | Cirrhotic | cytoskeleton-dependent cytokinesis | 38/4634 | 100/18723 | 2.22e-03 | 1.35e-02 | 38 |
| GO:014001411 | Liver | HCC | mitotic nuclear division | 174/7958 | 287/18723 | 3.74e-10 | 1.23e-08 | 174 |
| GO:0007059 | Liver | HCC | chromosome segregation | 197/7958 | 346/18723 | 3.57e-08 | 7.87e-07 | 197 |
| GO:003250611 | Liver | HCC | cytokinetic process | 32/7958 | 39/18723 | 4.73e-07 | 7.69e-06 | 32 |
| GO:000028111 | Liver | HCC | mitotic cytokinesis | 51/7958 | 71/18723 | 5.20e-07 | 8.38e-06 | 51 |
| Page: 1 2 |
| Pathway ID | Tissue | Disease Stage | Description | Gene Ratio | Bg Ratio | pvalue | p.adjust | qvalue | Count |
| Page: 1 |
Top |
Cell-cell communication analysis |
| Identification of potential cell-cell interactions between two cell types and their ligand-receptor pairs for different disease states |
| Ligand | Receptor | LRpair | Pathway | Tissue | Disease Stage |
| Page: 1 |
Top |
Single-cell gene regulatory network inference analysis |
| Find out the significant the regulons (TFs) and the target genes of each regulon across cell types for different disease states |
| TF | Cell Type | Tissue | Disease Stage | Target Gene | RSS | Regulon Activity |
| ∗The dot plots of a searched regulon are shown for all cell subpopulations in each disease state of each tissue based on the regulon specific score inferred using pySCENIC and by calculating the average expression. |
| Page: 1 |
Top |
Somatic mutation of malignant transformation related genes |
| Annotation of somatic variants for genes involved in malignant transformation |
| Hugo Symbol | Variant Class | Variant Classification | dbSNP RS | HGVSc | HGVSp | HGVSp Short | SWISSPROT | BIOTYPE | SIFT | PolyPhen | Tumor Sample Barcode | Tissue | Histology | Sex | Age | Stage | Therapy Types | Drugs | Outcome |
| KLHDC8B | SNV | Missense_Mutation | c.406G>A | p.Gly136Ser | p.G136S | Q8IXV7 | protein_coding | tolerated(0.07) | probably_damaging(0.94) | TCGA-BH-A0BG-01 | Breast | breast invasive carcinoma | Female | >=65 | I/II | Unknown | Unknown | SD | |
| KLHDC8B | SNV | Missense_Mutation | c.742N>C | p.Val248Leu | p.V248L | Q8IXV7 | protein_coding | tolerated(0.07) | possibly_damaging(0.677) | TCGA-C8-A12W-01 | Breast | breast invasive carcinoma | Female | <65 | III/IV | Unknown | Unknown | SD | |
| KLHDC8B | SNV | Missense_Mutation | rs770398325 | c.872N>C | p.Asn291Thr | p.N291T | Q8IXV7 | protein_coding | deleterious(0.01) | probably_damaging(0.995) | TCGA-EW-A1P7-01 | Breast | breast invasive carcinoma | Female | <65 | I/II | Chemotherapy | carboplatin | PD |
| KLHDC8B | SNV | Missense_Mutation | novel | c.579N>C | p.Glu193Asp | p.E193D | Q8IXV7 | protein_coding | deleterious(0.01) | probably_damaging(0.999) | TCGA-CA-6717-01 | Colorectum | colon adenocarcinoma | Male | <65 | I/II | Chemotherapy | oxaliplatin | CR |
| KLHDC8B | SNV | Missense_Mutation | rs756090460 | c.325N>T | p.Arg109Cys | p.R109C | Q8IXV7 | protein_coding | deleterious(0) | possibly_damaging(0.634) | TCGA-CM-5861-01 | Colorectum | colon adenocarcinoma | Female | <65 | I/II | Unknown | Unknown | PD |
| KLHDC8B | SNV | Missense_Mutation | c.713N>G | p.Phe238Cys | p.F238C | Q8IXV7 | protein_coding | deleterious(0.01) | probably_damaging(0.969) | TCGA-DM-A28F-01 | Colorectum | colon adenocarcinoma | Male | >=65 | III/IV | Unknown | Unknown | SD | |
| KLHDC8B | SNV | Missense_Mutation | c.797G>A | p.Arg266His | p.R266H | Q8IXV7 | protein_coding | tolerated(0.46) | possibly_damaging(0.808) | TCGA-F4-6569-01 | Colorectum | colon adenocarcinoma | Male | <65 | I/II | Ancillary | leucovorin | CR | |
| KLHDC8B | SNV | Missense_Mutation | c.695N>C | p.Gln232Pro | p.Q232P | Q8IXV7 | protein_coding | deleterious(0) | probably_damaging(0.999) | TCGA-G4-6588-01 | Colorectum | colon adenocarcinoma | Female | <65 | I/II | Unknown | Unknown | SD | |
| KLHDC8B | SNV | Missense_Mutation | rs139371579 | c.611N>A | p.Arg204Gln | p.R204Q | Q8IXV7 | protein_coding | deleterious(0.03) | possibly_damaging(0.84) | TCGA-AF-A56L-01 | Colorectum | rectum adenocarcinoma | Female | <65 | III/IV | Chemotherapy | oxaliplatin | CR |
| KLHDC8B | deletion | Frame_Shift_Del | c.108delN | p.Gly38ValfsTer38 | p.G38Vfs*38 | Q8IXV7 | protein_coding | TCGA-A6-2686-01 | Colorectum | colon adenocarcinoma | Female | >=65 | I/II | Unknown | Unknown | SD |
| Page: 1 2 3 4 |
Top |
Related drugs of malignant transformation related genes |
| Identification of chemicals and drugs interact with genes involved in malignant transfromation |
| (DGIdb 4.0) |
| Entrez ID | Symbol | Category | Interaction Types | Drug Claim Name | Drug Name | PMIDs |
| Page: 1 |

Copyright 2023-Present -The University of Texas Health Science Center at Houston |