
|
|||||
|
 | |
| |
| |
| |
| |
| |
|
Gene: KLHDC7B |
Gene summary for KLHDC7B |
| Gene information | Species | Human | Gene symbol | KLHDC7B | Gene ID | 113730 |
| Gene name | kelch domain containing 7B | |
| Gene Alias | KLHDC7B | |
| Cytomap | 22q13.33 | |
| Gene Type | protein-coding | GO ID | GO:0003674 | UniProtAcc | Q96G42 |
Top |
Malignant transformation analysis |
| Identification of the aberrant gene expression in precancerous and cancerous lesions by comparing the gene expression of stem-like cells in diseased tissues with normal stem cells |
| Entrez ID | Symbol | Replicates | Species | Organ | Tissue | Adj P-value | Log2FC | Malignancy |
| 113730 | KLHDC7B | Tumor | Human | Cervix | CC | 2.37e-52 | 1.03e+00 | 0.1241 |
| 113730 | KLHDC7B | sample1 | Human | Cervix | CC | 6.72e-05 | 3.69e-01 | 0.0959 |
| 113730 | KLHDC7B | sample3 | Human | Cervix | CC | 1.73e-64 | 1.10e+00 | 0.1387 |
| 113730 | KLHDC7B | T1 | Human | Cervix | CC | 2.46e-07 | 3.18e-01 | 0.0918 |
| 113730 | KLHDC7B | T3 | Human | Cervix | CC | 2.38e-63 | 1.09e+00 | 0.1389 |
| 113730 | KLHDC7B | P2T-E | Human | Esophagus | ESCC | 2.28e-35 | 7.07e-01 | 0.1177 |
| 113730 | KLHDC7B | P31T-E | Human | Esophagus | ESCC | 5.30e-21 | 5.33e-01 | 0.1251 |
| 113730 | KLHDC7B | P36T-E | Human | Esophagus | ESCC | 7.91e-07 | 2.27e-01 | 0.1187 |
| 113730 | KLHDC7B | P130T-E | Human | Esophagus | ESCC | 2.93e-15 | 4.36e-01 | 0.1676 |
| 113730 | KLHDC7B | C46 | Human | Oral cavity | OSCC | 2.12e-31 | 7.12e-01 | 0.1673 |
| 113730 | KLHDC7B | LN22 | Human | Oral cavity | OSCC | 9.22e-13 | 9.37e-01 | 0.1733 |
| 113730 | KLHDC7B | LN46 | Human | Oral cavity | OSCC | 2.85e-13 | 4.88e-01 | 0.1666 |
| Page: 1 |
| Tissue | Expression Dynamics | Abbreviation |
| Cervix | 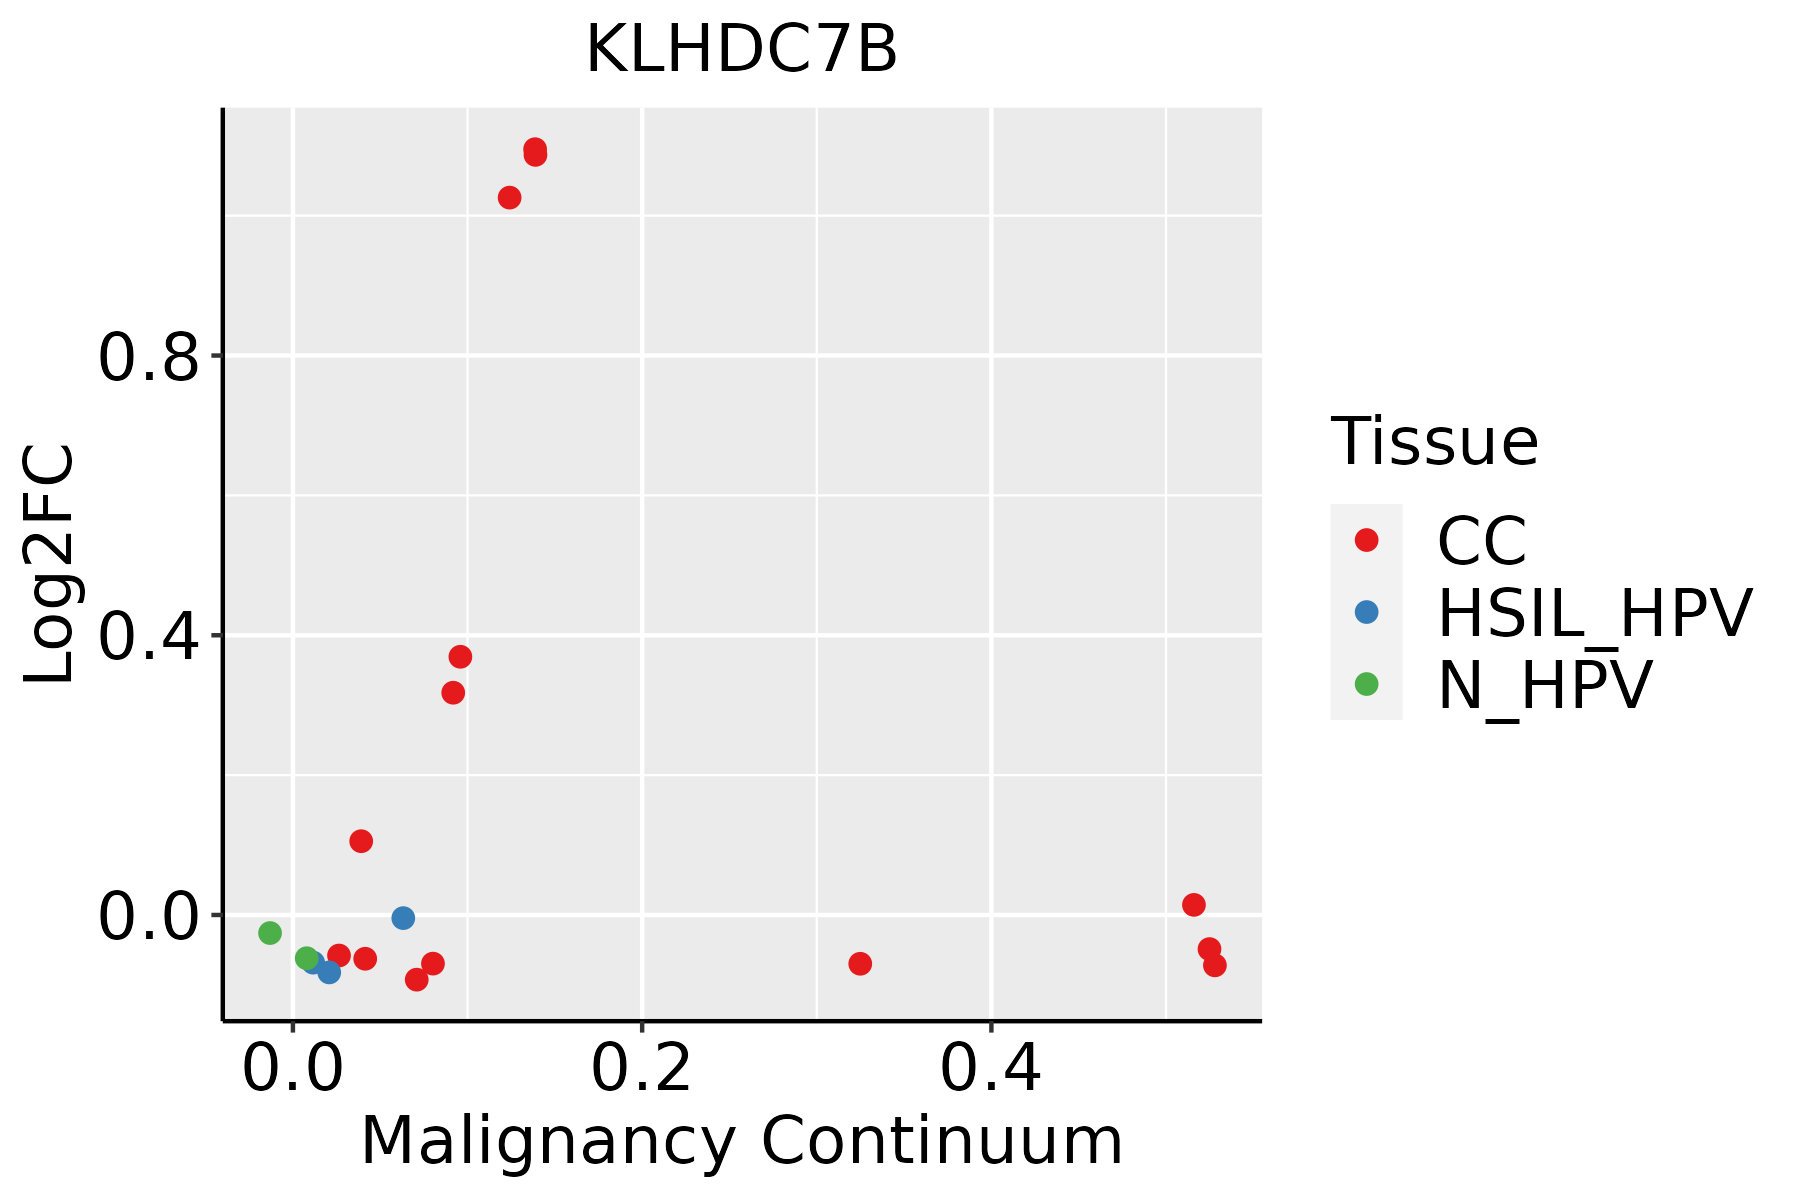 | CC: Cervix cancer |
| HSIL_HPV: HPV-infected high-grade squamous intraepithelial lesions | ||
| N_HPV: HPV-infected normal cervix | ||
| Esophagus | 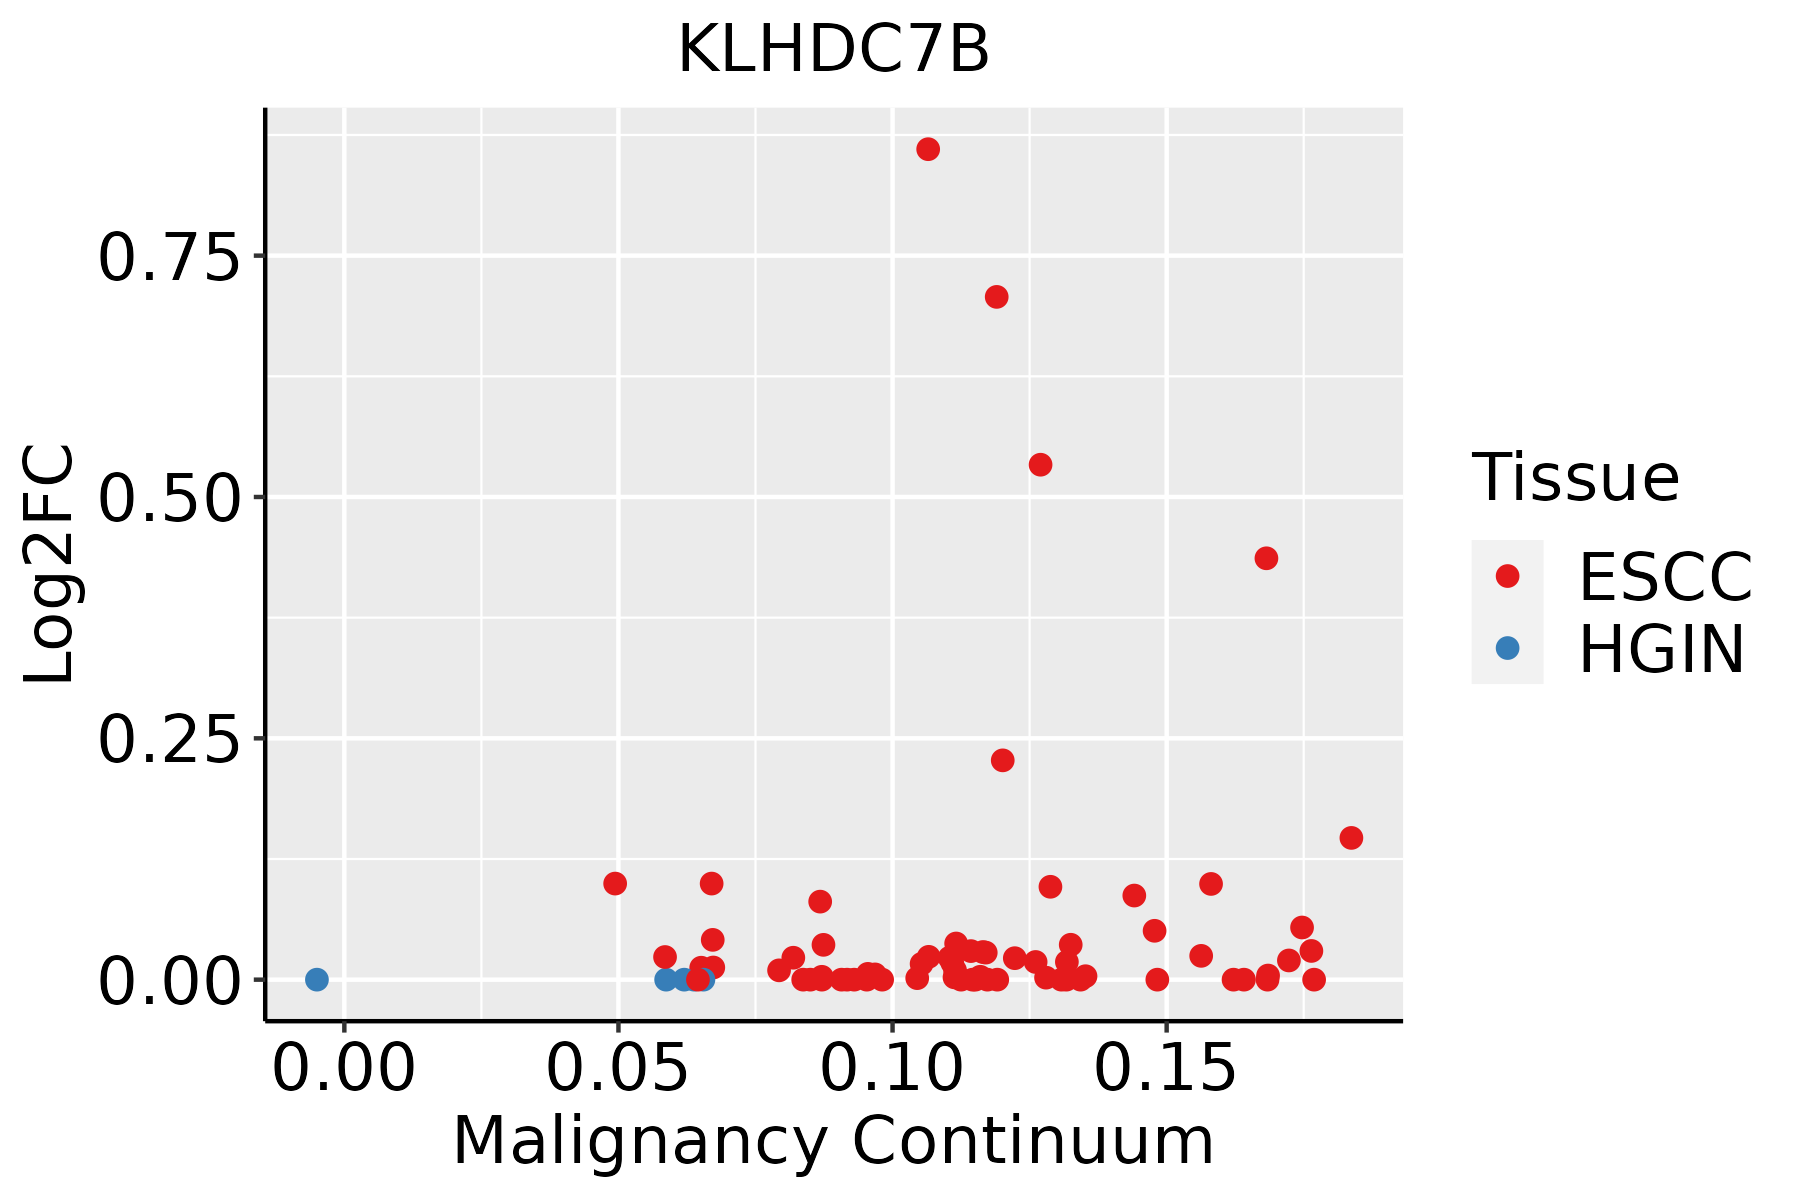 | ESCC: Esophageal squamous cell carcinoma |
| HGIN: High-grade intraepithelial neoplasias | ||
| LGIN: Low-grade intraepithelial neoplasias | ||
| Oral Cavity | 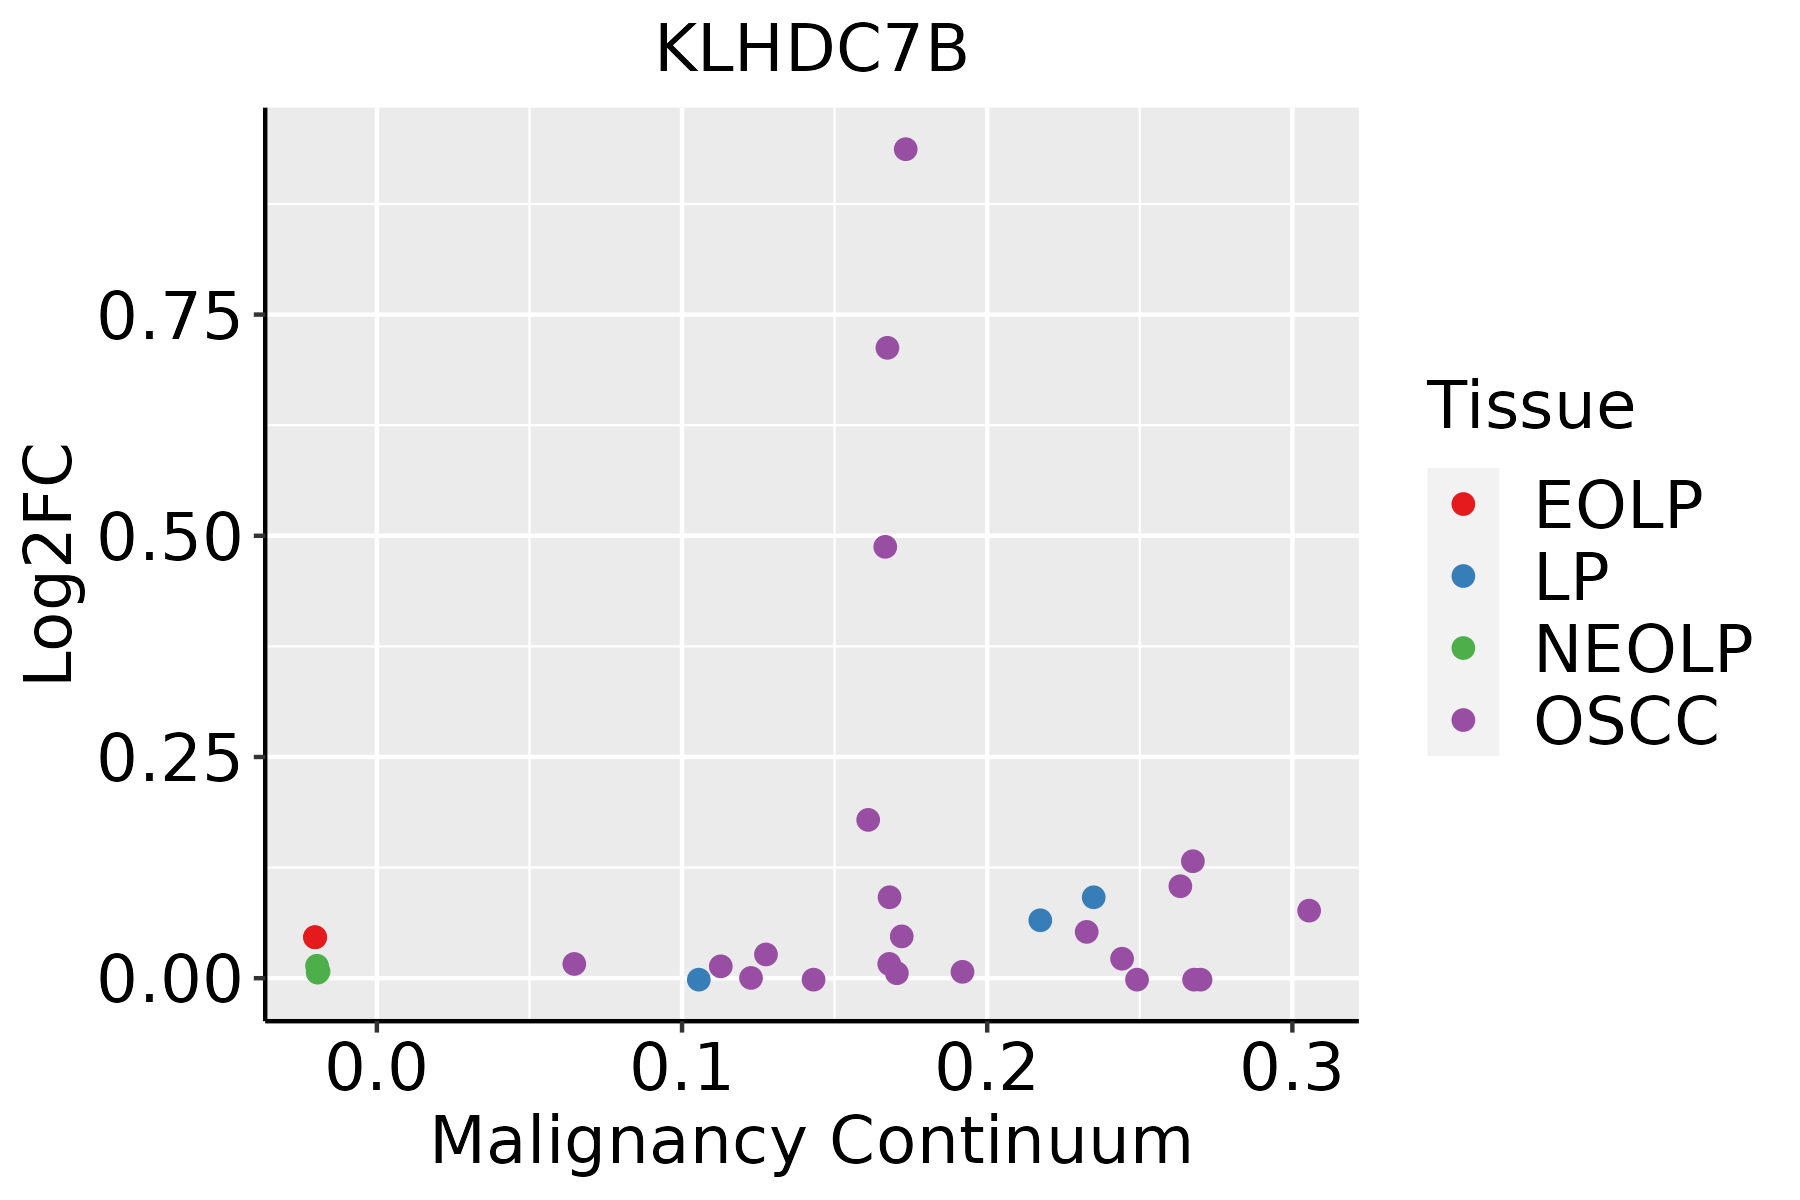 | EOLP: Erosive Oral lichen planus |
| LP: leukoplakia | ||
| NEOLP: Non-erosive oral lichen planus | ||
| OSCC: Oral squamous cell carcinoma |
| ∗log2FC in expression of this searched gene in stem-like cells from each diseased tissue sample relative to stem-like cells in normal samples in each tissue plotted against the malignancy continuum. Samples are colored based on if they are from different disease stage. |
Top |
Malignant transformation related pathway analysis |
| Find out the enriched GO biological processes and KEGG pathways involved in transition from healthy to precancer to cancer |
| Tissue | Disease Stage | Enriched GO biological Processes |
| Colorectum | AD |  |
| Colorectum | SER |  |
| Colorectum | MSS |  |
| Colorectum | MSI-H |  |
| Colorectum | FAP |  |
| ∗Top 15 enriched GO BP terms are showed in the bar plot of each disease state in each tissue. Each row represents a significant GO biological process which is colored according to the -log10(p.adjust). |
| Page: 1 2 3 4 5 6 7 8 9 |
| GO ID | Tissue | Disease Stage | Description | Gene Ratio | Bg Ratio | pvalue | p.adjust | Count |
| Page: 1 |
| Pathway ID | Tissue | Disease Stage | Description | Gene Ratio | Bg Ratio | pvalue | p.adjust | qvalue | Count |
| Page: 1 |
Top |
Cell-cell communication analysis |
| Identification of potential cell-cell interactions between two cell types and their ligand-receptor pairs for different disease states |
| Ligand | Receptor | LRpair | Pathway | Tissue | Disease Stage |
| Page: 1 |
Top |
Single-cell gene regulatory network inference analysis |
| Find out the significant the regulons (TFs) and the target genes of each regulon across cell types for different disease states |
| TF | Cell Type | Tissue | Disease Stage | Target Gene | RSS | Regulon Activity |
| ∗The dot plots of a searched regulon are shown for all cell subpopulations in each disease state of each tissue based on the regulon specific score inferred using pySCENIC and by calculating the average expression. |
| Page: 1 |
Top |
Somatic mutation of malignant transformation related genes |
| Annotation of somatic variants for genes involved in malignant transformation |
| Hugo Symbol | Variant Class | Variant Classification | dbSNP RS | HGVSc | HGVSp | HGVSp Short | SWISSPROT | BIOTYPE | SIFT | PolyPhen | Tumor Sample Barcode | Tissue | Histology | Sex | Age | Stage | Therapy Types | Drugs | Outcome |
| KLHDC7B | SNV | Missense_Mutation | c.172N>A | p.Glu58Lys | p.E58K | Q96G42 | protein_coding | tolerated_low_confidence(0.08) | benign(0.001) | TCGA-AC-A23H-01 | Breast | breast invasive carcinoma | Female | >=65 | I/II | Unknown | Unknown | PD | |
| KLHDC7B | insertion | Frame_Shift_Ins | novel | c.1076_1077insG | p.Ile362HisfsTer226 | p.I362Hfs*226 | Q96G42 | protein_coding | TCGA-A8-A09Z-01 | Breast | breast invasive carcinoma | Female | >=65 | I/II | Unknown | Unknown | SD | ||
| KLHDC7B | SNV | Missense_Mutation | c.1295C>T | p.Ala432Val | p.A432V | Q96G42 | protein_coding | deleterious(0) | probably_damaging(0.999) | TCGA-EX-A1H5-01 | Cervix | cervical & endocervical cancer | Female | <65 | I/II | Unknown | Unknown | SD | |
| KLHDC7B | SNV | Missense_Mutation | novel | c.1027C>T | p.Pro343Ser | p.P343S | Q96G42 | protein_coding | tolerated(0.06) | benign(0.345) | TCGA-VS-A8QC-01 | Cervix | cervical & endocervical cancer | Female | <65 | I/II | Chemotherapy | paclitaxel | PD |
| KLHDC7B | SNV | Missense_Mutation | c.326N>T | p.Ala109Val | p.A109V | Q96G42 | protein_coding | tolerated_low_confidence(0.22) | benign(0.001) | TCGA-AA-A01P-01 | Colorectum | colon adenocarcinoma | Female | >=65 | III/IV | Unknown | Unknown | PD | |
| KLHDC7B | SNV | Missense_Mutation | c.245N>C | p.Leu82Pro | p.L82P | Q96G42 | protein_coding | tolerated_low_confidence(1) | benign(0) | TCGA-AZ-6601-01 | Colorectum | colon adenocarcinoma | Male | >=65 | I/II | Unknown | Unknown | PD | |
| KLHDC7B | SNV | Missense_Mutation | novel | c.1459N>A | p.Asp487Asn | p.D487N | Q96G42 | protein_coding | deleterious(0) | probably_damaging(0.956) | TCGA-CA-6717-01 | Colorectum | colon adenocarcinoma | Male | <65 | I/II | Chemotherapy | oxaliplatin | CR |
| KLHDC7B | SNV | Missense_Mutation | c.1622N>C | p.Ile541Thr | p.I541T | Q96G42 | protein_coding | deleterious(0) | probably_damaging(0.987) | TCGA-CK-5913-01 | Colorectum | colon adenocarcinoma | Female | <65 | I/II | Unknown | Unknown | SD | |
| KLHDC7B | SNV | Missense_Mutation | rs758075611 | c.1504N>T | p.Arg502Trp | p.R502W | Q96G42 | protein_coding | deleterious(0) | probably_damaging(0.973) | TCGA-D5-6540-01 | Colorectum | colon adenocarcinoma | Male | >=65 | I/II | Unknown | Unknown | SD |
| KLHDC7B | SNV | Missense_Mutation | rs771604779 | c.1360N>A | p.Val454Ile | p.V454I | Q96G42 | protein_coding | deleterious(0.05) | probably_damaging(0.929) | TCGA-A5-A0G1-01 | Endometrium | uterine corpus endometrioid carcinoma | Female | >=65 | I/II | Unknown | Unknown | SD |
| Page: 1 2 3 4 |
Top |
Related drugs of malignant transformation related genes |
| Identification of chemicals and drugs interact with genes involved in malignant transfromation |
| (DGIdb 4.0) |
| Entrez ID | Symbol | Category | Interaction Types | Drug Claim Name | Drug Name | PMIDs |
| Page: 1 |

Copyright 2023-Present -The University of Texas Health Science Center at Houston |