
|
|||||
|
 | |
| |
| |
| |
| |
| |
|
Gene: KLHDC3 |
Gene summary for KLHDC3 |
| Gene information | Species | Human | Gene symbol | KLHDC3 | Gene ID | 116138 |
| Gene name | kelch domain containing 3 | |
| Gene Alias | PEAS | |
| Cytomap | 6p21.1 | |
| Gene Type | protein-coding | GO ID | GO:0000003 | UniProtAcc | Q9BQ90 |
Top |
Malignant transformation analysis |
| Identification of the aberrant gene expression in precancerous and cancerous lesions by comparing the gene expression of stem-like cells in diseased tissues with normal stem cells |
| Entrez ID | Symbol | Replicates | Species | Organ | Tissue | Adj P-value | Log2FC | Malignancy |
| 116138 | KLHDC3 | HTA11_2487_2000001011 | Human | Colorectum | SER | 4.21e-07 | 3.63e-01 | -0.1808 |
| 116138 | KLHDC3 | HTA11_1938_2000001011 | Human | Colorectum | AD | 2.62e-04 | 3.25e-01 | -0.0811 |
| 116138 | KLHDC3 | HTA11_78_2000001011 | Human | Colorectum | AD | 2.58e-02 | 2.00e-01 | -0.1088 |
| 116138 | KLHDC3 | HTA11_347_2000001011 | Human | Colorectum | AD | 1.41e-09 | 3.03e-01 | -0.1954 |
| 116138 | KLHDC3 | HTA11_3361_2000001011 | Human | Colorectum | AD | 1.43e-06 | 3.60e-01 | -0.1207 |
| 116138 | KLHDC3 | HTA11_696_2000001011 | Human | Colorectum | AD | 1.74e-08 | 3.12e-01 | -0.1464 |
| 116138 | KLHDC3 | HTA11_866_2000001011 | Human | Colorectum | AD | 4.39e-02 | 2.01e-01 | -0.1001 |
| 116138 | KLHDC3 | HTA11_1391_2000001011 | Human | Colorectum | AD | 3.83e-06 | 2.95e-01 | -0.059 |
| 116138 | KLHDC3 | HTA11_546_2000001011 | Human | Colorectum | AD | 2.96e-02 | 3.65e-01 | -0.0842 |
| 116138 | KLHDC3 | HTA11_866_3004761011 | Human | Colorectum | AD | 5.29e-03 | 2.11e-01 | 0.096 |
| 116138 | KLHDC3 | HTA11_10711_2000001011 | Human | Colorectum | AD | 1.02e-02 | 2.26e-01 | 0.0338 |
| 116138 | KLHDC3 | HTA11_6818_2000001021 | Human | Colorectum | AD | 2.01e-03 | 2.89e-01 | 0.0588 |
| 116138 | KLHDC3 | HTA11_99999965104_69814 | Human | Colorectum | MSS | 8.10e-04 | 3.32e-01 | 0.281 |
| 116138 | KLHDC3 | HTA11_99999971662_82457 | Human | Colorectum | MSS | 1.77e-05 | 2.99e-01 | 0.3859 |
| 116138 | KLHDC3 | LZE2T | Human | Esophagus | ESCC | 5.25e-06 | 1.41e+00 | 0.082 |
| 116138 | KLHDC3 | LZE4T | Human | Esophagus | ESCC | 6.37e-05 | 2.56e-01 | 0.0811 |
| 116138 | KLHDC3 | LZE7T | Human | Esophagus | ESCC | 1.34e-09 | 8.07e-01 | 0.0667 |
| 116138 | KLHDC3 | LZE8T | Human | Esophagus | ESCC | 1.27e-06 | 2.74e-01 | 0.067 |
| 116138 | KLHDC3 | LZE22T | Human | Esophagus | ESCC | 2.99e-03 | 3.40e-01 | 0.068 |
| 116138 | KLHDC3 | LZE24T | Human | Esophagus | ESCC | 3.49e-23 | 6.28e-01 | 0.0596 |
| Page: 1 2 3 4 5 6 7 |
| Tissue | Expression Dynamics | Abbreviation |
| Colorectum (GSE201348) |  | FAP: Familial adenomatous polyposis |
| CRC: Colorectal cancer | ||
| Colorectum (HTA11) |  | AD: Adenomas |
| SER: Sessile serrated lesions | ||
| MSI-H: Microsatellite-high colorectal cancer | ||
| MSS: Microsatellite stable colorectal cancer | ||
| Esophagus |  | ESCC: Esophageal squamous cell carcinoma |
| HGIN: High-grade intraepithelial neoplasias | ||
| LGIN: Low-grade intraepithelial neoplasias | ||
| Liver | 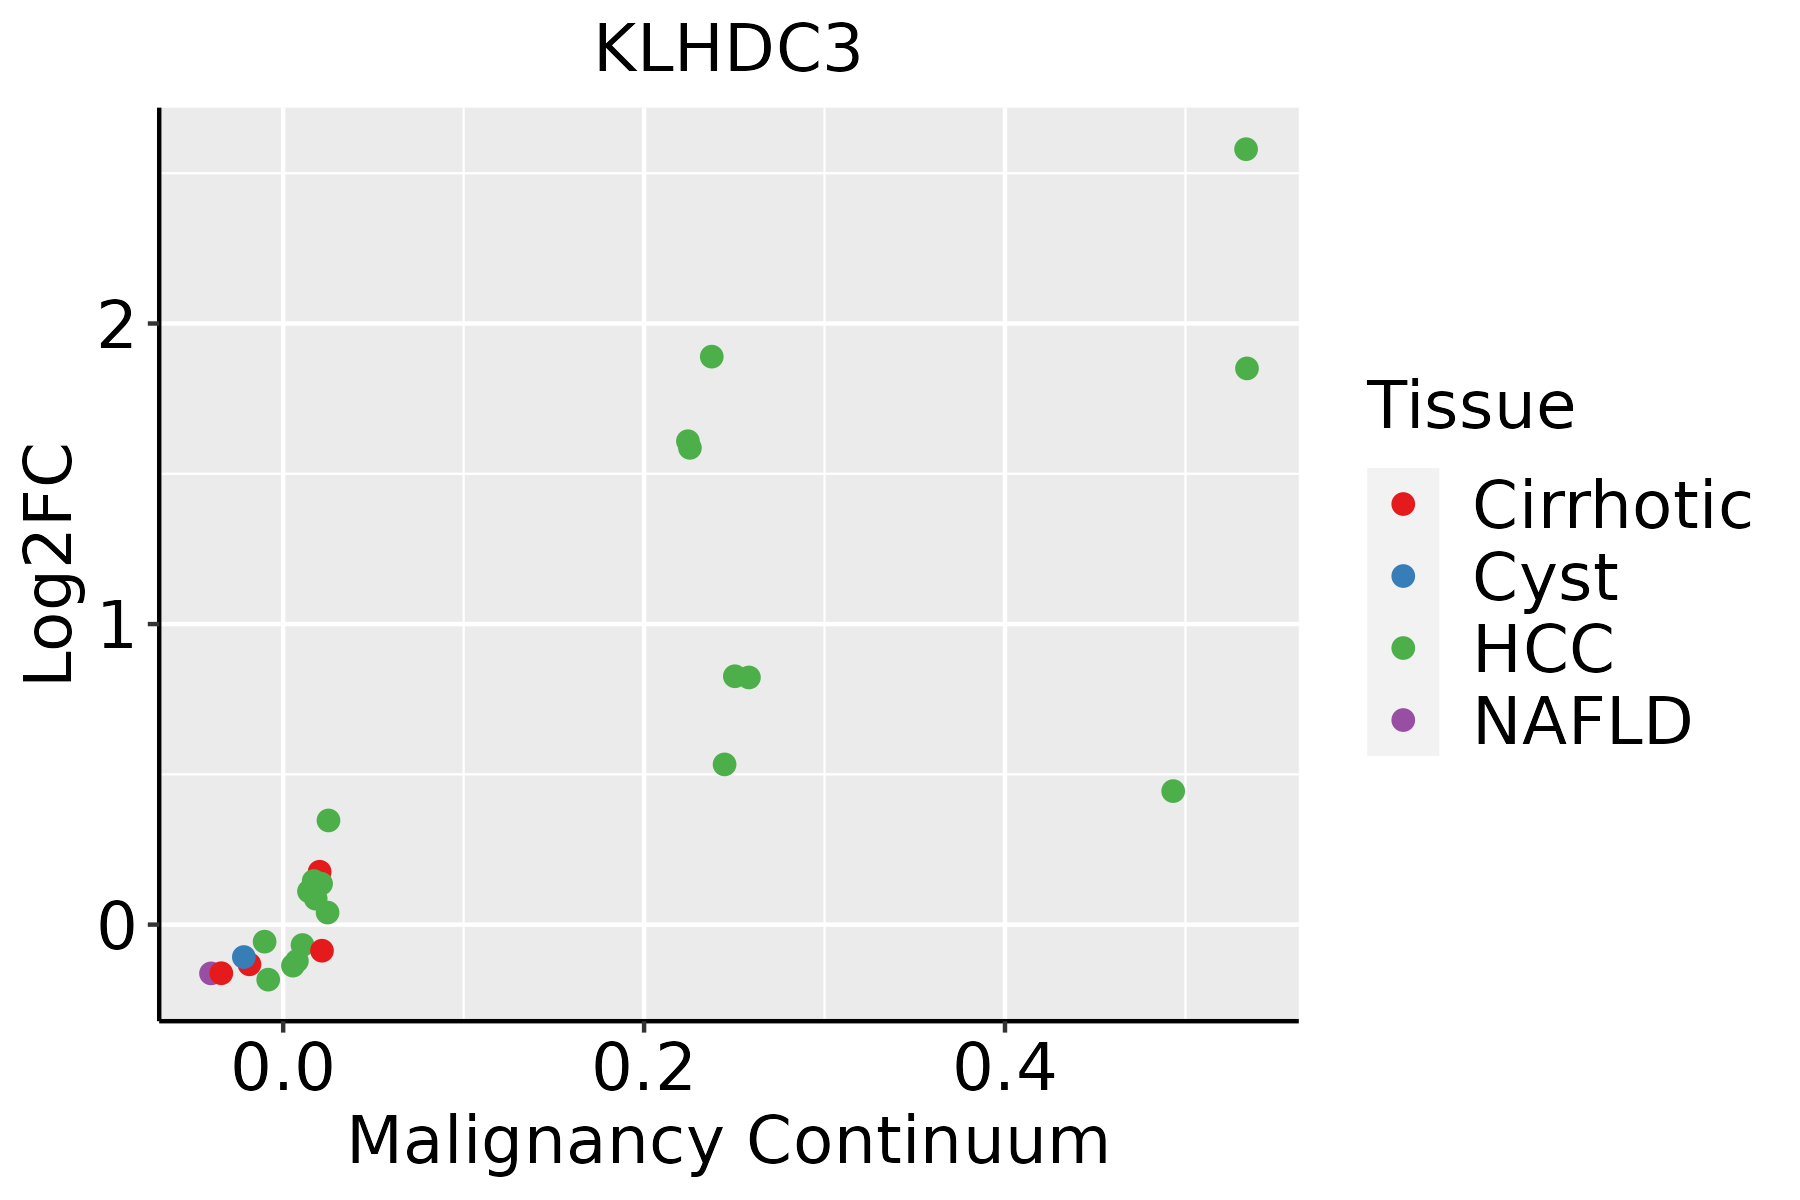 | HCC: Hepatocellular carcinoma |
| NAFLD: Non-alcoholic fatty liver disease | ||
| Oral Cavity | 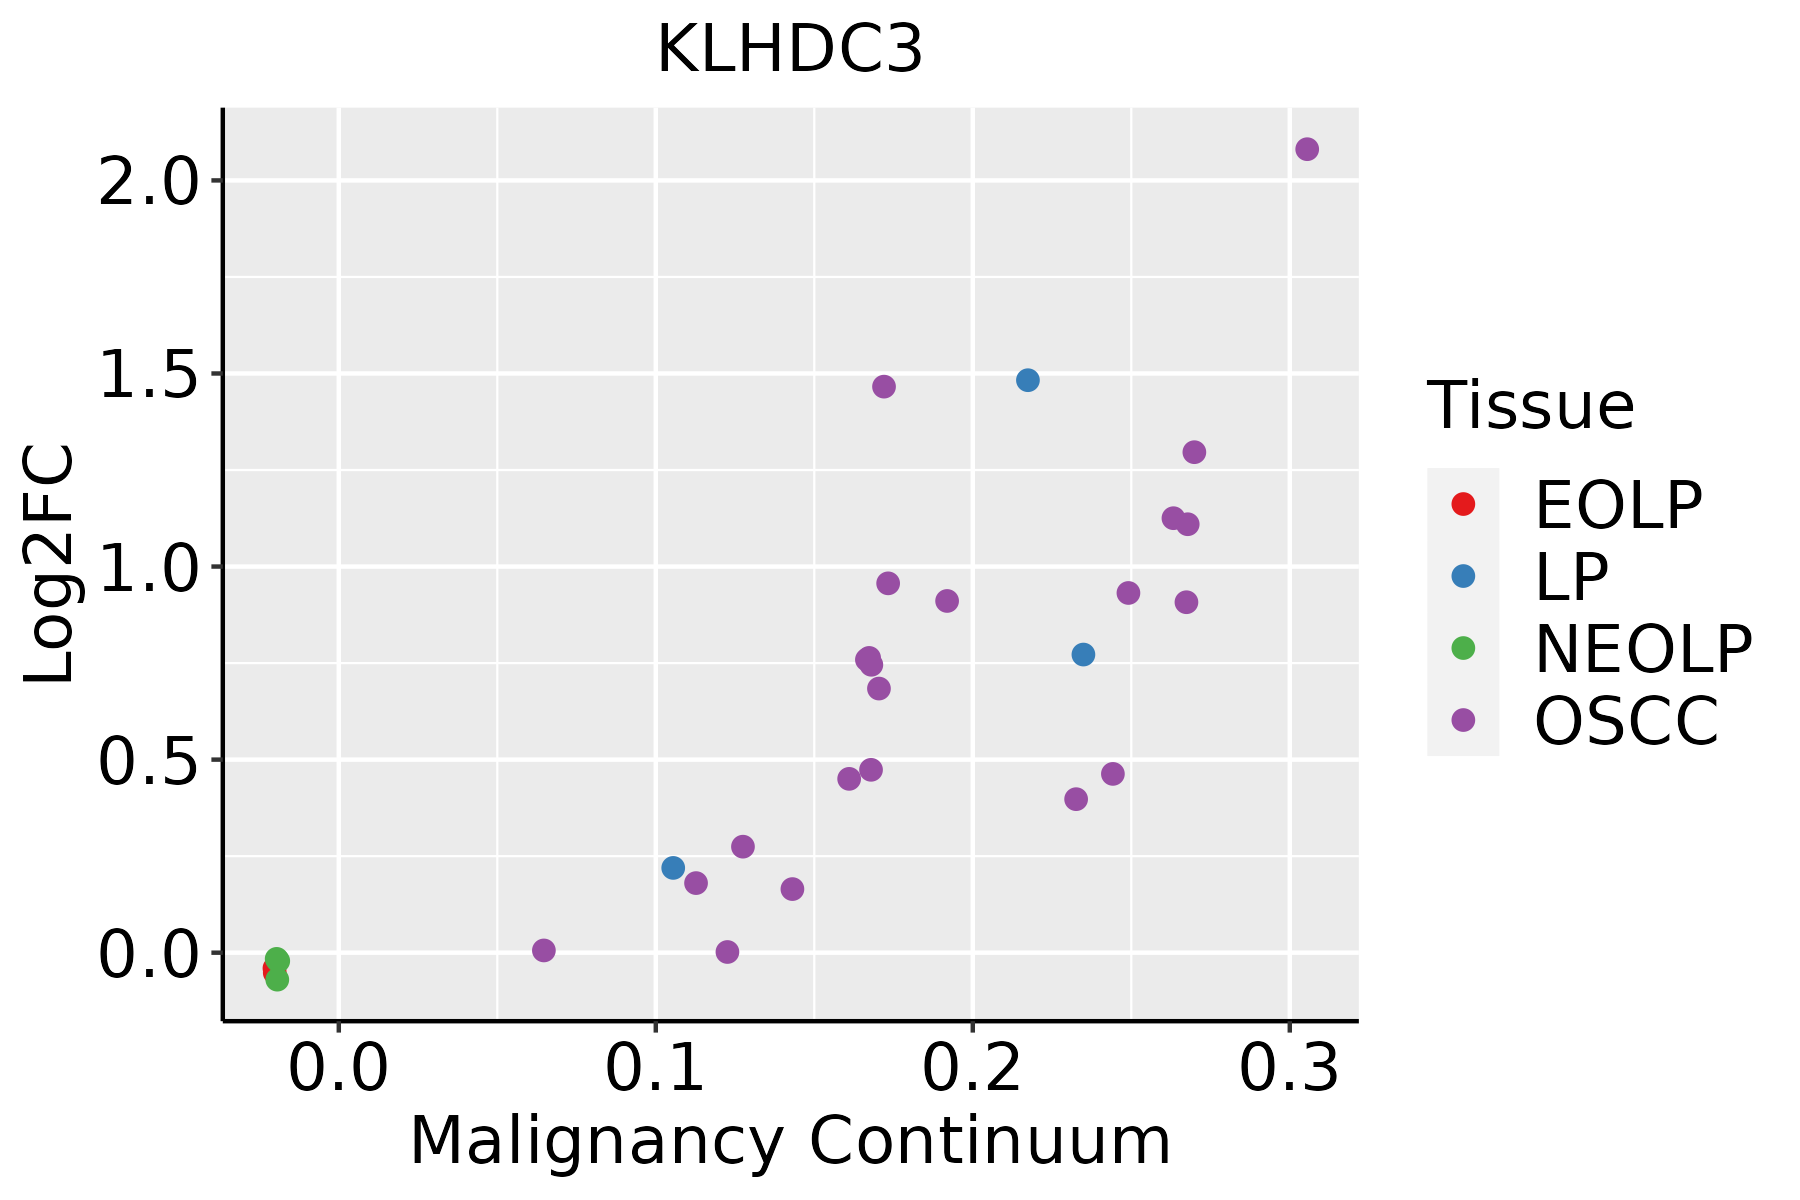 | EOLP: Erosive Oral lichen planus |
| LP: leukoplakia | ||
| NEOLP: Non-erosive oral lichen planus | ||
| OSCC: Oral squamous cell carcinoma | ||
| Skin | 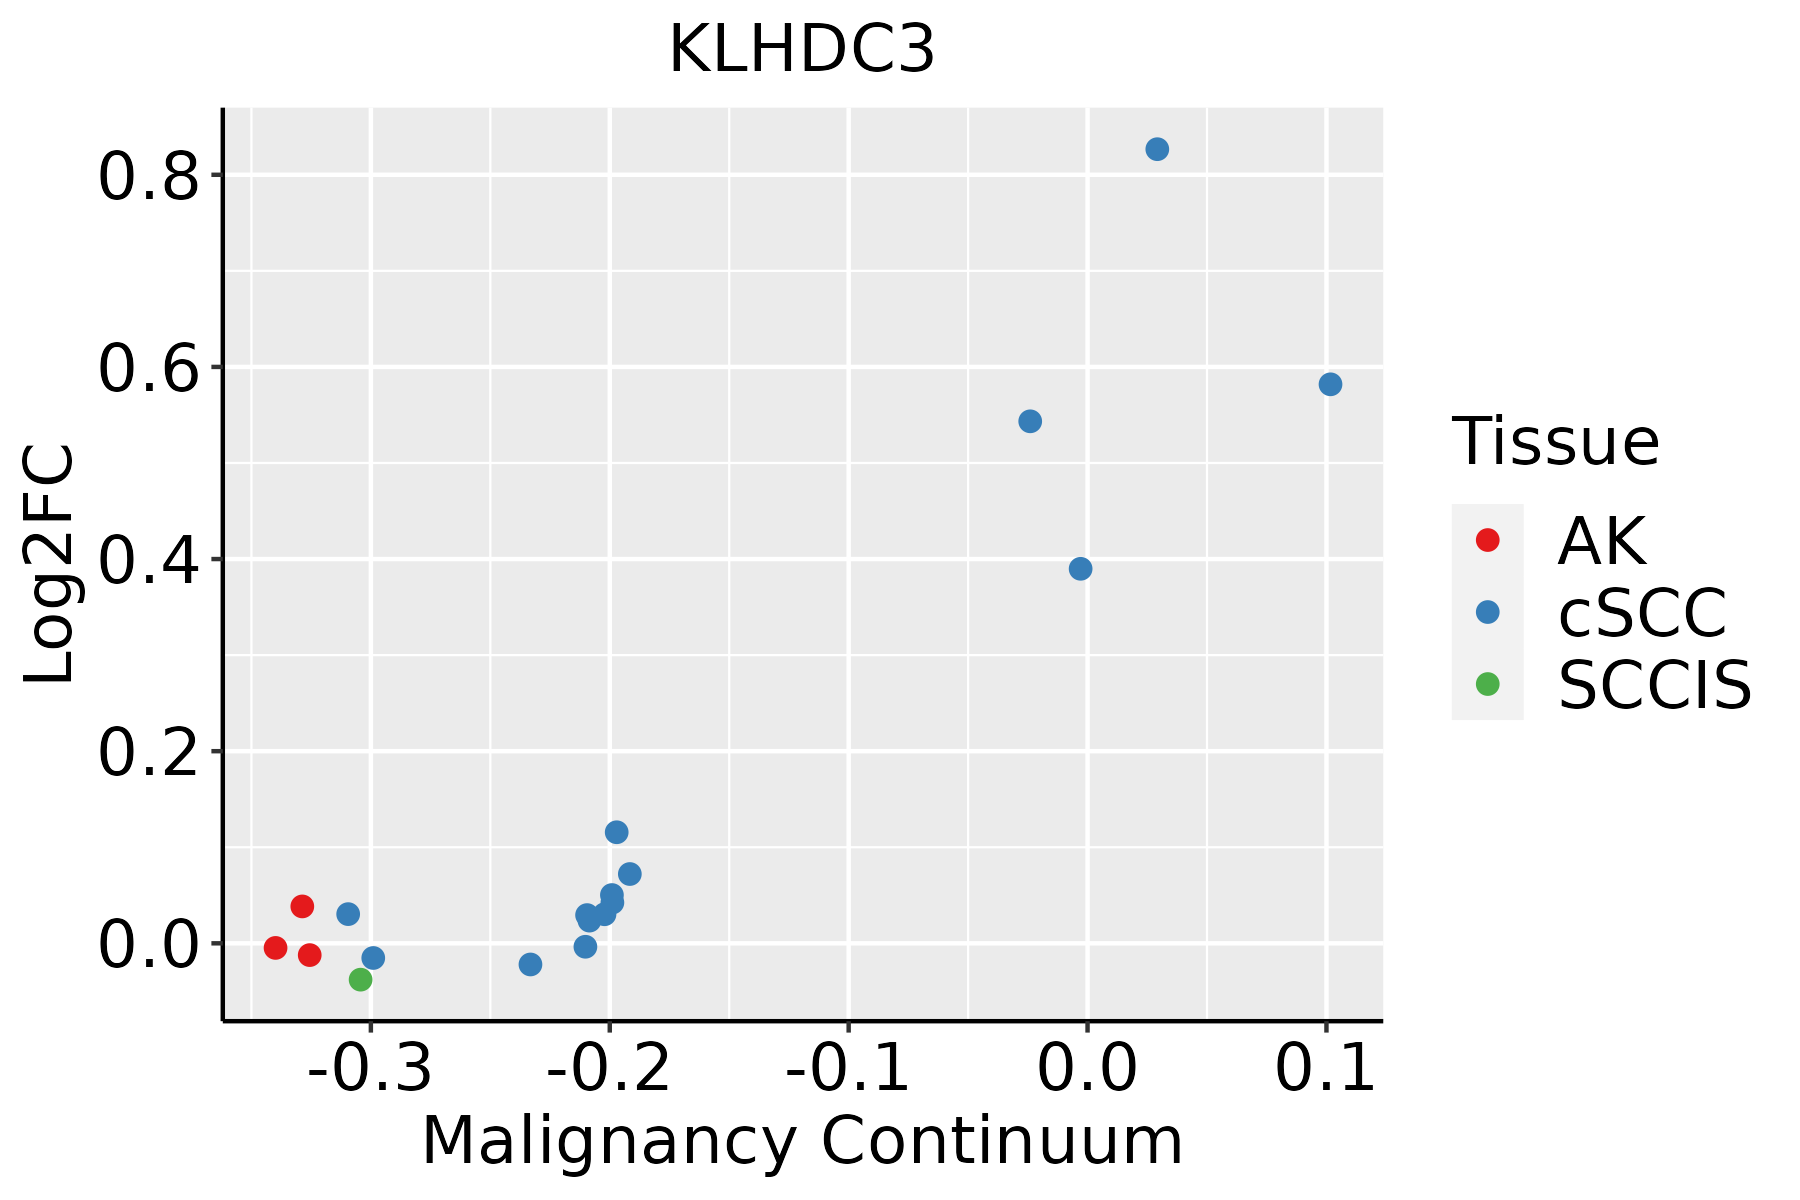 | AK: Actinic keratosis |
| cSCC: Cutaneous squamous cell carcinoma | ||
| SCCIS:squamous cell carcinoma in situ | ||
| Thyroid |  | ATC: Anaplastic thyroid cancer |
| HT: Hashimoto's thyroiditis | ||
| PTC: Papillary thyroid cancer |
| ∗log2FC in expression of this searched gene in stem-like cells from each diseased tissue sample relative to stem-like cells in normal samples in each tissue plotted against the malignancy continuum. Samples are colored based on if they are from different disease stage. |
Top |
Malignant transformation related pathway analysis |
| Find out the enriched GO biological processes and KEGG pathways involved in transition from healthy to precancer to cancer |
| Tissue | Disease Stage | Enriched GO biological Processes |
| Colorectum | AD |  |
| Colorectum | SER |  |
| Colorectum | MSS |  |
| Colorectum | MSI-H |  |
| Colorectum | FAP |  |
| ∗Top 15 enriched GO BP terms are showed in the bar plot of each disease state in each tissue. Each row represents a significant GO biological process which is colored according to the -log10(p.adjust). |
| Page: 1 2 3 4 5 6 7 8 9 |
| GO ID | Tissue | Disease Stage | Description | Gene Ratio | Bg Ratio | pvalue | p.adjust | Count |
| GO:0010498 | Colorectum | AD | proteasomal protein catabolic process | 174/3918 | 490/18723 | 3.18e-14 | 7.66e-12 | 174 |
| GO:0043161 | Colorectum | AD | proteasome-mediated ubiquitin-dependent protein catabolic process | 141/3918 | 412/18723 | 1.77e-10 | 1.68e-08 | 141 |
| GO:00104981 | Colorectum | SER | proteasomal protein catabolic process | 132/2897 | 490/18723 | 3.08e-11 | 5.55e-09 | 132 |
| GO:00431611 | Colorectum | SER | proteasome-mediated ubiquitin-dependent protein catabolic process | 105/2897 | 412/18723 | 7.48e-08 | 4.70e-06 | 105 |
| GO:00104982 | Colorectum | MSS | proteasomal protein catabolic process | 157/3467 | 490/18723 | 2.39e-13 | 5.25e-11 | 157 |
| GO:00431612 | Colorectum | MSS | proteasome-mediated ubiquitin-dependent protein catabolic process | 127/3467 | 412/18723 | 7.70e-10 | 6.32e-08 | 127 |
| GO:0010498111 | Esophagus | ESCC | proteasomal protein catabolic process | 369/8552 | 490/18723 | 1.13e-41 | 1.80e-38 | 369 |
| GO:0043161111 | Esophagus | ESCC | proteasome-mediated ubiquitin-dependent protein catabolic process | 312/8552 | 412/18723 | 3.53e-36 | 4.48e-33 | 312 |
| GO:00482853 | Esophagus | ESCC | organelle fission | 301/8552 | 488/18723 | 4.64e-13 | 2.12e-11 | 301 |
| GO:00002802 | Esophagus | ESCC | nuclear division | 270/8552 | 439/18723 | 1.17e-11 | 4.24e-10 | 270 |
| GO:00063101 | Esophagus | ESCC | DNA recombination | 168/8552 | 305/18723 | 5.58e-04 | 3.05e-03 | 168 |
| GO:001049812 | Liver | Cirrhotic | proteasomal protein catabolic process | 216/4634 | 490/18723 | 2.52e-21 | 9.29e-19 | 216 |
| GO:004316112 | Liver | Cirrhotic | proteasome-mediated ubiquitin-dependent protein catabolic process | 184/4634 | 412/18723 | 4.52e-19 | 8.85e-17 | 184 |
| GO:001049822 | Liver | HCC | proteasomal protein catabolic process | 351/7958 | 490/18723 | 6.92e-40 | 1.46e-36 | 351 |
| GO:004316122 | Liver | HCC | proteasome-mediated ubiquitin-dependent protein catabolic process | 299/7958 | 412/18723 | 7.82e-36 | 8.27e-33 | 299 |
| GO:0048285 | Liver | HCC | organelle fission | 254/7958 | 488/18723 | 1.07e-05 | 1.23e-04 | 254 |
| GO:0000280 | Liver | HCC | nuclear division | 220/7958 | 439/18723 | 6.90e-04 | 4.25e-03 | 220 |
| GO:001049820 | Oral cavity | OSCC | proteasomal protein catabolic process | 336/7305 | 490/18723 | 5.45e-41 | 8.63e-38 | 336 |
| GO:004316120 | Oral cavity | OSCC | proteasome-mediated ubiquitin-dependent protein catabolic process | 285/7305 | 412/18723 | 5.68e-36 | 5.99e-33 | 285 |
| GO:00482852 | Oral cavity | OSCC | organelle fission | 265/7305 | 488/18723 | 3.22e-12 | 1.27e-10 | 265 |
| Page: 1 2 |
| Pathway ID | Tissue | Disease Stage | Description | Gene Ratio | Bg Ratio | pvalue | p.adjust | qvalue | Count |
| Page: 1 |
Top |
Cell-cell communication analysis |
| Identification of potential cell-cell interactions between two cell types and their ligand-receptor pairs for different disease states |
| Ligand | Receptor | LRpair | Pathway | Tissue | Disease Stage |
| Page: 1 |
Top |
Single-cell gene regulatory network inference analysis |
| Find out the significant the regulons (TFs) and the target genes of each regulon across cell types for different disease states |
| TF | Cell Type | Tissue | Disease Stage | Target Gene | RSS | Regulon Activity |
| ∗The dot plots of a searched regulon are shown for all cell subpopulations in each disease state of each tissue based on the regulon specific score inferred using pySCENIC and by calculating the average expression. |
| Page: 1 |
Top |
Somatic mutation of malignant transformation related genes |
| Annotation of somatic variants for genes involved in malignant transformation |
| Hugo Symbol | Variant Class | Variant Classification | dbSNP RS | HGVSc | HGVSp | HGVSp Short | SWISSPROT | BIOTYPE | SIFT | PolyPhen | Tumor Sample Barcode | Tissue | Histology | Sex | Age | Stage | Therapy Types | Drugs | Outcome |
| KLHDC3 | SNV | Missense_Mutation | c.850A>C | p.Lys284Gln | p.K284Q | Q9BQ90 | protein_coding | tolerated(0.4) | benign(0.007) | TCGA-AO-A0J6-01 | Breast | breast invasive carcinoma | Female | <65 | I/II | Chemotherapy | doxorubicin | SD | |
| KLHDC3 | SNV | Missense_Mutation | c.964N>C | p.Asp322His | p.D322H | Q9BQ90 | protein_coding | tolerated(0.12) | benign(0.076) | TCGA-E2-A1LH-01 | Breast | breast invasive carcinoma | Female | <65 | I/II | Chemotherapy | adriamycin | SD | |
| KLHDC3 | deletion | Frame_Shift_Del | novel | c.46delN | p.Asn16ThrfsTer29 | p.N16Tfs*29 | Q9BQ90 | protein_coding | TCGA-EW-A2FV-01 | Breast | breast invasive carcinoma | Female | <65 | III/IV | Chemotherapy | docetaxel | SD | ||
| KLHDC3 | SNV | Missense_Mutation | novel | c.997G>A | p.Asp333Asn | p.D333N | Q9BQ90 | protein_coding | deleterious(0) | probably_damaging(0.996) | TCGA-2W-A8YY-01 | Cervix | cervical & endocervical cancer | Female | <65 | I/II | Chemotherapy | cisplatin | CR |
| KLHDC3 | SNV | Missense_Mutation | c.298G>C | p.Gly100Arg | p.G100R | Q9BQ90 | protein_coding | deleterious(0.01) | probably_damaging(0.994) | TCGA-C5-A1MJ-01 | Cervix | cervical & endocervical cancer | Female | <65 | I/II | Unknown | Unknown | SD | |
| KLHDC3 | SNV | Missense_Mutation | novel | c.928A>C | p.Ser310Arg | p.S310R | Q9BQ90 | protein_coding | tolerated(0.07) | probably_damaging(0.999) | TCGA-VS-A9UT-01 | Cervix | cervical & endocervical cancer | Female | >=65 | I/II | Unknown | Unknown | SD |
| KLHDC3 | SNV | Missense_Mutation | novel | c.409G>T | p.Gly137Cys | p.G137C | Q9BQ90 | protein_coding | deleterious(0.01) | possibly_damaging(0.8) | TCGA-AA-3950-01 | Colorectum | colon adenocarcinoma | Female | >=65 | I/II | Unknown | Unknown | SD |
| KLHDC3 | SNV | Missense_Mutation | c.730G>T | p.Ala244Ser | p.A244S | Q9BQ90 | protein_coding | deleterious(0.04) | possibly_damaging(0.674) | TCGA-G4-6626-01 | Colorectum | colon adenocarcinoma | Male | >=65 | I/II | Unknown | Unknown | SD | |
| KLHDC3 | deletion | Frame_Shift_Del | c.401delN | p.Cys134LeufsTer3 | p.C134Lfs*3 | Q9BQ90 | protein_coding | TCGA-CK-5916-01 | Colorectum | colon adenocarcinoma | Female | >=65 | I/II | Unknown | Unknown | PD | |||
| KLHDC3 | SNV | Missense_Mutation | novel | c.125N>A | p.Arg42His | p.R42H | Q9BQ90 | protein_coding | tolerated(0.06) | possibly_damaging(0.462) | TCGA-A5-A1OF-01 | Endometrium | uterine corpus endometrioid carcinoma | Female | <65 | I/II | Unknown | Unknown | SD |
| Page: 1 2 3 4 |
Top |
Related drugs of malignant transformation related genes |
| Identification of chemicals and drugs interact with genes involved in malignant transfromation |
| (DGIdb 4.0) |
| Entrez ID | Symbol | Category | Interaction Types | Drug Claim Name | Drug Name | PMIDs |
| Page: 1 |

Copyright 2023-Present -The University of Texas Health Science Center at Houston |