
|
|||||
|
 | |
| |
| |
| |
| |
| |
|
Gene: KLHDC2 |
Gene summary for KLHDC2 |
| Gene information | Species | Human | Gene symbol | KLHDC2 | Gene ID | 23588 |
| Gene name | kelch domain containing 2 | |
| Gene Alias | HCLP-1 | |
| Cytomap | 14q21.3 | |
| Gene Type | protein-coding | GO ID | GO:0006464 | UniProtAcc | Q9Y2U9 |
Top |
Malignant transformation analysis |
| Identification of the aberrant gene expression in precancerous and cancerous lesions by comparing the gene expression of stem-like cells in diseased tissues with normal stem cells |
| Entrez ID | Symbol | Replicates | Species | Organ | Tissue | Adj P-value | Log2FC | Malignancy |
| 23588 | KLHDC2 | LZE4T | Human | Esophagus | ESCC | 1.37e-18 | 5.15e-01 | 0.0811 |
| 23588 | KLHDC2 | LZE5T | Human | Esophagus | ESCC | 1.70e-08 | 6.36e-01 | 0.0514 |
| 23588 | KLHDC2 | LZE20T | Human | Esophagus | ESCC | 1.10e-08 | 5.41e-01 | 0.0662 |
| 23588 | KLHDC2 | LZE22D1 | Human | Esophagus | HGIN | 6.11e-06 | 3.18e-01 | 0.0595 |
| 23588 | KLHDC2 | LZE22T | Human | Esophagus | ESCC | 9.47e-05 | 6.36e-01 | 0.068 |
| 23588 | KLHDC2 | LZE24T | Human | Esophagus | ESCC | 1.62e-25 | 8.19e-01 | 0.0596 |
| 23588 | KLHDC2 | P1T-E | Human | Esophagus | ESCC | 6.55e-14 | 8.10e-01 | 0.0875 |
| 23588 | KLHDC2 | P2T-E | Human | Esophagus | ESCC | 1.33e-33 | 6.06e-01 | 0.1177 |
| 23588 | KLHDC2 | P4T-E | Human | Esophagus | ESCC | 7.84e-25 | 5.18e-01 | 0.1323 |
| 23588 | KLHDC2 | P5T-E | Human | Esophagus | ESCC | 5.13e-16 | 5.04e-01 | 0.1327 |
| 23588 | KLHDC2 | P8T-E | Human | Esophagus | ESCC | 4.08e-50 | 9.90e-01 | 0.0889 |
| 23588 | KLHDC2 | P9T-E | Human | Esophagus | ESCC | 1.87e-09 | 2.62e-01 | 0.1131 |
| 23588 | KLHDC2 | P10T-E | Human | Esophagus | ESCC | 2.65e-49 | 1.03e+00 | 0.116 |
| 23588 | KLHDC2 | P11T-E | Human | Esophagus | ESCC | 5.09e-22 | 8.50e-01 | 0.1426 |
| 23588 | KLHDC2 | P12T-E | Human | Esophagus | ESCC | 1.04e-37 | 8.39e-01 | 0.1122 |
| 23588 | KLHDC2 | P15T-E | Human | Esophagus | ESCC | 3.27e-53 | 1.21e+00 | 0.1149 |
| 23588 | KLHDC2 | P16T-E | Human | Esophagus | ESCC | 2.12e-29 | 5.84e-01 | 0.1153 |
| 23588 | KLHDC2 | P17T-E | Human | Esophagus | ESCC | 6.85e-09 | 5.69e-01 | 0.1278 |
| 23588 | KLHDC2 | P19T-E | Human | Esophagus | ESCC | 3.14e-04 | 4.72e-01 | 0.1662 |
| 23588 | KLHDC2 | P20T-E | Human | Esophagus | ESCC | 1.64e-22 | 4.83e-01 | 0.1124 |
| Page: 1 2 3 4 5 6 7 |
| Tissue | Expression Dynamics | Abbreviation |
| Esophagus | 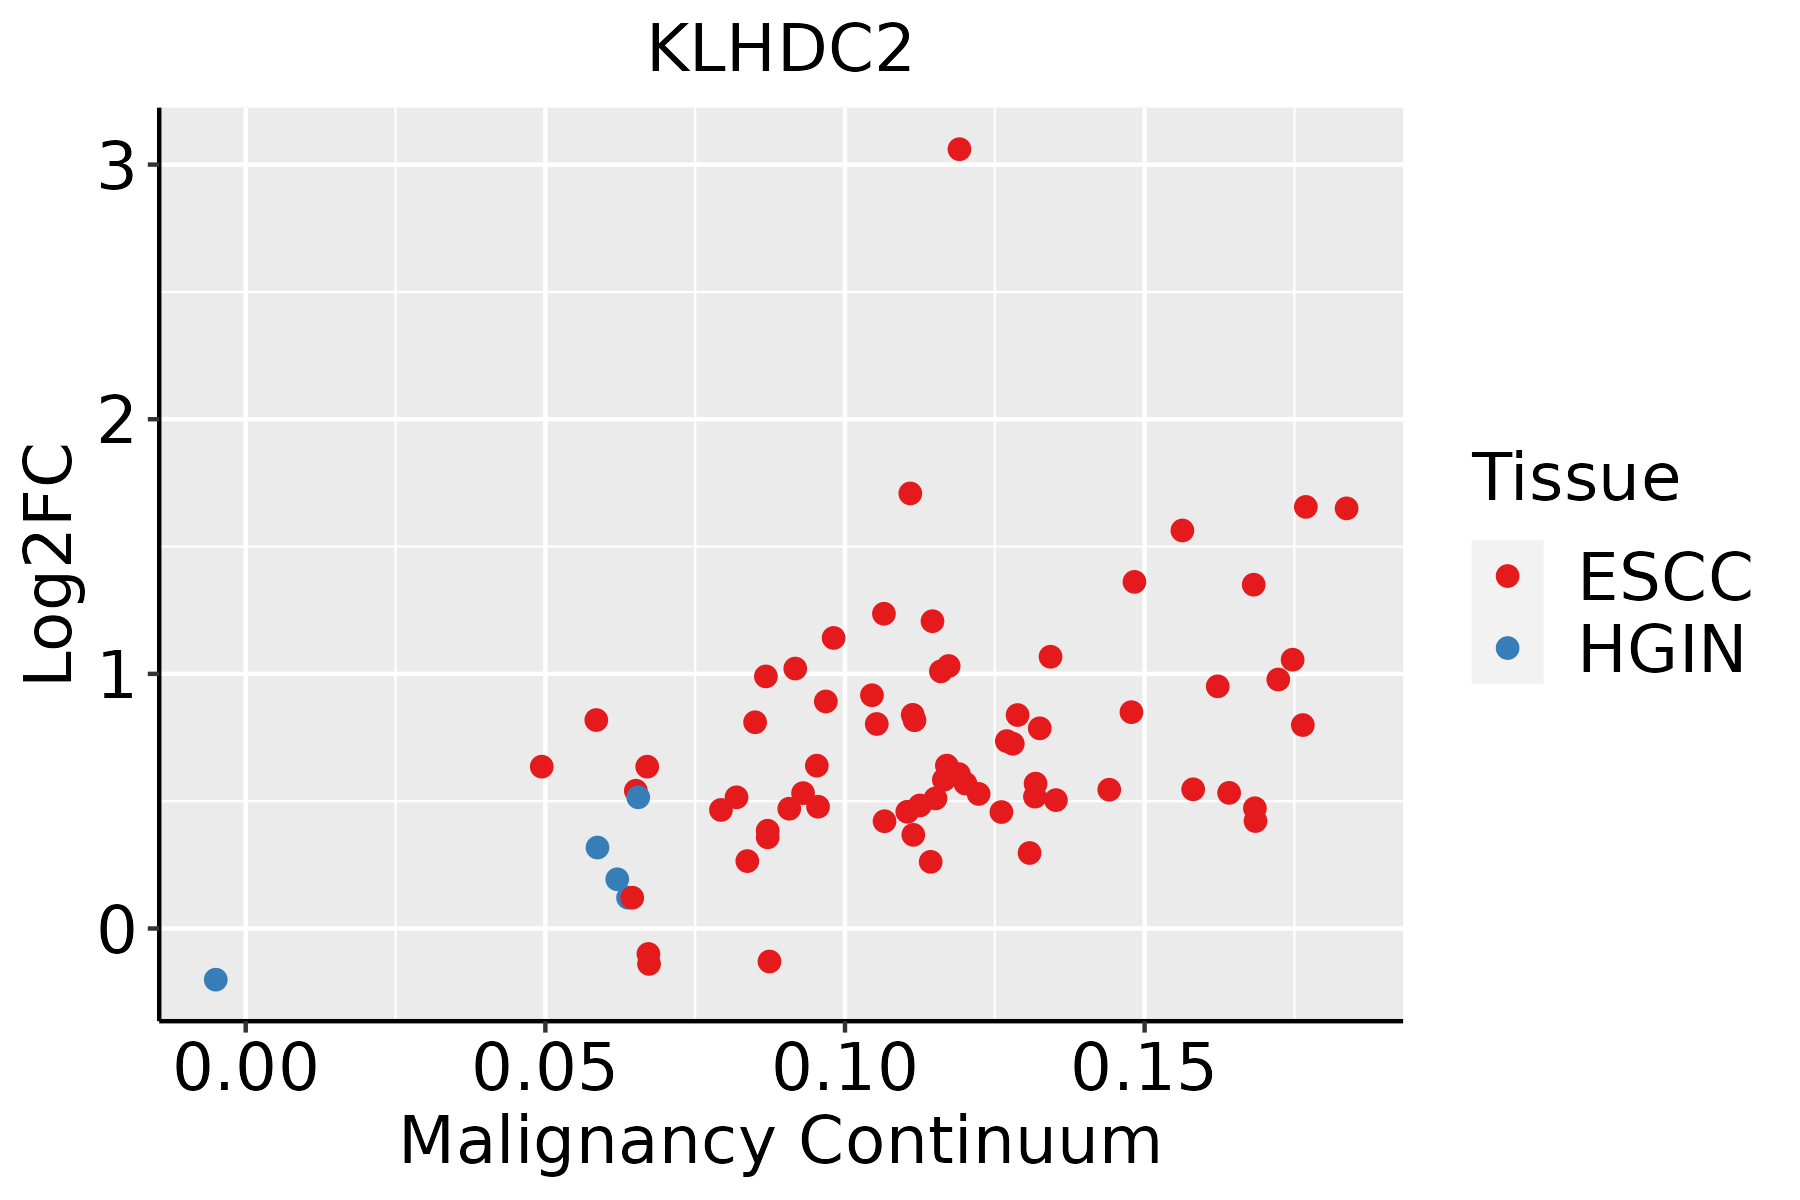 | ESCC: Esophageal squamous cell carcinoma |
| HGIN: High-grade intraepithelial neoplasias | ||
| LGIN: Low-grade intraepithelial neoplasias | ||
| Liver |  | HCC: Hepatocellular carcinoma |
| NAFLD: Non-alcoholic fatty liver disease | ||
| Oral Cavity |  | EOLP: Erosive Oral lichen planus |
| LP: leukoplakia | ||
| NEOLP: Non-erosive oral lichen planus | ||
| OSCC: Oral squamous cell carcinoma | ||
| Prostate | 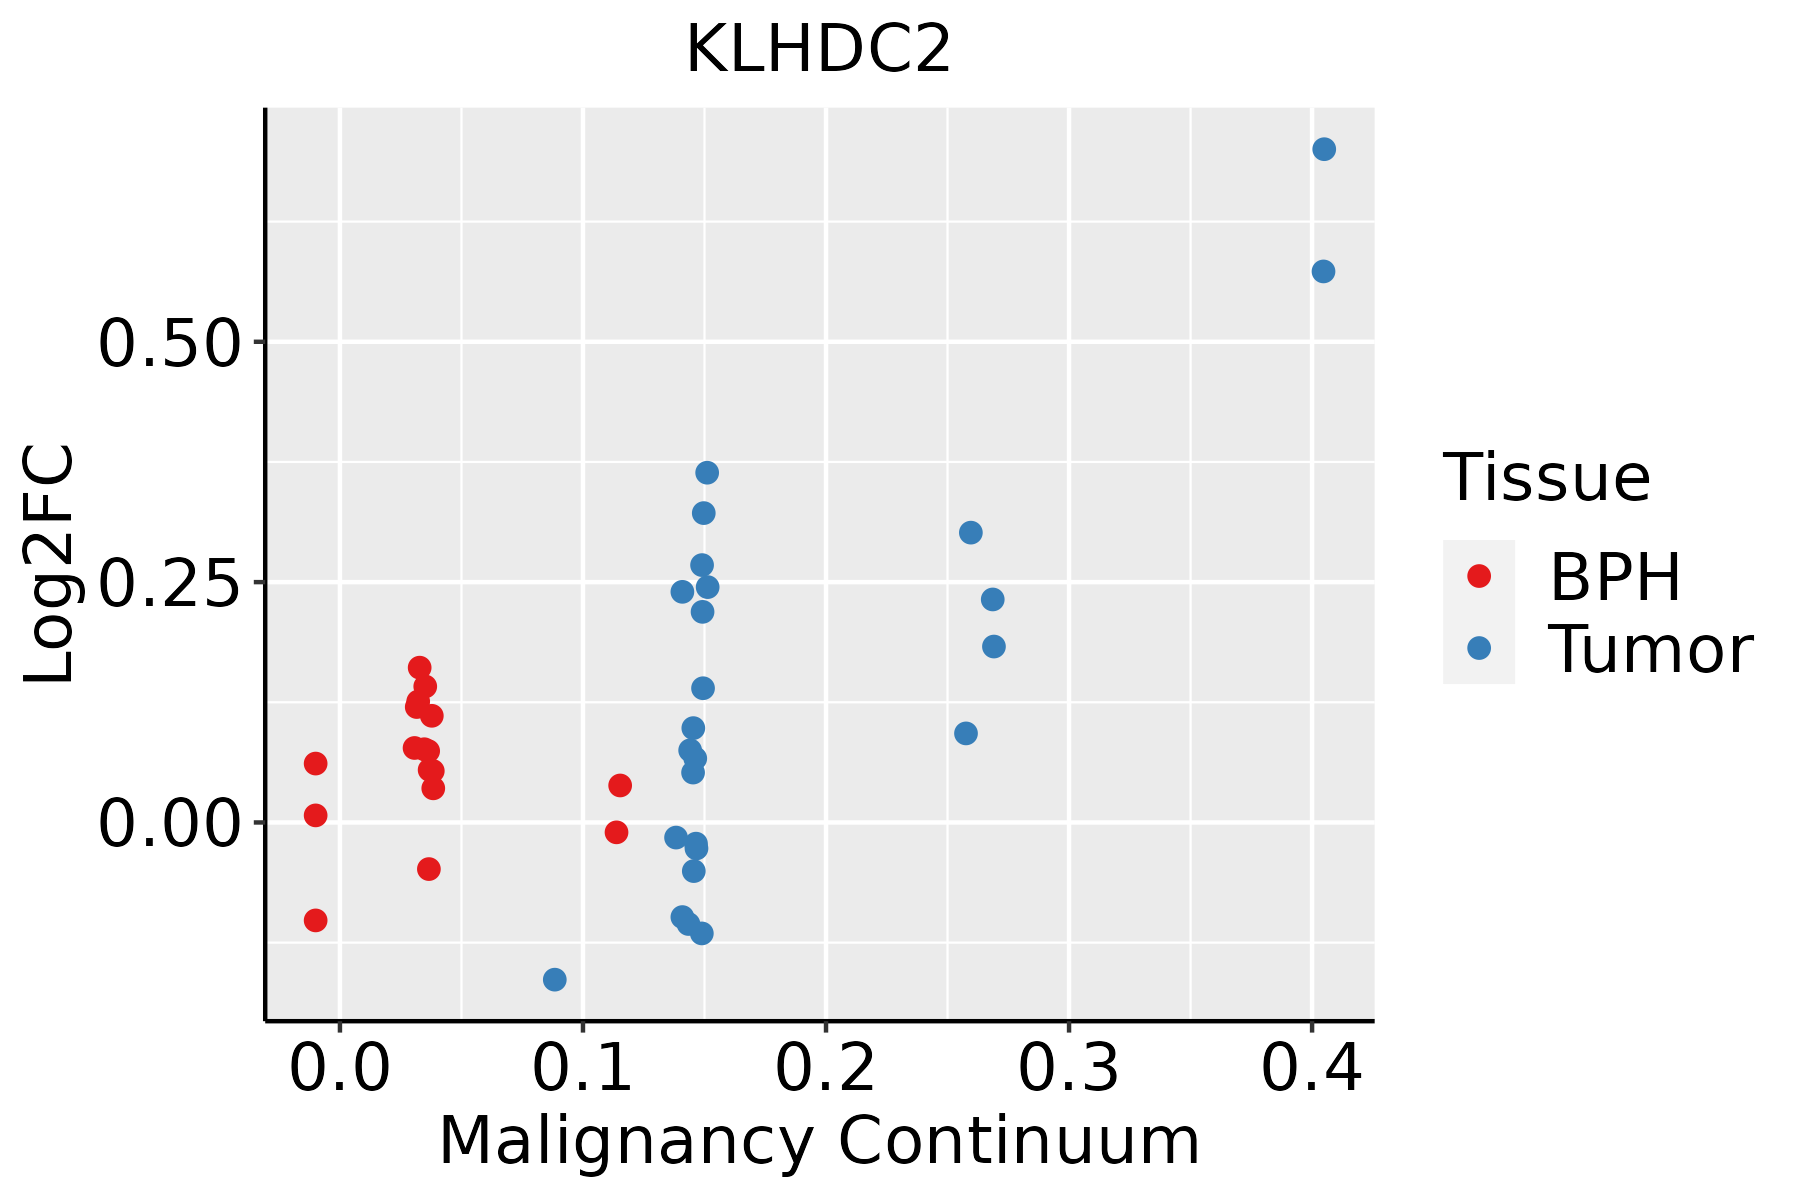 | BPH: Benign Prostatic Hyperplasia |
| Skin |  | AK: Actinic keratosis |
| cSCC: Cutaneous squamous cell carcinoma | ||
| SCCIS:squamous cell carcinoma in situ | ||
| Thyroid | 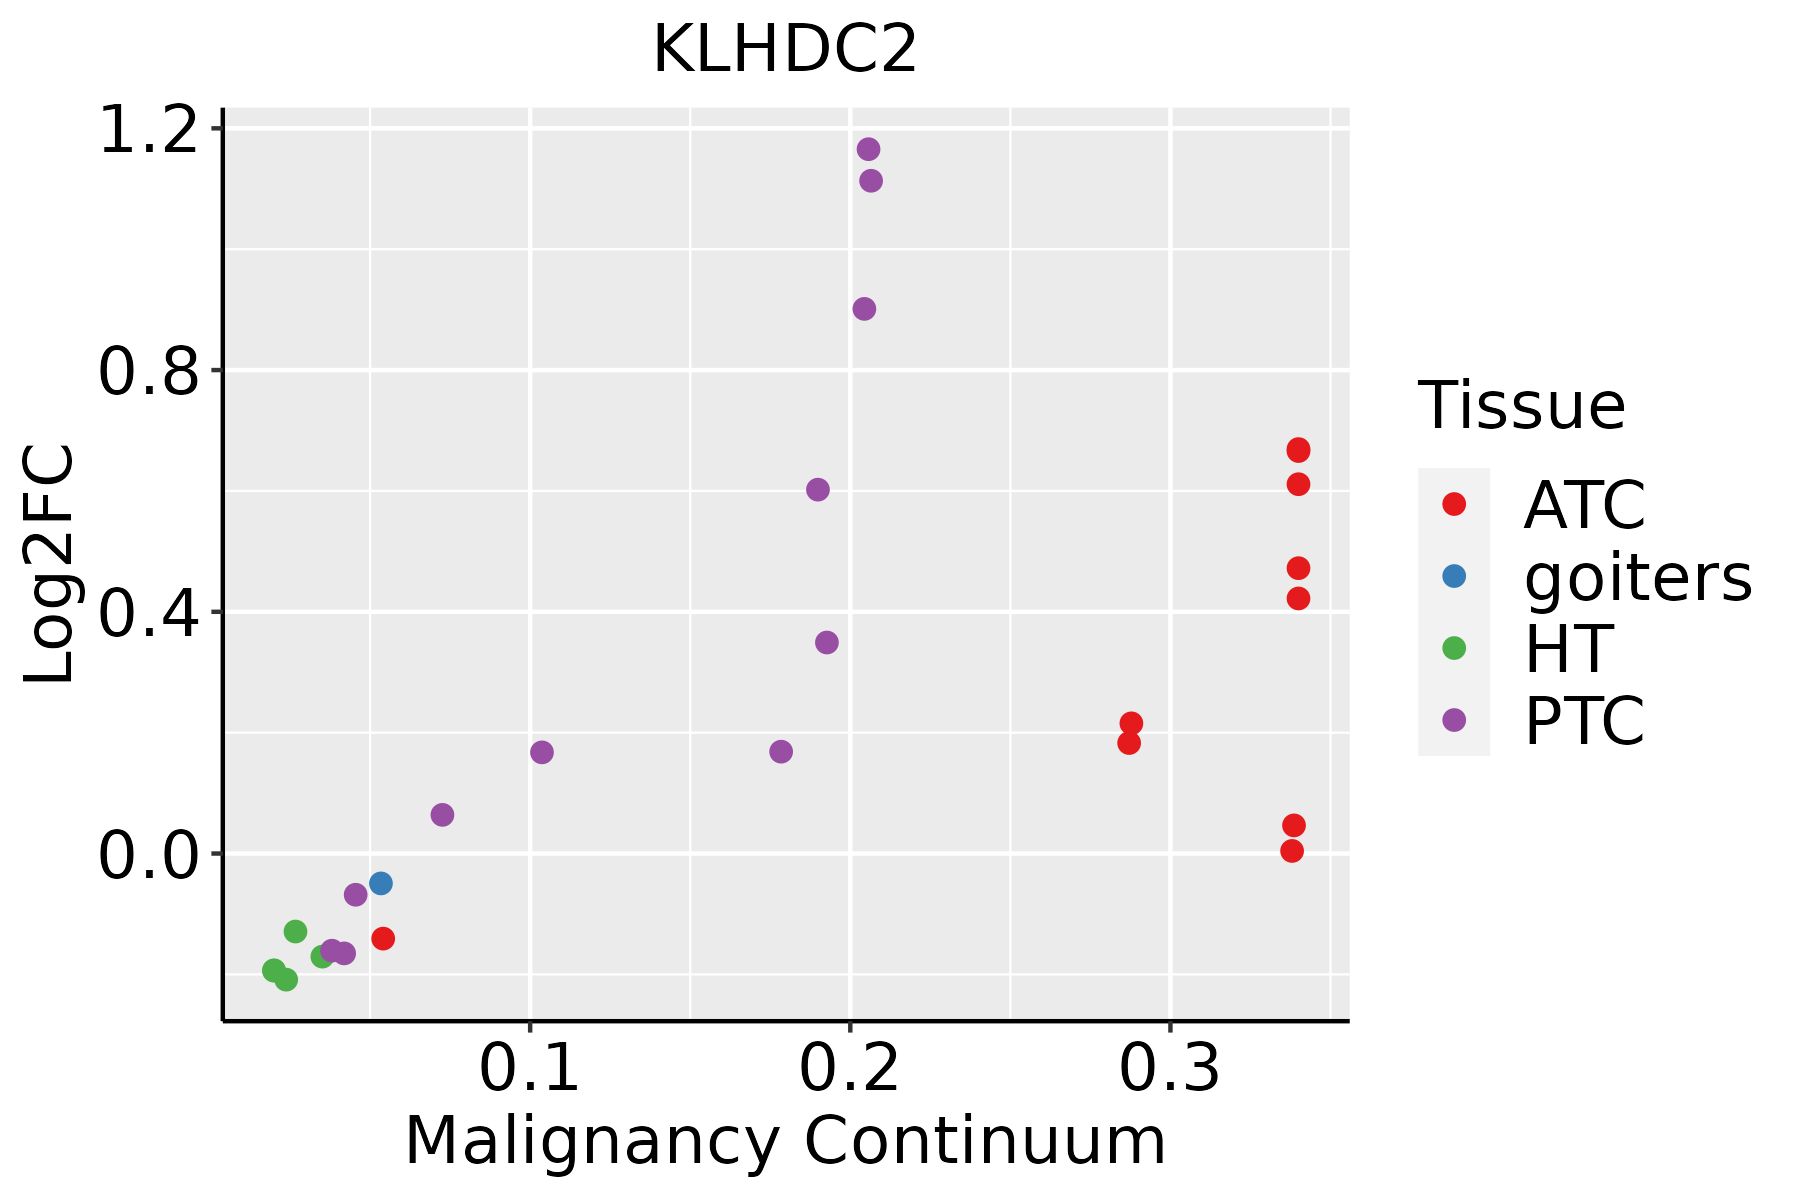 | ATC: Anaplastic thyroid cancer |
| HT: Hashimoto's thyroiditis | ||
| PTC: Papillary thyroid cancer |
| ∗log2FC in expression of this searched gene in stem-like cells from each diseased tissue sample relative to stem-like cells in normal samples in each tissue plotted against the malignancy continuum. Samples are colored based on if they are from different disease stage. |
Top |
Malignant transformation related pathway analysis |
| Find out the enriched GO biological processes and KEGG pathways involved in transition from healthy to precancer to cancer |
| Tissue | Disease Stage | Enriched GO biological Processes |
| Colorectum | AD |  |
| Colorectum | SER |  |
| Colorectum | MSS |  |
| Colorectum | MSI-H |  |
| Colorectum | FAP |  |
| ∗Top 15 enriched GO BP terms are showed in the bar plot of each disease state in each tissue. Each row represents a significant GO biological process which is colored according to the -log10(p.adjust). |
| Page: 1 2 3 4 5 6 7 8 9 |
| GO ID | Tissue | Disease Stage | Description | Gene Ratio | Bg Ratio | pvalue | p.adjust | Count |
| GO:001049826 | Esophagus | HGIN | proteasomal protein catabolic process | 139/2587 | 490/18723 | 1.20e-17 | 3.41e-15 | 139 |
| GO:004316126 | Esophagus | HGIN | proteasome-mediated ubiquitin-dependent protein catabolic process | 114/2587 | 412/18723 | 7.00e-14 | 1.20e-11 | 114 |
| GO:0010498111 | Esophagus | ESCC | proteasomal protein catabolic process | 369/8552 | 490/18723 | 1.13e-41 | 1.80e-38 | 369 |
| GO:0043161111 | Esophagus | ESCC | proteasome-mediated ubiquitin-dependent protein catabolic process | 312/8552 | 412/18723 | 3.53e-36 | 4.48e-33 | 312 |
| GO:001049812 | Liver | Cirrhotic | proteasomal protein catabolic process | 216/4634 | 490/18723 | 2.52e-21 | 9.29e-19 | 216 |
| GO:004316112 | Liver | Cirrhotic | proteasome-mediated ubiquitin-dependent protein catabolic process | 184/4634 | 412/18723 | 4.52e-19 | 8.85e-17 | 184 |
| GO:001049822 | Liver | HCC | proteasomal protein catabolic process | 351/7958 | 490/18723 | 6.92e-40 | 1.46e-36 | 351 |
| GO:004316122 | Liver | HCC | proteasome-mediated ubiquitin-dependent protein catabolic process | 299/7958 | 412/18723 | 7.82e-36 | 8.27e-33 | 299 |
| GO:001049820 | Oral cavity | OSCC | proteasomal protein catabolic process | 336/7305 | 490/18723 | 5.45e-41 | 8.63e-38 | 336 |
| GO:004316120 | Oral cavity | OSCC | proteasome-mediated ubiquitin-dependent protein catabolic process | 285/7305 | 412/18723 | 5.68e-36 | 5.99e-33 | 285 |
| GO:0010498110 | Oral cavity | LP | proteasomal protein catabolic process | 224/4623 | 490/18723 | 9.57e-25 | 4.00e-22 | 224 |
| GO:0043161110 | Oral cavity | LP | proteasome-mediated ubiquitin-dependent protein catabolic process | 190/4623 | 412/18723 | 1.08e-21 | 2.93e-19 | 190 |
| GO:001049819 | Prostate | Tumor | proteasomal protein catabolic process | 158/3246 | 490/18723 | 3.05e-16 | 6.76e-14 | 158 |
| GO:004316119 | Prostate | Tumor | proteasome-mediated ubiquitin-dependent protein catabolic process | 130/3246 | 412/18723 | 7.97e-13 | 8.00e-11 | 130 |
| GO:001049828 | Skin | cSCC | proteasomal protein catabolic process | 243/4864 | 490/18723 | 7.85e-30 | 4.10e-27 | 243 |
| GO:004316128 | Skin | cSCC | proteasome-mediated ubiquitin-dependent protein catabolic process | 205/4864 | 412/18723 | 1.46e-25 | 4.16e-23 | 205 |
| GO:0010498113 | Thyroid | PTC | proteasomal protein catabolic process | 297/5968 | 490/18723 | 4.58e-40 | 9.63e-37 | 297 |
| GO:0043161113 | Thyroid | PTC | proteasome-mediated ubiquitin-dependent protein catabolic process | 254/5968 | 412/18723 | 3.91e-36 | 4.54e-33 | 254 |
| GO:001049832 | Thyroid | ATC | proteasomal protein catabolic process | 309/6293 | 490/18723 | 1.78e-41 | 1.13e-37 | 309 |
| GO:0043161210 | Thyroid | ATC | proteasome-mediated ubiquitin-dependent protein catabolic process | 265/6293 | 412/18723 | 7.09e-38 | 1.49e-34 | 265 |
| Page: 1 |
| Pathway ID | Tissue | Disease Stage | Description | Gene Ratio | Bg Ratio | pvalue | p.adjust | qvalue | Count |
| Page: 1 |
Top |
Cell-cell communication analysis |
| Identification of potential cell-cell interactions between two cell types and their ligand-receptor pairs for different disease states |
| Ligand | Receptor | LRpair | Pathway | Tissue | Disease Stage |
| Page: 1 |
Top |
Single-cell gene regulatory network inference analysis |
| Find out the significant the regulons (TFs) and the target genes of each regulon across cell types for different disease states |
| TF | Cell Type | Tissue | Disease Stage | Target Gene | RSS | Regulon Activity |
| ∗The dot plots of a searched regulon are shown for all cell subpopulations in each disease state of each tissue based on the regulon specific score inferred using pySCENIC and by calculating the average expression. |
| Page: 1 |
Top |
Somatic mutation of malignant transformation related genes |
| Annotation of somatic variants for genes involved in malignant transformation |
| Hugo Symbol | Variant Class | Variant Classification | dbSNP RS | HGVSc | HGVSp | HGVSp Short | SWISSPROT | BIOTYPE | SIFT | PolyPhen | Tumor Sample Barcode | Tissue | Histology | Sex | Age | Stage | Therapy Types | Drugs | Outcome |
| KLHDC2 | insertion | Frame_Shift_Ins | novel | c.558_559insTTAG | p.His187LeufsTer8 | p.H187Lfs*8 | Q9Y2U9 | protein_coding | TCGA-AR-A0U0-01 | Breast | breast invasive carcinoma | Female | >=65 | I/II | Unknown | Unknown | SD | ||
| KLHDC2 | SNV | Missense_Mutation | c.739N>A | p.Tyr247Asn | p.Y247N | Q9Y2U9 | protein_coding | deleterious(0.01) | benign(0.188) | TCGA-A6-6781-01 | Colorectum | colon adenocarcinoma | Male | <65 | III/IV | Chemotherapy | oxaliplatin | SD | |
| KLHDC2 | SNV | Missense_Mutation | c.991N>A | p.Glu331Lys | p.E331K | Q9Y2U9 | protein_coding | deleterious(0.03) | probably_damaging(0.971) | TCGA-AA-3872-01 | Colorectum | colon adenocarcinoma | Male | <65 | III/IV | Unknown | Unknown | SD | |
| KLHDC2 | SNV | Missense_Mutation | novel | c.1108N>A | p.Glu370Lys | p.E370K | Q9Y2U9 | protein_coding | deleterious(0) | probably_damaging(0.971) | TCGA-AA-3872-01 | Colorectum | colon adenocarcinoma | Male | <65 | III/IV | Unknown | Unknown | SD |
| KLHDC2 | SNV | Missense_Mutation | rs376066947 | c.62N>G | p.Tyr21Cys | p.Y21C | Q9Y2U9 | protein_coding | tolerated(0.17) | benign(0) | TCGA-AD-6964-01 | Colorectum | colon adenocarcinoma | Male | <65 | III/IV | Chemotherapy | folfox | PD |
| KLHDC2 | SNV | Missense_Mutation | c.722N>C | p.Arg241Thr | p.R241T | Q9Y2U9 | protein_coding | deleterious(0.02) | probably_damaging(0.966) | TCGA-NH-A6GA-01 | Colorectum | colon adenocarcinoma | Male | <65 | III/IV | Chemotherapy | oxaliplatin | PD | |
| KLHDC2 | SNV | Missense_Mutation | c.529N>G | p.Phe177Val | p.F177V | Q9Y2U9 | protein_coding | tolerated(1) | benign(0.357) | TCGA-AG-3892-01 | Colorectum | rectum adenocarcinoma | Female | <65 | I/II | Unknown | Unknown | SD | |
| KLHDC2 | insertion | Frame_Shift_Ins | novel | c.926_927insGAGAGTAT | p.Phe310ArgfsTer26 | p.F310Rfs*26 | Q9Y2U9 | protein_coding | TCGA-AM-5820-01 | Colorectum | colon adenocarcinoma | Female | <65 | I/II | Unknown | Unknown | SD | ||
| KLHDC2 | SNV | Missense_Mutation | novel | c.715G>A | p.Asp239Asn | p.D239N | Q9Y2U9 | protein_coding | tolerated(0.22) | benign(0.006) | TCGA-A5-A0G2-01 | Endometrium | uterine corpus endometrioid carcinoma | Female | <65 | III/IV | Unknown | Unknown | SD |
| KLHDC2 | SNV | Missense_Mutation | rs746017180 | c.656N>T | p.Ala219Val | p.A219V | Q9Y2U9 | protein_coding | deleterious(0) | probably_damaging(0.998) | TCGA-AP-A0LD-01 | Endometrium | uterine corpus endometrioid carcinoma | Female | <65 | I/II | Unknown | Unknown | SD |
| Page: 1 2 3 |
Top |
Related drugs of malignant transformation related genes |
| Identification of chemicals and drugs interact with genes involved in malignant transfromation |
| (DGIdb 4.0) |
| Entrez ID | Symbol | Category | Interaction Types | Drug Claim Name | Drug Name | PMIDs |
| Page: 1 |

Copyright 2023-Present -The University of Texas Health Science Center at Houston |