
|
|||||
|
 | |
| |
| |
| |
| |
| |
|
Gene: KLHDC10 |
Gene summary for KLHDC10 |
| Gene information | Species | Human | Gene symbol | KLHDC10 | Gene ID | 23008 |
| Gene name | kelch domain containing 10 | |
| Gene Alias | slim | |
| Cytomap | 7q32.2 | |
| Gene Type | protein-coding | GO ID | GO:0000165 | UniProtAcc | Q6PID8 |
Top |
Malignant transformation analysis |
| Identification of the aberrant gene expression in precancerous and cancerous lesions by comparing the gene expression of stem-like cells in diseased tissues with normal stem cells |
| Entrez ID | Symbol | Replicates | Species | Organ | Tissue | Adj P-value | Log2FC | Malignancy |
| 23008 | KLHDC10 | HTA11_347_2000001011 | Human | Colorectum | AD | 1.56e-08 | 5.98e-01 | -0.1954 |
| 23008 | KLHDC10 | F007 | Human | Colorectum | FAP | 1.69e-06 | -4.48e-01 | 0.1176 |
| 23008 | KLHDC10 | A001-C-207 | Human | Colorectum | FAP | 8.92e-12 | -4.60e-01 | 0.1278 |
| 23008 | KLHDC10 | A015-C-203 | Human | Colorectum | FAP | 4.58e-26 | -5.04e-01 | -0.1294 |
| 23008 | KLHDC10 | A015-C-204 | Human | Colorectum | FAP | 9.96e-11 | -4.57e-01 | -0.0228 |
| 23008 | KLHDC10 | A014-C-040 | Human | Colorectum | FAP | 3.31e-06 | -5.48e-01 | -0.1184 |
| 23008 | KLHDC10 | A002-C-201 | Human | Colorectum | FAP | 8.53e-19 | -4.80e-01 | 0.0324 |
| 23008 | KLHDC10 | A001-C-119 | Human | Colorectum | FAP | 2.19e-04 | -2.36e-01 | -0.1557 |
| 23008 | KLHDC10 | A001-C-108 | Human | Colorectum | FAP | 2.01e-19 | -4.97e-01 | -0.0272 |
| 23008 | KLHDC10 | A002-C-205 | Human | Colorectum | FAP | 2.69e-21 | -3.97e-01 | -0.1236 |
| 23008 | KLHDC10 | A014-C-108 | Human | Colorectum | FAP | 3.28e-03 | -4.06e-01 | -0.124 |
| 23008 | KLHDC10 | A001-C-104 | Human | Colorectum | FAP | 7.93e-07 | -3.74e-01 | 0.0184 |
| 23008 | KLHDC10 | A015-C-005 | Human | Colorectum | FAP | 1.02e-07 | -3.65e-01 | -0.0336 |
| 23008 | KLHDC10 | A015-C-006 | Human | Colorectum | FAP | 5.69e-20 | -6.40e-01 | -0.0994 |
| 23008 | KLHDC10 | A015-C-106 | Human | Colorectum | FAP | 3.09e-18 | -4.36e-01 | -0.0511 |
| 23008 | KLHDC10 | A002-C-114 | Human | Colorectum | FAP | 2.67e-21 | -5.29e-01 | -0.1561 |
| 23008 | KLHDC10 | A015-C-104 | Human | Colorectum | FAP | 1.63e-29 | -5.48e-01 | -0.1899 |
| 23008 | KLHDC10 | A001-C-014 | Human | Colorectum | FAP | 8.15e-16 | -5.04e-01 | 0.0135 |
| 23008 | KLHDC10 | A002-C-016 | Human | Colorectum | FAP | 2.33e-20 | -4.69e-01 | 0.0521 |
| 23008 | KLHDC10 | A015-C-002 | Human | Colorectum | FAP | 3.05e-16 | -6.54e-01 | -0.0763 |
| Page: 1 2 3 4 5 |
| Tissue | Expression Dynamics | Abbreviation |
| Colorectum (GSE201348) |  | FAP: Familial adenomatous polyposis |
| CRC: Colorectal cancer | ||
| Colorectum (HTA11) |  | AD: Adenomas |
| SER: Sessile serrated lesions | ||
| MSI-H: Microsatellite-high colorectal cancer | ||
| MSS: Microsatellite stable colorectal cancer | ||
| Liver |  | HCC: Hepatocellular carcinoma |
| NAFLD: Non-alcoholic fatty liver disease | ||
| Lung |  | AAH: Atypical adenomatous hyperplasia |
| AIS: Adenocarcinoma in situ | ||
| IAC: Invasive lung adenocarcinoma | ||
| MIA: Minimally invasive adenocarcinoma | ||
| Prostate | 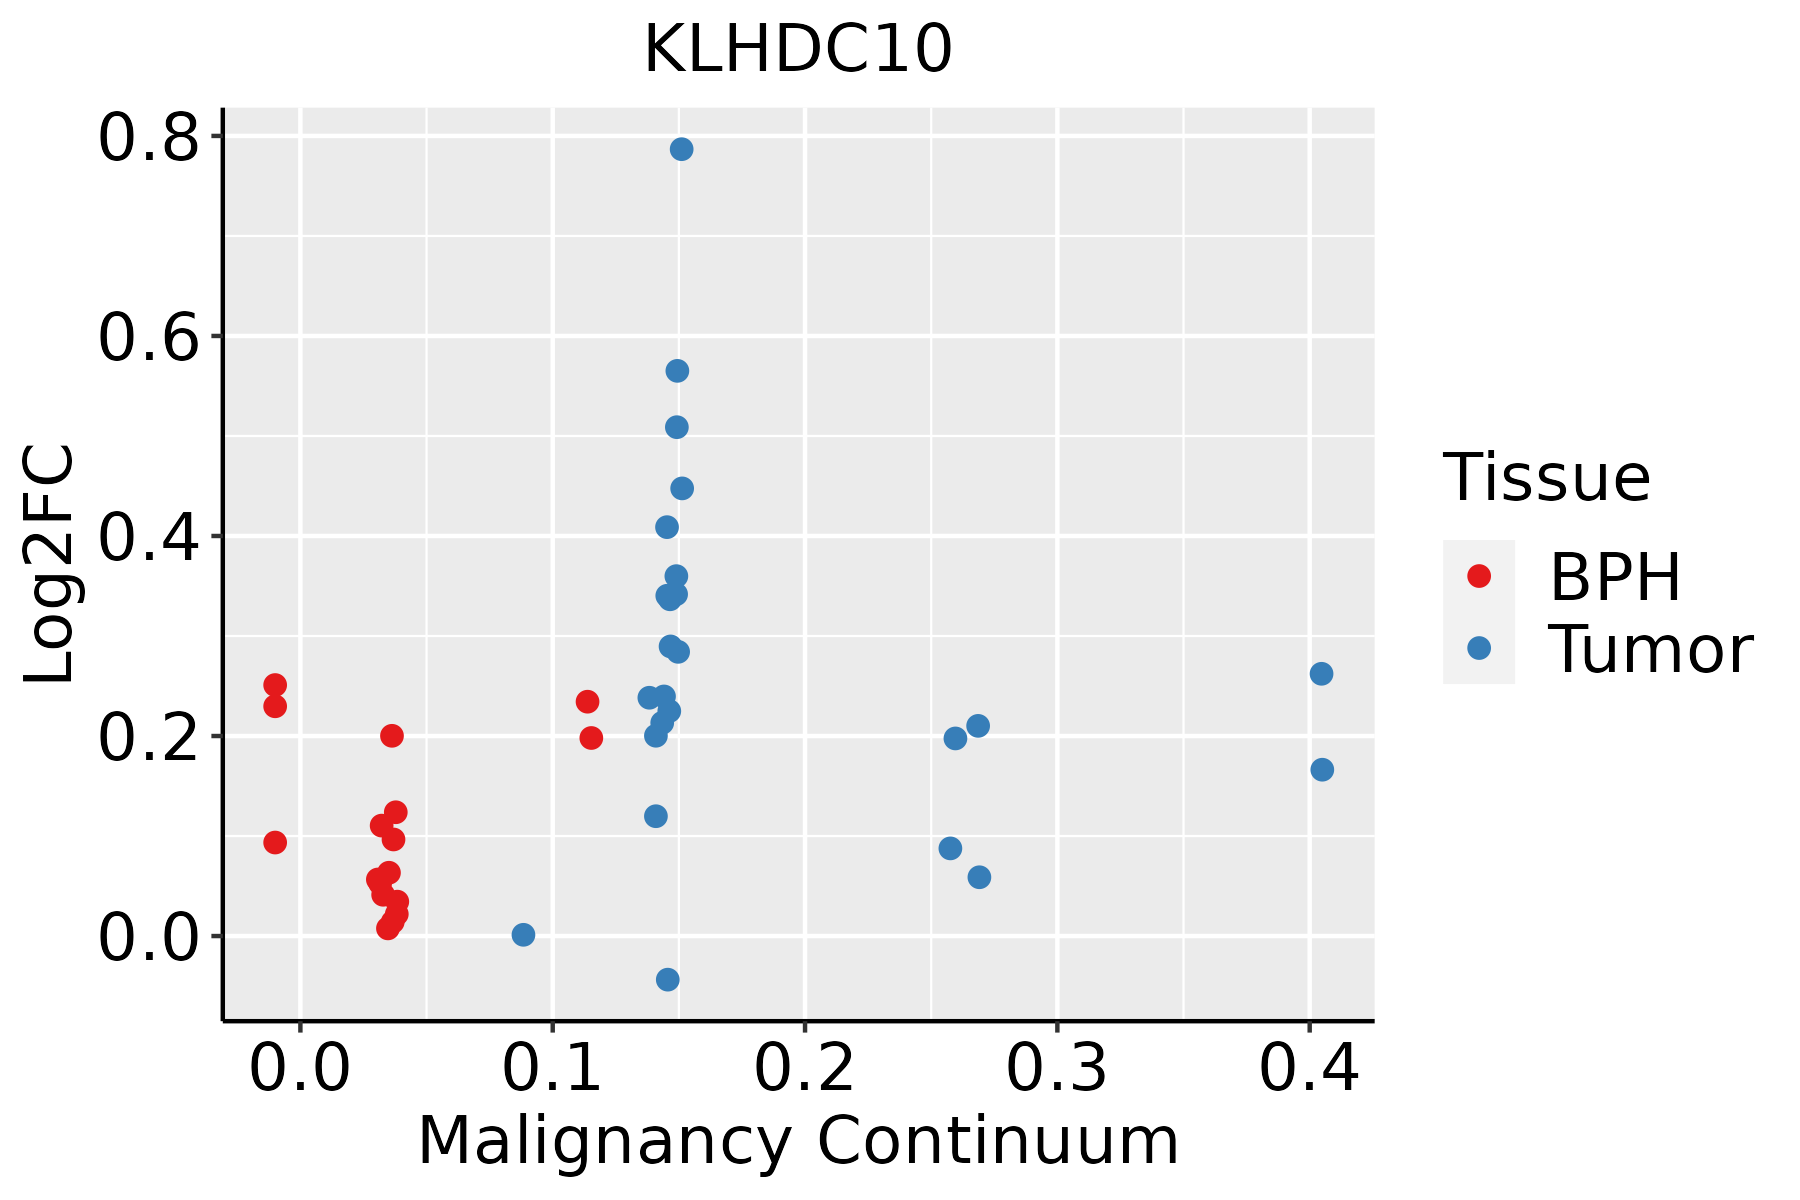 | BPH: Benign Prostatic Hyperplasia |
| Thyroid |  | ATC: Anaplastic thyroid cancer |
| HT: Hashimoto's thyroiditis | ||
| PTC: Papillary thyroid cancer |
| ∗log2FC in expression of this searched gene in stem-like cells from each diseased tissue sample relative to stem-like cells in normal samples in each tissue plotted against the malignancy continuum. Samples are colored based on if they are from different disease stage. |
Top |
Malignant transformation related pathway analysis |
| Find out the enriched GO biological processes and KEGG pathways involved in transition from healthy to precancer to cancer |
| Tissue | Disease Stage | Enriched GO biological Processes |
| Colorectum | AD |  |
| Colorectum | SER |  |
| Colorectum | MSS |  |
| Colorectum | MSI-H |  |
| Colorectum | FAP |  |
| ∗Top 15 enriched GO BP terms are showed in the bar plot of each disease state in each tissue. Each row represents a significant GO biological process which is colored according to the -log10(p.adjust). |
| Page: 1 2 3 4 5 6 7 8 9 |
| GO ID | Tissue | Disease Stage | Description | Gene Ratio | Bg Ratio | pvalue | p.adjust | Count |
| GO:0010498 | Colorectum | AD | proteasomal protein catabolic process | 174/3918 | 490/18723 | 3.18e-14 | 7.66e-12 | 174 |
| GO:0043161 | Colorectum | AD | proteasome-mediated ubiquitin-dependent protein catabolic process | 141/3918 | 412/18723 | 1.77e-10 | 1.68e-08 | 141 |
| GO:0051403 | Colorectum | AD | stress-activated MAPK cascade | 72/3918 | 239/18723 | 4.77e-04 | 5.25e-03 | 72 |
| GO:0031098 | Colorectum | AD | stress-activated protein kinase signaling cascade | 74/3918 | 247/18723 | 4.80e-04 | 5.27e-03 | 74 |
| GO:0070302 | Colorectum | AD | regulation of stress-activated protein kinase signaling cascade | 58/3918 | 195/18723 | 2.21e-03 | 1.74e-02 | 58 |
| GO:0032872 | Colorectum | AD | regulation of stress-activated MAPK cascade | 57/3918 | 192/18723 | 2.51e-03 | 1.92e-02 | 57 |
| GO:00431614 | Colorectum | FAP | proteasome-mediated ubiquitin-dependent protein catabolic process | 98/2622 | 412/18723 | 5.41e-08 | 4.20e-06 | 98 |
| GO:00104984 | Colorectum | FAP | proteasomal protein catabolic process | 110/2622 | 490/18723 | 2.12e-07 | 1.26e-05 | 110 |
| GO:00310983 | Colorectum | FAP | stress-activated protein kinase signaling cascade | 61/2622 | 247/18723 | 4.79e-06 | 1.57e-04 | 61 |
| GO:00514033 | Colorectum | FAP | stress-activated MAPK cascade | 59/2622 | 239/18723 | 6.90e-06 | 2.11e-04 | 59 |
| GO:00703022 | Colorectum | FAP | regulation of stress-activated protein kinase signaling cascade | 48/2622 | 195/18723 | 5.14e-05 | 1.04e-03 | 48 |
| GO:00328722 | Colorectum | FAP | regulation of stress-activated MAPK cascade | 47/2622 | 192/18723 | 7.08e-05 | 1.32e-03 | 47 |
| GO:0070304 | Colorectum | FAP | positive regulation of stress-activated protein kinase signaling cascade | 31/2622 | 128/18723 | 1.35e-03 | 1.24e-02 | 31 |
| GO:0032874 | Colorectum | FAP | positive regulation of stress-activated MAPK cascade | 30/2622 | 126/18723 | 2.13e-03 | 1.76e-02 | 30 |
| GO:00310984 | Colorectum | CRC | stress-activated protein kinase signaling cascade | 51/2078 | 247/18723 | 8.35e-06 | 3.00e-04 | 51 |
| GO:00514034 | Colorectum | CRC | stress-activated MAPK cascade | 49/2078 | 239/18723 | 1.52e-05 | 4.69e-04 | 49 |
| GO:00703023 | Colorectum | CRC | regulation of stress-activated protein kinase signaling cascade | 41/2078 | 195/18723 | 3.99e-05 | 9.63e-04 | 41 |
| GO:00328723 | Colorectum | CRC | regulation of stress-activated MAPK cascade | 40/2078 | 192/18723 | 6.11e-05 | 1.35e-03 | 40 |
| GO:00431615 | Colorectum | CRC | proteasome-mediated ubiquitin-dependent protein catabolic process | 69/2078 | 412/18723 | 3.16e-04 | 4.90e-03 | 69 |
| GO:00104985 | Colorectum | CRC | proteasomal protein catabolic process | 77/2078 | 490/18723 | 1.03e-03 | 1.21e-02 | 77 |
| Page: 1 2 3 4 |
| Pathway ID | Tissue | Disease Stage | Description | Gene Ratio | Bg Ratio | pvalue | p.adjust | qvalue | Count |
| Page: 1 |
Top |
Cell-cell communication analysis |
| Identification of potential cell-cell interactions between two cell types and their ligand-receptor pairs for different disease states |
| Ligand | Receptor | LRpair | Pathway | Tissue | Disease Stage |
| Page: 1 |
Top |
Single-cell gene regulatory network inference analysis |
| Find out the significant the regulons (TFs) and the target genes of each regulon across cell types for different disease states |
| TF | Cell Type | Tissue | Disease Stage | Target Gene | RSS | Regulon Activity |
| ∗The dot plots of a searched regulon are shown for all cell subpopulations in each disease state of each tissue based on the regulon specific score inferred using pySCENIC and by calculating the average expression. |
| Page: 1 |
Top |
Somatic mutation of malignant transformation related genes |
| Annotation of somatic variants for genes involved in malignant transformation |
| Hugo Symbol | Variant Class | Variant Classification | dbSNP RS | HGVSc | HGVSp | HGVSp Short | SWISSPROT | BIOTYPE | SIFT | PolyPhen | Tumor Sample Barcode | Tissue | Histology | Sex | Age | Stage | Therapy Types | Drugs | Outcome |
| KLHDC10 | SNV | Missense_Mutation | c.626N>C | p.Gly209Ala | p.G209A | Q6PID8 | protein_coding | deleterious(0.01) | probably_damaging(0.999) | TCGA-A8-A09A-01 | Breast | breast invasive carcinoma | Female | <65 | I/II | Hormone Therapy | tamoxiphen | SD | |
| KLHDC10 | SNV | Missense_Mutation | c.643A>T | p.Ile215Phe | p.I215F | Q6PID8 | protein_coding | tolerated(0.7) | probably_damaging(0.943) | TCGA-AO-A0J9-01 | Breast | breast invasive carcinoma | Female | <65 | III/IV | Chemotherapy | cyclophosphamide | PD | |
| KLHDC10 | SNV | Missense_Mutation | novel | c.279N>G | p.Ser93Arg | p.S93R | Q6PID8 | protein_coding | deleterious(0) | probably_damaging(0.999) | TCGA-VS-A9UZ-01 | Cervix | cervical & endocervical cancer | Female | <65 | I/II | Unknown | Unknown | SD |
| KLHDC10 | deletion | Frame_Shift_Del | c.977delA | p.Asn326MetfsTer13 | p.N326Mfs*13 | Q6PID8 | protein_coding | TCGA-A6-6653-01 | Colorectum | colon adenocarcinoma | Male | >=65 | I/II | Unknown | Unknown | SD | |||
| KLHDC10 | deletion | Frame_Shift_Del | c.747_754delAAACAACC | p.Asn250IlefsTer3 | p.N250Ifs*3 | Q6PID8 | protein_coding | TCGA-D5-6532-01 | Colorectum | colon adenocarcinoma | Male | <65 | I/II | Unknown | Unknown | SD | |||
| KLHDC10 | SNV | Missense_Mutation | novel | c.320T>C | p.Phe107Ser | p.F107S | Q6PID8 | protein_coding | deleterious(0) | probably_damaging(0.977) | TCGA-A5-A0G2-01 | Endometrium | uterine corpus endometrioid carcinoma | Female | <65 | III/IV | Unknown | Unknown | SD |
| KLHDC10 | SNV | Missense_Mutation | novel | c.1180T>C | p.Ser394Pro | p.S394P | Q6PID8 | protein_coding | tolerated(0.07) | probably_damaging(0.915) | TCGA-A5-A0G2-01 | Endometrium | uterine corpus endometrioid carcinoma | Female | <65 | III/IV | Unknown | Unknown | SD |
| KLHDC10 | SNV | Missense_Mutation | c.224T>C | p.Ile75Thr | p.I75T | Q6PID8 | protein_coding | tolerated(0.36) | benign(0.011) | TCGA-AP-A051-01 | Endometrium | uterine corpus endometrioid carcinoma | Female | >=65 | I/II | Unknown | Unknown | SD | |
| KLHDC10 | SNV | Missense_Mutation | rs753525778 | c.1319N>A | p.Arg440His | p.R440H | Q6PID8 | protein_coding | deleterious(0) | probably_damaging(0.996) | TCGA-AX-A0J1-01 | Endometrium | uterine corpus endometrioid carcinoma | Female | >=65 | I/II | Unknown | Unknown | SD |
| KLHDC10 | SNV | Missense_Mutation | novel | c.692N>A | p.Ser231Asn | p.S231N | Q6PID8 | protein_coding | tolerated(0.21) | benign(0.054) | TCGA-AX-A1CE-01 | Endometrium | uterine corpus endometrioid carcinoma | Female | <65 | I/II | Unspecific | Paclitaxel | SD |
| Page: 1 2 3 4 |
Top |
Related drugs of malignant transformation related genes |
| Identification of chemicals and drugs interact with genes involved in malignant transfromation |
| (DGIdb 4.0) |
| Entrez ID | Symbol | Category | Interaction Types | Drug Claim Name | Drug Name | PMIDs |
| Page: 1 |

Copyright 2023-Present -The University of Texas Health Science Center at Houston |