
|
|||||
|
 | |
| |
| |
| |
| |
| |
|
Gene: KLF7 |
Gene summary for KLF7 |
| Gene information | Species | Human | Gene symbol | KLF7 | Gene ID | 8609 |
| Gene name | Kruppel like factor 7 | |
| Gene Alias | UKLF | |
| Cytomap | 2q33.3 | |
| Gene Type | protein-coding | GO ID | GO:0000122 | UniProtAcc | O75840 |
Top |
Malignant transformation analysis |
| Identification of the aberrant gene expression in precancerous and cancerous lesions by comparing the gene expression of stem-like cells in diseased tissues with normal stem cells |
| Entrez ID | Symbol | Replicates | Species | Organ | Tissue | Adj P-value | Log2FC | Malignancy |
| 8609 | KLF7 | CCI_2 | Human | Cervix | CC | 4.94e-12 | 1.02e+00 | 0.5249 |
| 8609 | KLF7 | CCI_3 | Human | Cervix | CC | 4.50e-06 | 5.19e-01 | 0.516 |
| 8609 | KLF7 | Tumor | Human | Cervix | CC | 1.23e-03 | 1.43e-01 | 0.1241 |
| 8609 | KLF7 | sample3 | Human | Cervix | CC | 6.11e-13 | 2.57e-01 | 0.1387 |
| 8609 | KLF7 | T3 | Human | Cervix | CC | 9.83e-06 | 2.49e-01 | 0.1389 |
| 8609 | KLF7 | LZE4T | Human | Esophagus | ESCC | 7.84e-08 | 2.46e-01 | 0.0811 |
| 8609 | KLF7 | P2T-E | Human | Esophagus | ESCC | 1.06e-03 | 4.73e-02 | 0.1177 |
| 8609 | KLF7 | P4T-E | Human | Esophagus | ESCC | 1.62e-08 | 2.08e-01 | 0.1323 |
| 8609 | KLF7 | P5T-E | Human | Esophagus | ESCC | 1.70e-15 | 3.69e-01 | 0.1327 |
| 8609 | KLF7 | P8T-E | Human | Esophagus | ESCC | 2.90e-13 | 2.25e-01 | 0.0889 |
| 8609 | KLF7 | P9T-E | Human | Esophagus | ESCC | 6.61e-05 | 1.44e-01 | 0.1131 |
| 8609 | KLF7 | P10T-E | Human | Esophagus | ESCC | 3.47e-11 | 1.99e-01 | 0.116 |
| 8609 | KLF7 | P11T-E | Human | Esophagus | ESCC | 9.31e-13 | 7.75e-01 | 0.1426 |
| 8609 | KLF7 | P12T-E | Human | Esophagus | ESCC | 4.67e-18 | 3.35e-01 | 0.1122 |
| 8609 | KLF7 | P15T-E | Human | Esophagus | ESCC | 2.60e-10 | 3.40e-01 | 0.1149 |
| 8609 | KLF7 | P16T-E | Human | Esophagus | ESCC | 4.91e-02 | -4.87e-03 | 0.1153 |
| 8609 | KLF7 | P17T-E | Human | Esophagus | ESCC | 3.26e-07 | 4.95e-01 | 0.1278 |
| 8609 | KLF7 | P20T-E | Human | Esophagus | ESCC | 1.51e-12 | 3.01e-01 | 0.1124 |
| 8609 | KLF7 | P21T-E | Human | Esophagus | ESCC | 7.36e-22 | 5.12e-01 | 0.1617 |
| 8609 | KLF7 | P22T-E | Human | Esophagus | ESCC | 3.65e-06 | 1.36e-01 | 0.1236 |
| Page: 1 2 3 4 5 |
| Tissue | Expression Dynamics | Abbreviation |
| Cervix |  | CC: Cervix cancer |
| HSIL_HPV: HPV-infected high-grade squamous intraepithelial lesions | ||
| N_HPV: HPV-infected normal cervix | ||
| Esophagus | 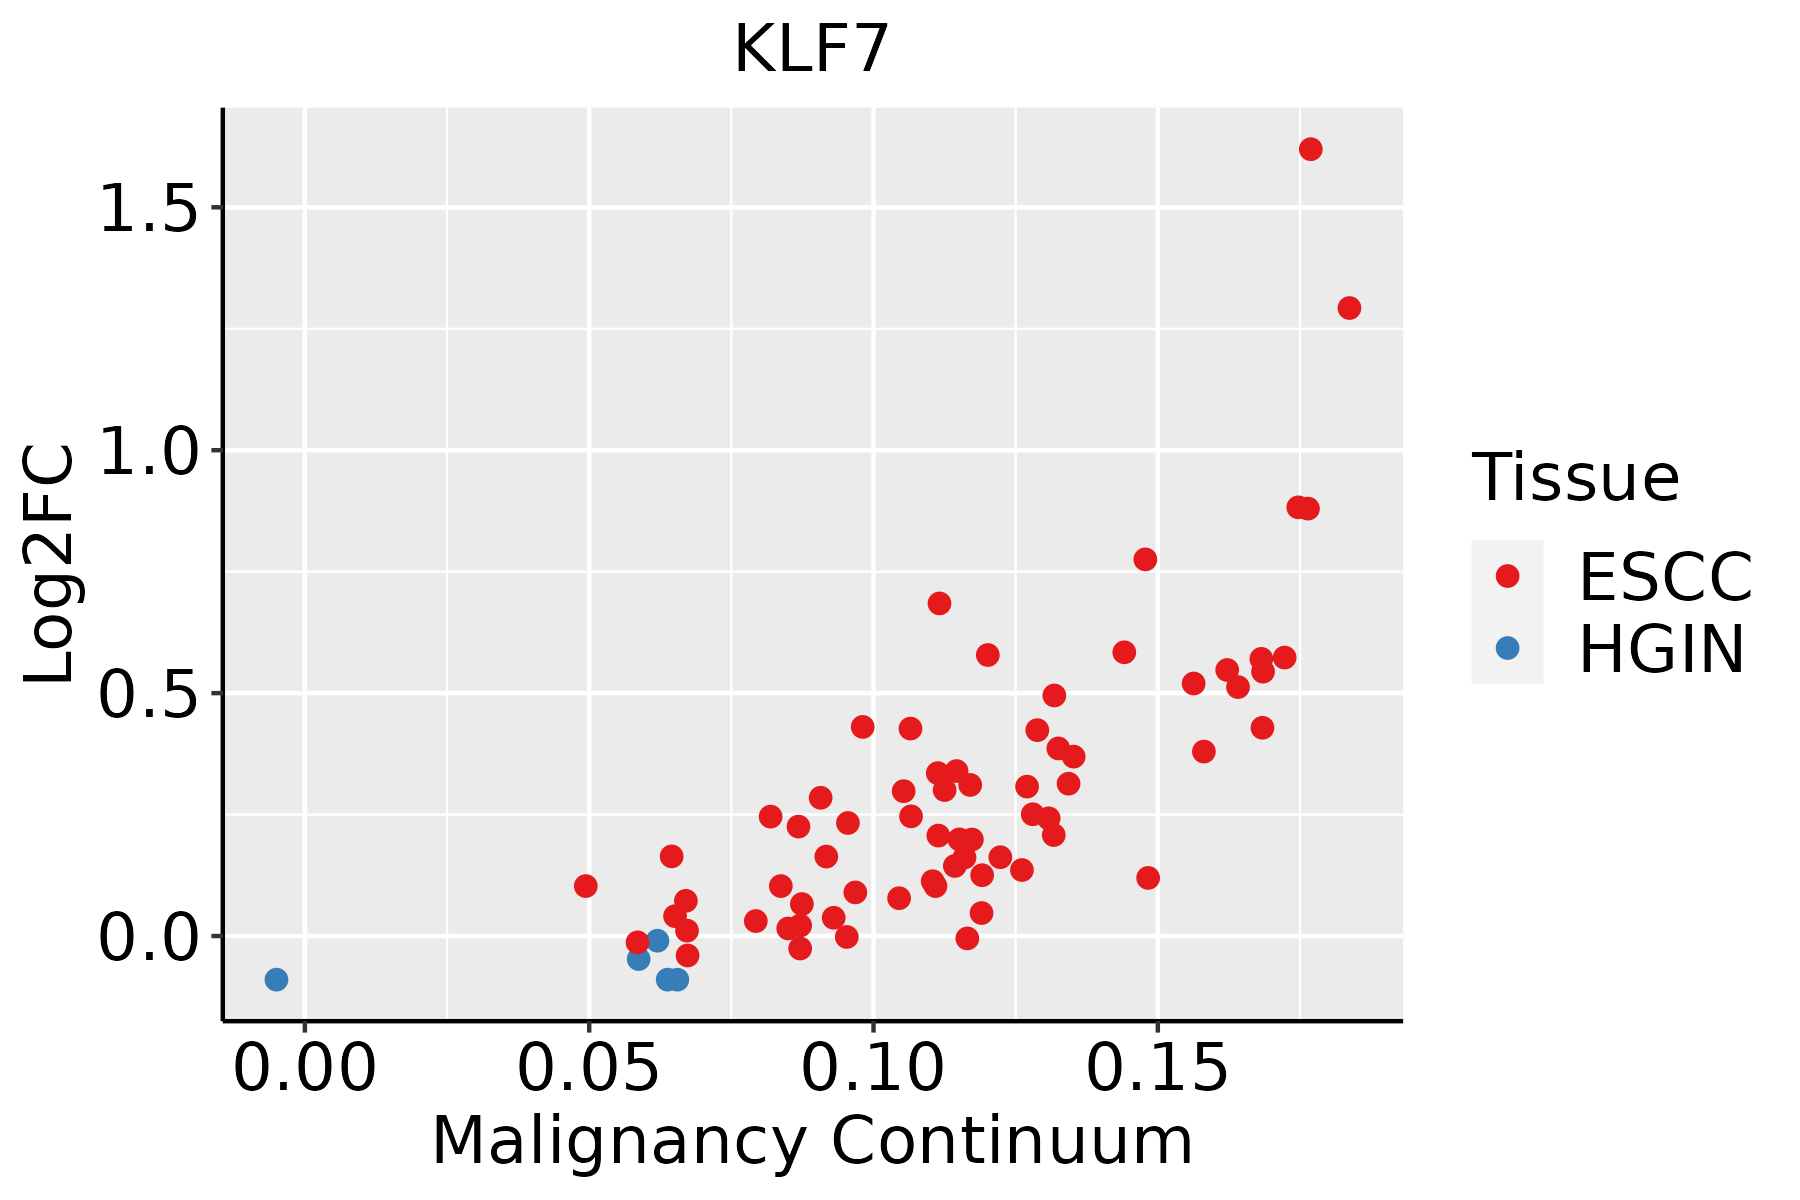 | ESCC: Esophageal squamous cell carcinoma |
| HGIN: High-grade intraepithelial neoplasias | ||
| LGIN: Low-grade intraepithelial neoplasias | ||
| Liver |  | HCC: Hepatocellular carcinoma |
| NAFLD: Non-alcoholic fatty liver disease | ||
| Oral Cavity | 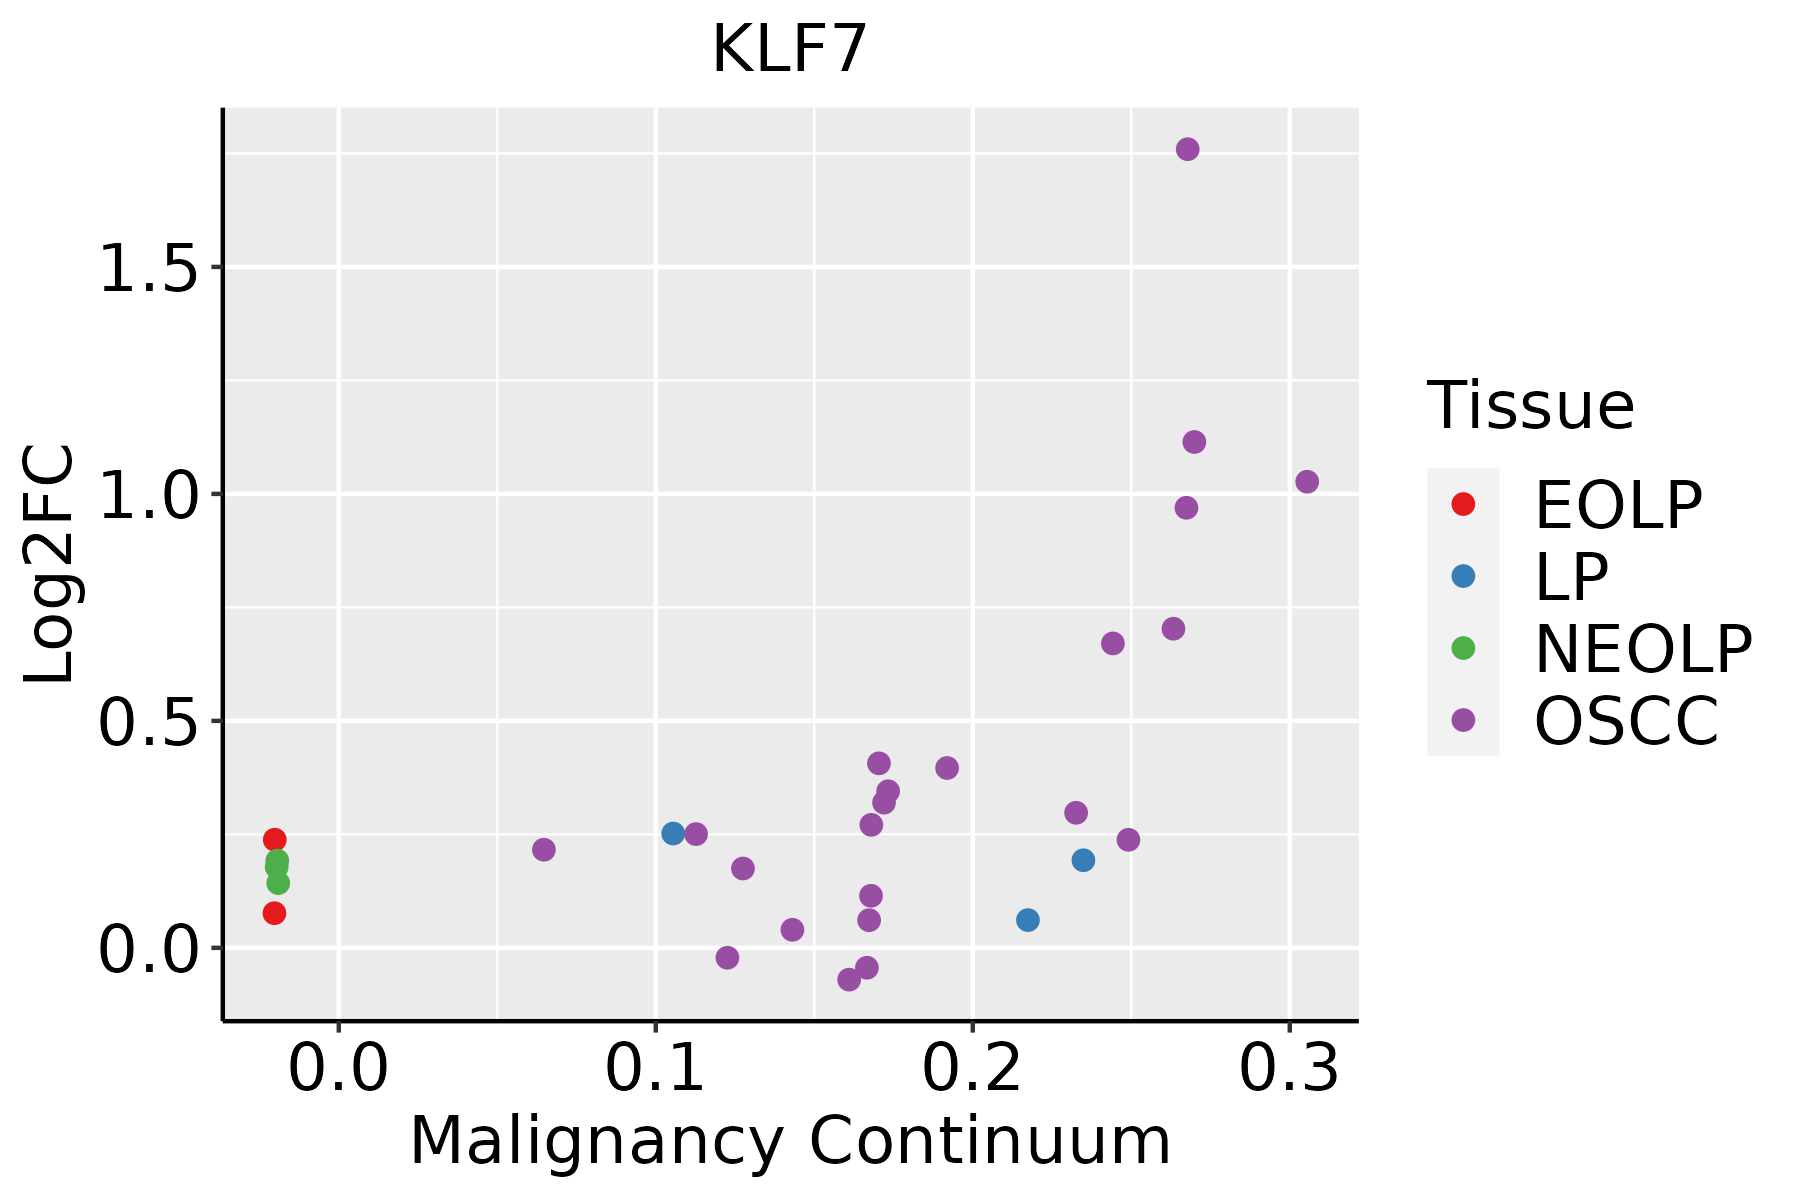 | EOLP: Erosive Oral lichen planus |
| LP: leukoplakia | ||
| NEOLP: Non-erosive oral lichen planus | ||
| OSCC: Oral squamous cell carcinoma | ||
| Skin | 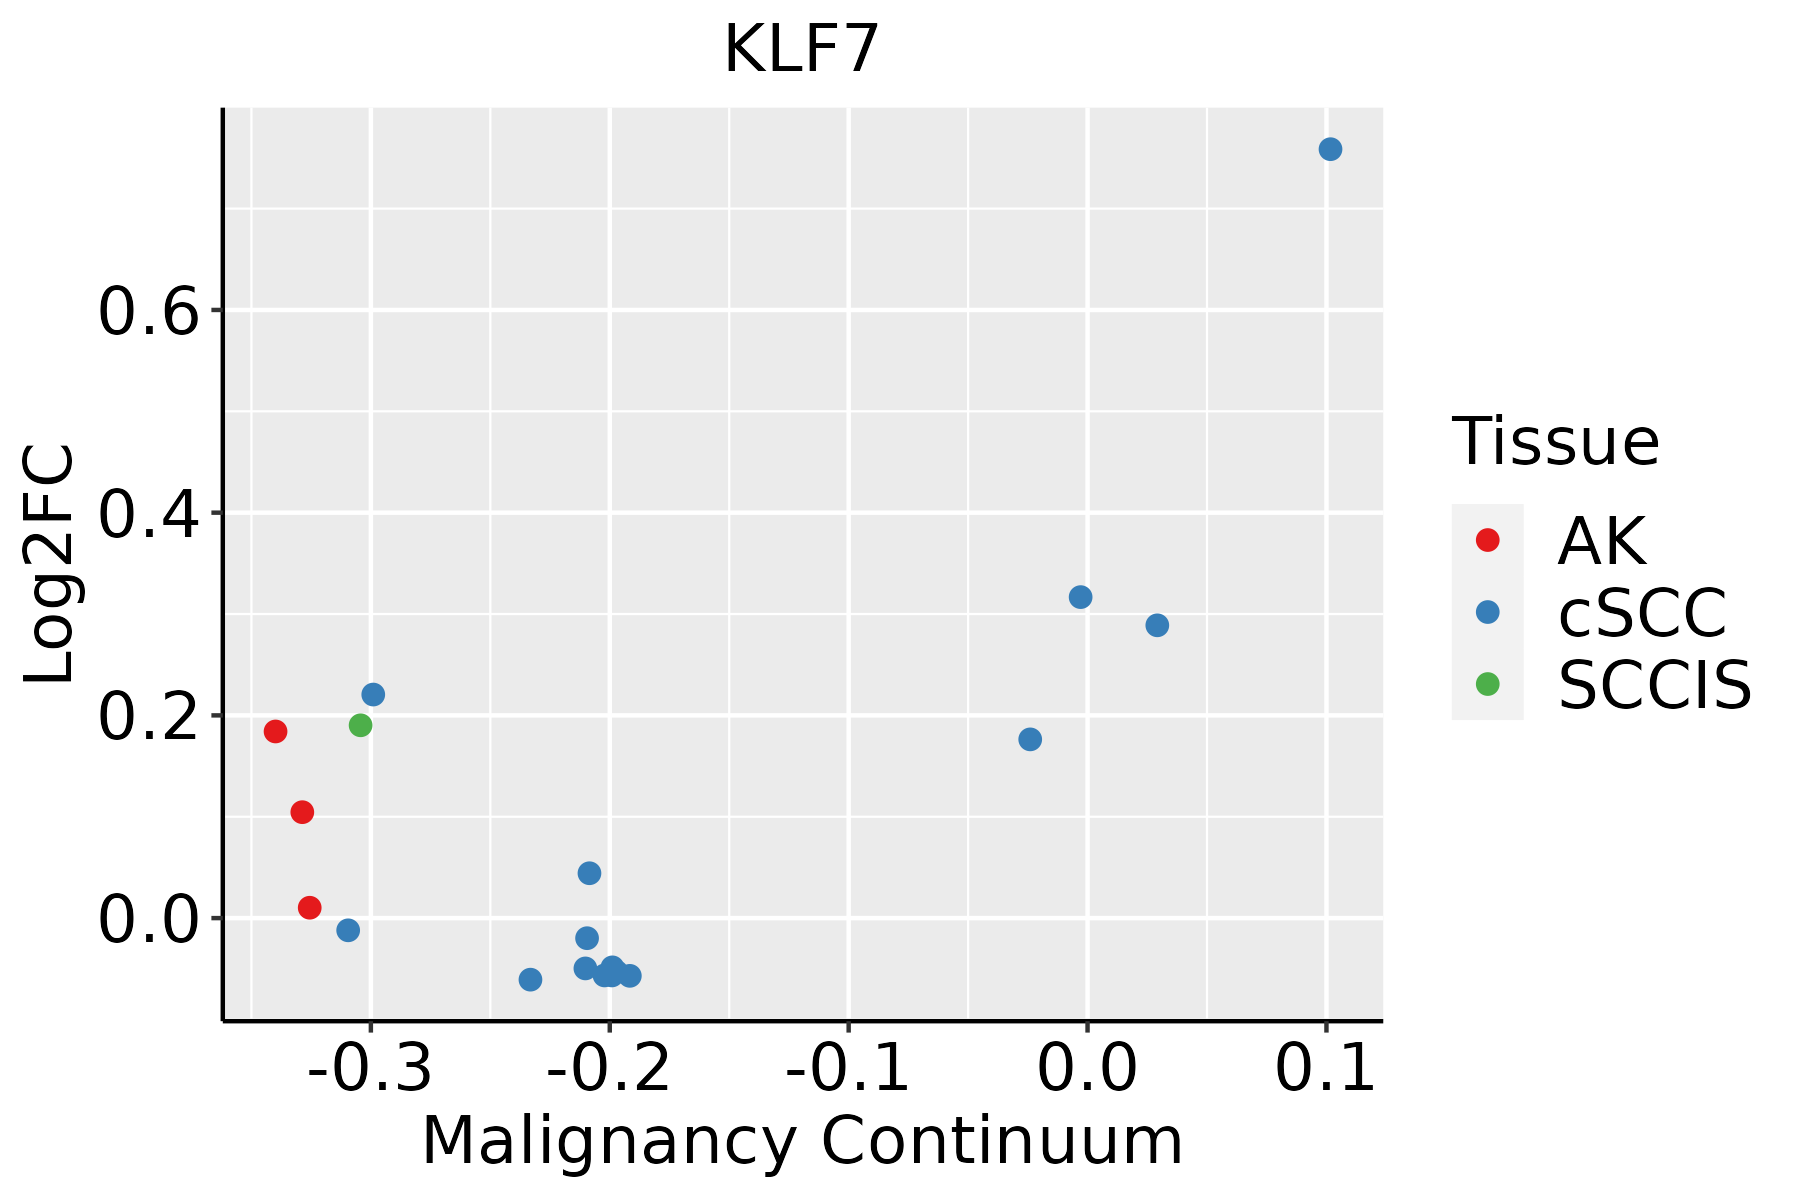 | AK: Actinic keratosis |
| cSCC: Cutaneous squamous cell carcinoma | ||
| SCCIS:squamous cell carcinoma in situ | ||
| Thyroid |  | ATC: Anaplastic thyroid cancer |
| HT: Hashimoto's thyroiditis | ||
| PTC: Papillary thyroid cancer |
| ∗log2FC in expression of this searched gene in stem-like cells from each diseased tissue sample relative to stem-like cells in normal samples in each tissue plotted against the malignancy continuum. Samples are colored based on if they are from different disease stage. |
Top |
Malignant transformation related pathway analysis |
| Find out the enriched GO biological processes and KEGG pathways involved in transition from healthy to precancer to cancer |
| Tissue | Disease Stage | Enriched GO biological Processes |
| Colorectum | AD |  |
| Colorectum | SER |  |
| Colorectum | MSS |  |
| Colorectum | MSI-H |  |
| Colorectum | FAP |  |
| ∗Top 15 enriched GO BP terms are showed in the bar plot of each disease state in each tissue. Each row represents a significant GO biological process which is colored according to the -log10(p.adjust). |
| Page: 1 2 3 4 5 6 7 8 9 |
| GO ID | Tissue | Disease Stage | Description | Gene Ratio | Bg Ratio | pvalue | p.adjust | Count |
| GO:00085446 | Cervix | CC | epidermis development | 83/2311 | 324/18723 | 3.91e-11 | 8.54e-09 | 83 |
| GO:00099137 | Cervix | CC | epidermal cell differentiation | 53/2311 | 202/18723 | 5.48e-08 | 3.25e-06 | 53 |
| GO:00163587 | Cervix | CC | dendrite development | 58/2311 | 243/18723 | 4.52e-07 | 1.76e-05 | 58 |
| GO:00456822 | Cervix | CC | regulation of epidermis development | 22/2311 | 65/18723 | 5.56e-06 | 1.38e-04 | 22 |
| GO:00456042 | Cervix | CC | regulation of epidermal cell differentiation | 20/2311 | 58/18723 | 1.07e-05 | 2.33e-04 | 20 |
| GO:00615647 | Cervix | CC | axon development | 89/2311 | 467/18723 | 1.71e-05 | 3.27e-04 | 89 |
| GO:000974310 | Cervix | CC | response to carbohydrate | 53/2311 | 253/18723 | 7.02e-05 | 9.85e-04 | 53 |
| GO:003428410 | Cervix | CC | response to monosaccharide | 48/2311 | 225/18723 | 9.48e-05 | 1.25e-03 | 48 |
| GO:00308563 | Cervix | CC | regulation of epithelial cell differentiation | 36/2311 | 154/18723 | 1.02e-04 | 1.31e-03 | 36 |
| GO:00074097 | Cervix | CC | axonogenesis | 78/2311 | 418/18723 | 1.14e-04 | 1.43e-03 | 78 |
| GO:000974610 | Cervix | CC | response to hexose | 45/2311 | 219/18723 | 3.73e-04 | 3.86e-03 | 45 |
| GO:00425939 | Cervix | CC | glucose homeostasis | 50/2311 | 258/18723 | 7.57e-04 | 6.76e-03 | 50 |
| GO:00335009 | Cervix | CC | carbohydrate homeostasis | 50/2311 | 259/18723 | 8.28e-04 | 7.22e-03 | 50 |
| GO:00016788 | Cervix | CC | cellular glucose homeostasis | 36/2311 | 172/18723 | 9.65e-04 | 8.09e-03 | 36 |
| GO:00097499 | Cervix | CC | response to glucose | 42/2311 | 212/18723 | 1.23e-03 | 9.87e-03 | 42 |
| GO:00713229 | Cervix | CC | cellular response to carbohydrate stimulus | 33/2311 | 163/18723 | 2.71e-03 | 1.85e-02 | 33 |
| GO:00713338 | Cervix | CC | cellular response to glucose stimulus | 31/2311 | 151/18723 | 2.86e-03 | 1.91e-02 | 31 |
| GO:00488135 | Cervix | CC | dendrite morphogenesis | 30/2311 | 146/18723 | 3.27e-03 | 2.13e-02 | 30 |
| GO:00713318 | Cervix | CC | cellular response to hexose stimulus | 31/2311 | 153/18723 | 3.53e-03 | 2.27e-02 | 31 |
| GO:00713268 | Cervix | CC | cellular response to monosaccharide stimulus | 31/2311 | 154/18723 | 3.90e-03 | 2.46e-02 | 31 |
| Page: 1 2 3 4 5 6 7 8 9 10 11 12 |
| Pathway ID | Tissue | Disease Stage | Description | Gene Ratio | Bg Ratio | pvalue | p.adjust | qvalue | Count |
| Page: 1 |
Top |
Cell-cell communication analysis |
| Identification of potential cell-cell interactions between two cell types and their ligand-receptor pairs for different disease states |
| Ligand | Receptor | LRpair | Pathway | Tissue | Disease Stage |
| Page: 1 |
Top |
Single-cell gene regulatory network inference analysis |
| Find out the significant the regulons (TFs) and the target genes of each regulon across cell types for different disease states |
| TF | Cell Type | Tissue | Disease Stage | Target Gene | RSS | Regulon Activity |
| KLF7 | COL | Cervix | HSIL_HPV | ITGA3,CDH3,ITGB6, etc. | 2.59e-01 |  |
| KLF7 | DC | Colorectum | AD | ENPP2,MTSS1,RASSF5, etc. | 7.27e-02 |  |
| KLF7 | MAC | Colorectum | AD | ENPP2,MTSS1,RASSF5, etc. | 1.21e-01 | |
| KLF7 | BMEM | Colorectum | AD | ENPP2,MTSS1,RASSF5, etc. | 6.19e-02 | |
| KLF7 | DC | Colorectum | ADJ | ENPP2,MTSS1,RASSF5, etc. | 7.78e-02 |  |
| KLF7 | MAC | Colorectum | ADJ | ENPP2,MTSS1,RASSF5, etc. | 1.53e-01 | |
| KLF7 | MAC | Colorectum | CRC | ENPP2,MTSS1,RASSF5, etc. | 4.07e-01 |  |
| KLF7 | DC | Colorectum | CRC | ENPP2,MTSS1,RASSF5, etc. | 5.32e-02 | |
| KLF7 | BN | Colorectum | CRC | ENPP2,MTSS1,RASSF5, etc. | 1.58e-02 | |
| KLF7 | MAC | Colorectum | FAP | ENPP2,MTSS1,RASSF5, etc. | 2.94e-01 |  |
| ∗The dot plots of a searched regulon are shown for all cell subpopulations in each disease state of each tissue based on the regulon specific score inferred using pySCENIC and by calculating the average expression. |
| Page: 1 2 3 4 5 |
Top |
Somatic mutation of malignant transformation related genes |
| Annotation of somatic variants for genes involved in malignant transformation |
| Hugo Symbol | Variant Class | Variant Classification | dbSNP RS | HGVSc | HGVSp | HGVSp Short | SWISSPROT | BIOTYPE | SIFT | PolyPhen | Tumor Sample Barcode | Tissue | Histology | Sex | Age | Stage | Therapy Types | Drugs | Outcome |
| KLF7 | SNV | Missense_Mutation | rs761995114 | c.637N>A | p.Glu213Lys | p.E213K | O75840 | protein_coding | deleterious(0.01) | possibly_damaging(0.614) | TCGA-AN-A046-01 | Breast | breast invasive carcinoma | Female | >=65 | I/II | Unknown | Unknown | SD |
| KLF7 | SNV | Missense_Mutation | c.884N>G | p.Ala295Gly | p.A295G | O75840 | protein_coding | deleterious(0) | probably_damaging(0.93) | TCGA-B6-A0IJ-01 | Breast | breast invasive carcinoma | Female | <65 | I/II | Unknown | Unknown | SD | |
| KLF7 | SNV | Missense_Mutation | c.874G>C | p.Asp292His | p.D292H | O75840 | protein_coding | deleterious(0) | probably_damaging(0.999) | TCGA-D8-A27G-01 | Breast | breast invasive carcinoma | Female | >=65 | I/II | Unknown | Unknown | SD | |
| KLF7 | insertion | In_Frame_Ins | novel | c.16_17insTGAAAAATACTAGAAACAGTGATTGCC | p.Ser6delinsMetLysAsnThrArgAsnSerAspCysArg | p.S6delinsMKNTRNSDCR | O75840 | protein_coding | TCGA-AN-A0FX-01 | Breast | breast invasive carcinoma | Female | <65 | I/II | Unknown | Unknown | SD | ||
| KLF7 | insertion | In_Frame_Ins | novel | c.738_739insTCCTCCTGTATTTACATGAATCAGCAGCTGTCTTCTACAGAGTAT | p.Glu246_Lys247insSerSerCysIleTyrMetAsnGlnGlnLeuSerSerThrGluTyr | p.E246_K247insSSCIYMNQQLSSTEY | O75840 | protein_coding | TCGA-B6-A0IE-01 | Breast | breast invasive carcinoma | Female | <65 | III/IV | Unknown | Unknown | PD | ||
| KLF7 | SNV | Missense_Mutation | rs199543928 | c.580N>A | p.Val194Ile | p.V194I | O75840 | protein_coding | tolerated(0.33) | benign(0) | TCGA-EA-A3HS-01 | Cervix | cervical & endocervical cancer | Female | <65 | I/II | Unknown | Unknown | SD |
| KLF7 | SNV | Missense_Mutation | novel | c.136N>A | p.Glu46Lys | p.E46K | O75840 | protein_coding | deleterious(0) | probably_damaging(0.996) | TCGA-VS-A958-01 | Cervix | cervical & endocervical cancer | Female | <65 | I/II | Chemotherapy | cisplatin | CR |
| KLF7 | SNV | Missense_Mutation | c.659G>A | p.Arg220His | p.R220H | O75840 | protein_coding | deleterious(0) | benign(0.139) | TCGA-AA-3710-01 | Colorectum | colon adenocarcinoma | Female | >=65 | I/II | Unknown | Unknown | SD | |
| KLF7 | SNV | Missense_Mutation | c.41A>G | p.Gln14Arg | p.Q14R | O75840 | protein_coding | deleterious(0.01) | benign(0.051) | TCGA-AA-3977-01 | Colorectum | colon adenocarcinoma | Male | >=65 | I/II | Unknown | Unknown | SD | |
| KLF7 | SNV | Missense_Mutation | c.776N>A | p.Arg259His | p.R259H | O75840 | protein_coding | deleterious(0) | probably_damaging(0.993) | TCGA-AA-A01R-01 | Colorectum | colon adenocarcinoma | Male | <65 | III/IV | Chemotherapy | 5-fluorouracil | PD |
| Page: 1 2 3 4 5 |
Top |
Related drugs of malignant transformation related genes |
| Identification of chemicals and drugs interact with genes involved in malignant transfromation |
| (DGIdb 4.0) |
| Entrez ID | Symbol | Category | Interaction Types | Drug Claim Name | Drug Name | PMIDs |
| Page: 1 |

Copyright 2023-Present -The University of Texas Health Science Center at Houston |