
|
|||||
|
 | |
| |
| |
| |
| |
| |
|
Gene: KLF6 |
Gene summary for KLF6 |
| Gene information | Species | Human | Gene symbol | KLF6 | Gene ID | 1316 |
| Gene name | Kruppel like factor 6 | |
| Gene Alias | BCD1 | |
| Cytomap | 10p15.2 | |
| Gene Type | protein-coding | GO ID | GO:0001775 | UniProtAcc | D3GC14 |
Top |
Malignant transformation analysis |
| Identification of the aberrant gene expression in precancerous and cancerous lesions by comparing the gene expression of stem-like cells in diseased tissues with normal stem cells |
| Entrez ID | Symbol | Replicates | Species | Organ | Tissue | Adj P-value | Log2FC | Malignancy |
| 1316 | KLF6 | GSM4909277 | Human | Breast | Precancer | 6.50e-05 | 6.71e-01 | 0.0177 |
| 1316 | KLF6 | GSM4909281 | Human | Breast | IDC | 9.45e-27 | -8.08e-01 | 0.21 |
| 1316 | KLF6 | GSM4909282 | Human | Breast | IDC | 3.57e-18 | -6.89e-01 | -0.0288 |
| 1316 | KLF6 | GSM4909285 | Human | Breast | IDC | 1.73e-05 | -1.79e-01 | 0.21 |
| 1316 | KLF6 | GSM4909286 | Human | Breast | IDC | 1.23e-33 | -9.38e-01 | 0.1081 |
| 1316 | KLF6 | GSM4909288 | Human | Breast | IDC | 6.70e-04 | -6.30e-01 | 0.0988 |
| 1316 | KLF6 | GSM4909290 | Human | Breast | IDC | 2.50e-14 | -6.35e-01 | 0.2096 |
| 1316 | KLF6 | GSM4909294 | Human | Breast | IDC | 3.45e-19 | -7.78e-01 | 0.2022 |
| 1316 | KLF6 | GSM4909297 | Human | Breast | IDC | 2.16e-16 | -6.98e-01 | 0.1517 |
| 1316 | KLF6 | GSM4909298 | Human | Breast | IDC | 2.97e-11 | -3.22e-01 | 0.1551 |
| 1316 | KLF6 | GSM4909299 | Human | Breast | IDC | 2.19e-03 | 2.75e-01 | 0.035 |
| 1316 | KLF6 | GSM4909300 | Human | Breast | IDC | 1.87e-07 | 5.15e-01 | 0.0334 |
| 1316 | KLF6 | GSM4909302 | Human | Breast | IDC | 4.01e-14 | -5.94e-01 | 0.1545 |
| 1316 | KLF6 | GSM4909304 | Human | Breast | IDC | 1.96e-17 | -6.53e-01 | 0.1636 |
| 1316 | KLF6 | GSM4909305 | Human | Breast | IDC | 6.89e-03 | 3.42e-01 | 0.0436 |
| 1316 | KLF6 | GSM4909306 | Human | Breast | IDC | 2.31e-06 | -4.61e-01 | 0.1564 |
| 1316 | KLF6 | GSM4909307 | Human | Breast | IDC | 2.60e-09 | -5.49e-01 | 0.1569 |
| 1316 | KLF6 | GSM4909308 | Human | Breast | IDC | 1.32e-03 | -2.56e-01 | 0.158 |
| 1316 | KLF6 | GSM4909309 | Human | Breast | IDC | 2.11e-06 | 2.22e-01 | 0.0483 |
| 1316 | KLF6 | GSM4909311 | Human | Breast | IDC | 1.68e-21 | -6.29e-01 | 0.1534 |
| Page: 1 2 3 4 5 6 7 8 9 10 11 12 13 14 15 16 |
| Tissue | Expression Dynamics | Abbreviation |
| Breast |  | IDC: Invasive ductal carcinoma |
| DCIS: Ductal carcinoma in situ | ||
| Precancer(BRCA1-mut): Precancerous lesion from BRCA1 mutation carriers | ||
| Cervix | 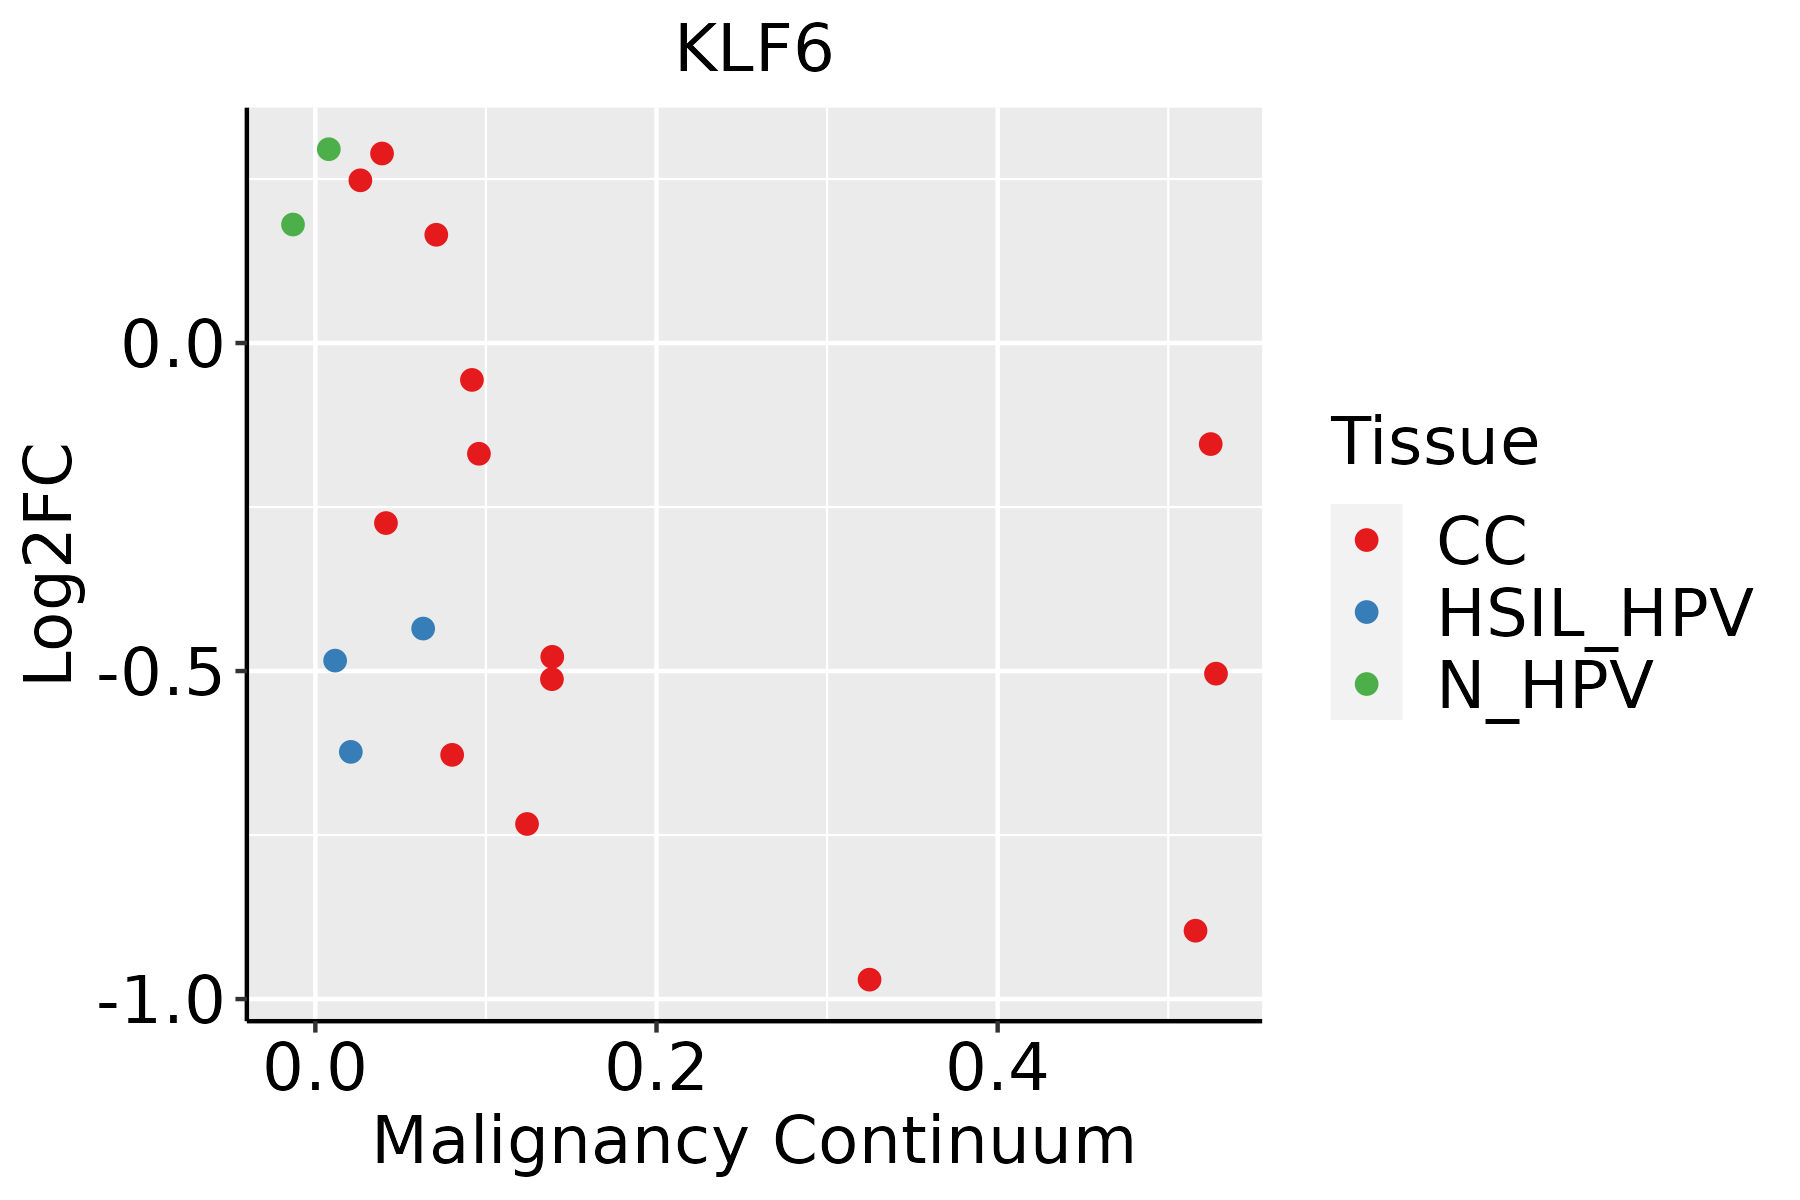 | CC: Cervix cancer |
| HSIL_HPV: HPV-infected high-grade squamous intraepithelial lesions | ||
| N_HPV: HPV-infected normal cervix | ||
| Colorectum (GSE201348) |  | FAP: Familial adenomatous polyposis |
| CRC: Colorectal cancer | ||
| Colorectum (HTA11) | 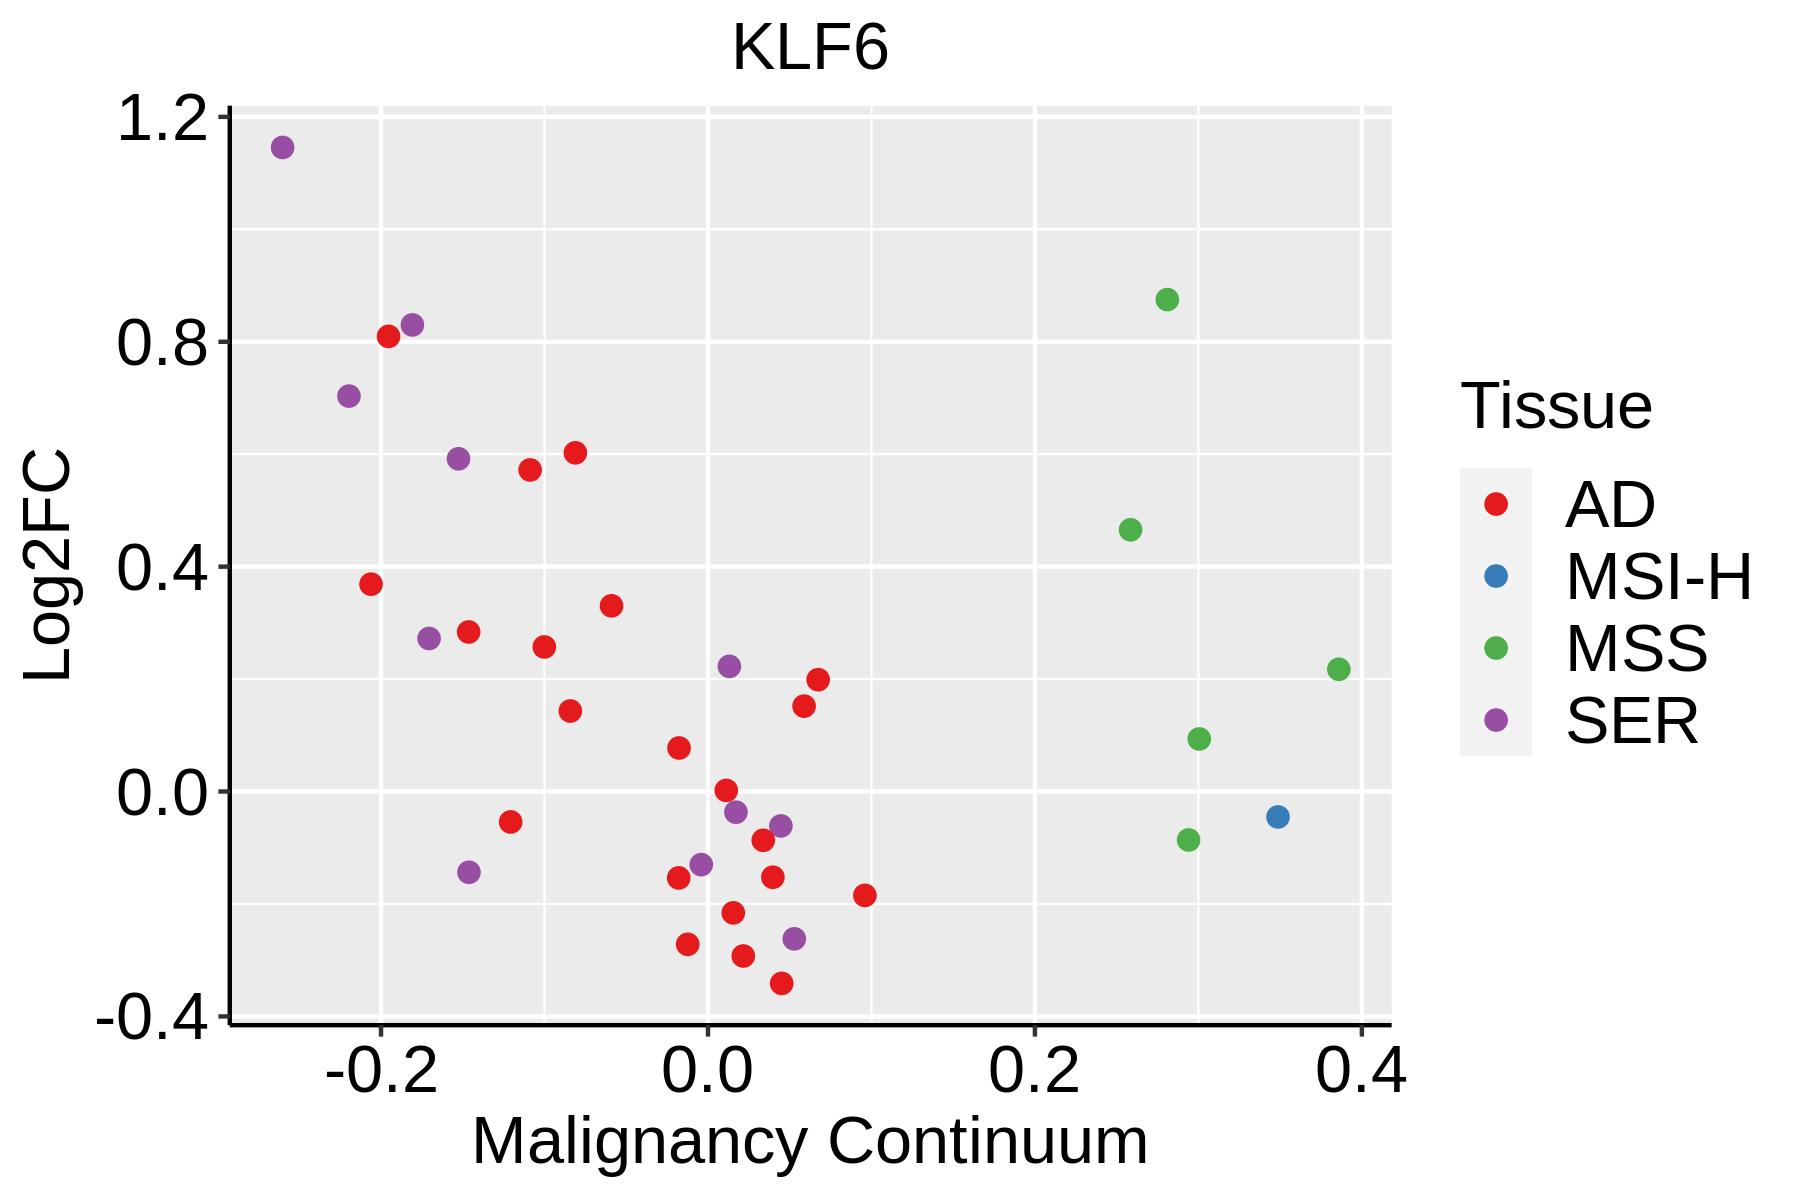 | AD: Adenomas |
| SER: Sessile serrated lesions | ||
| MSI-H: Microsatellite-high colorectal cancer | ||
| MSS: Microsatellite stable colorectal cancer | ||
| Endometrium | 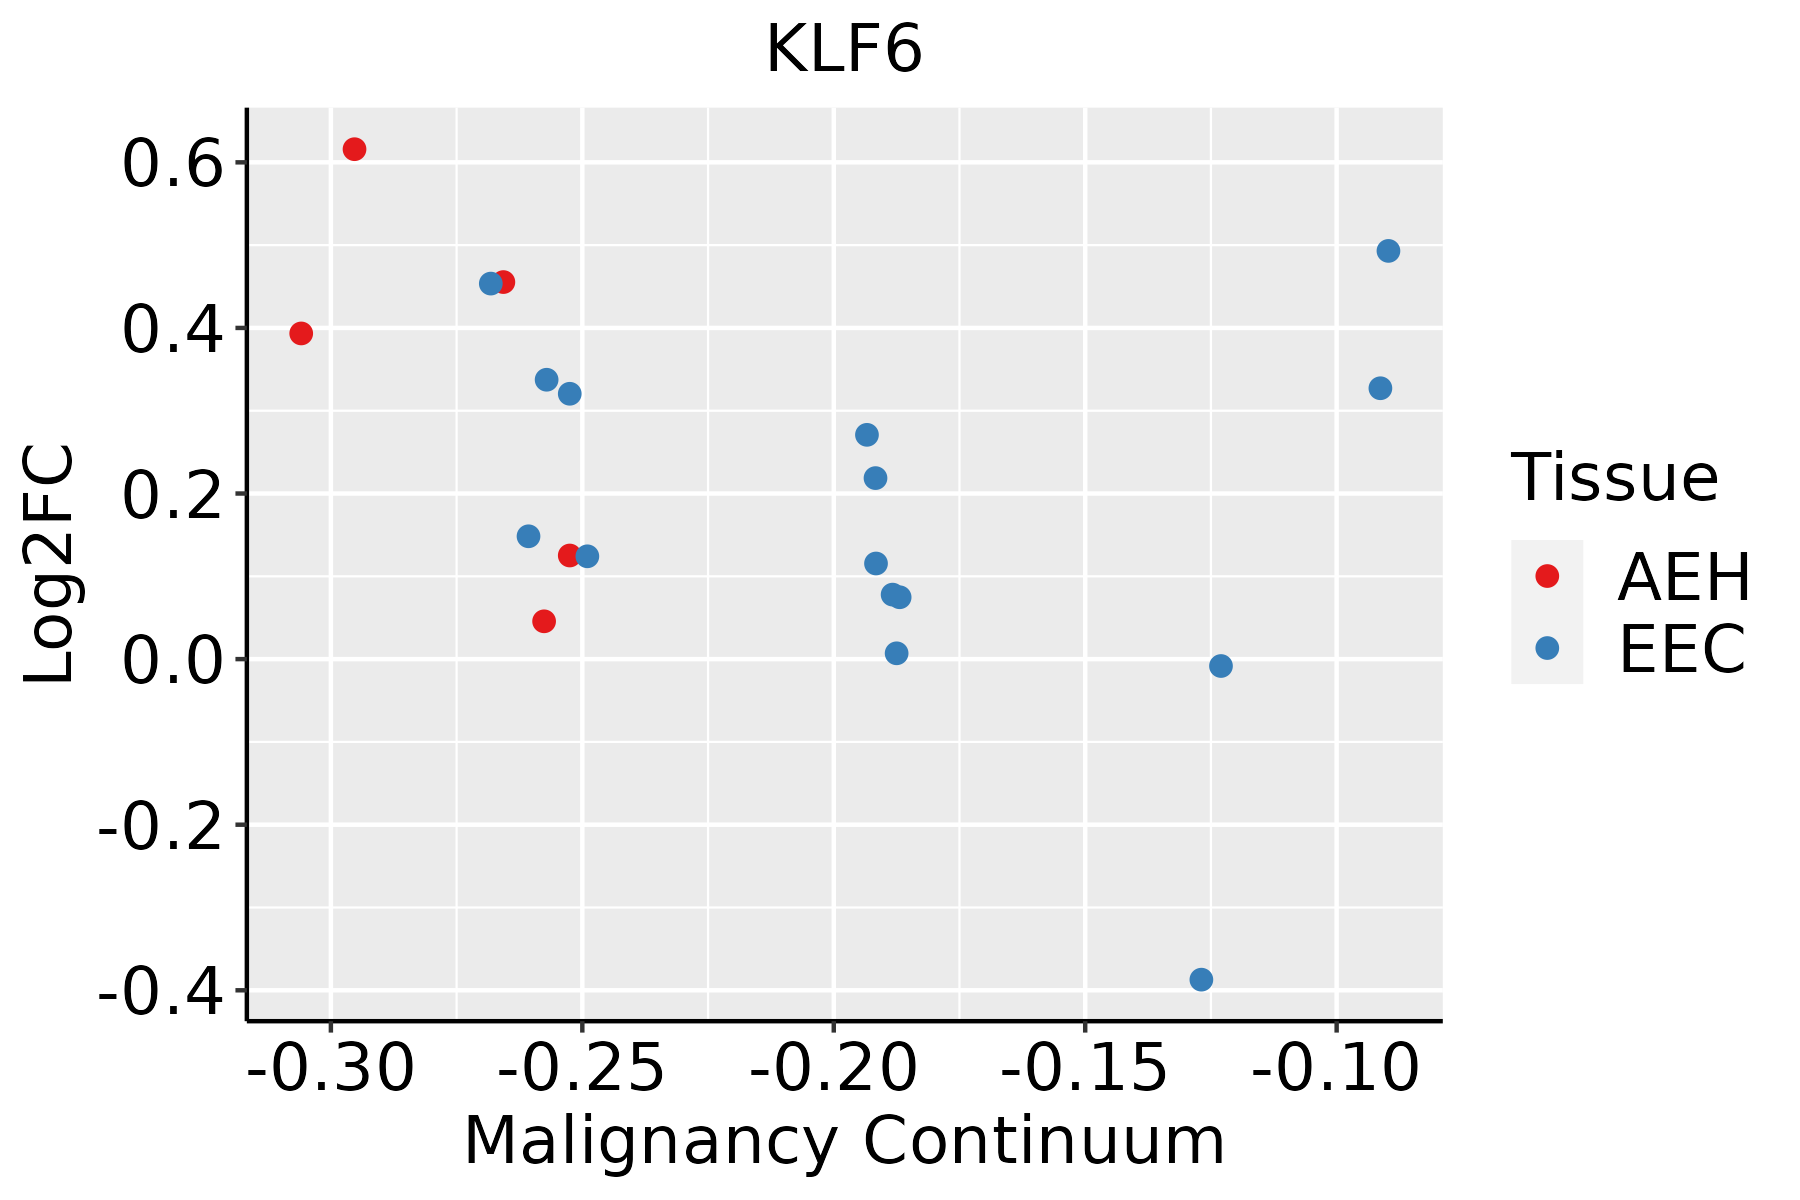 | AEH: Atypical endometrial hyperplasia |
| EEC: Endometrioid Cancer | ||
| Esophagus |  | ESCC: Esophageal squamous cell carcinoma |
| HGIN: High-grade intraepithelial neoplasias | ||
| LGIN: Low-grade intraepithelial neoplasias | ||
| GC | 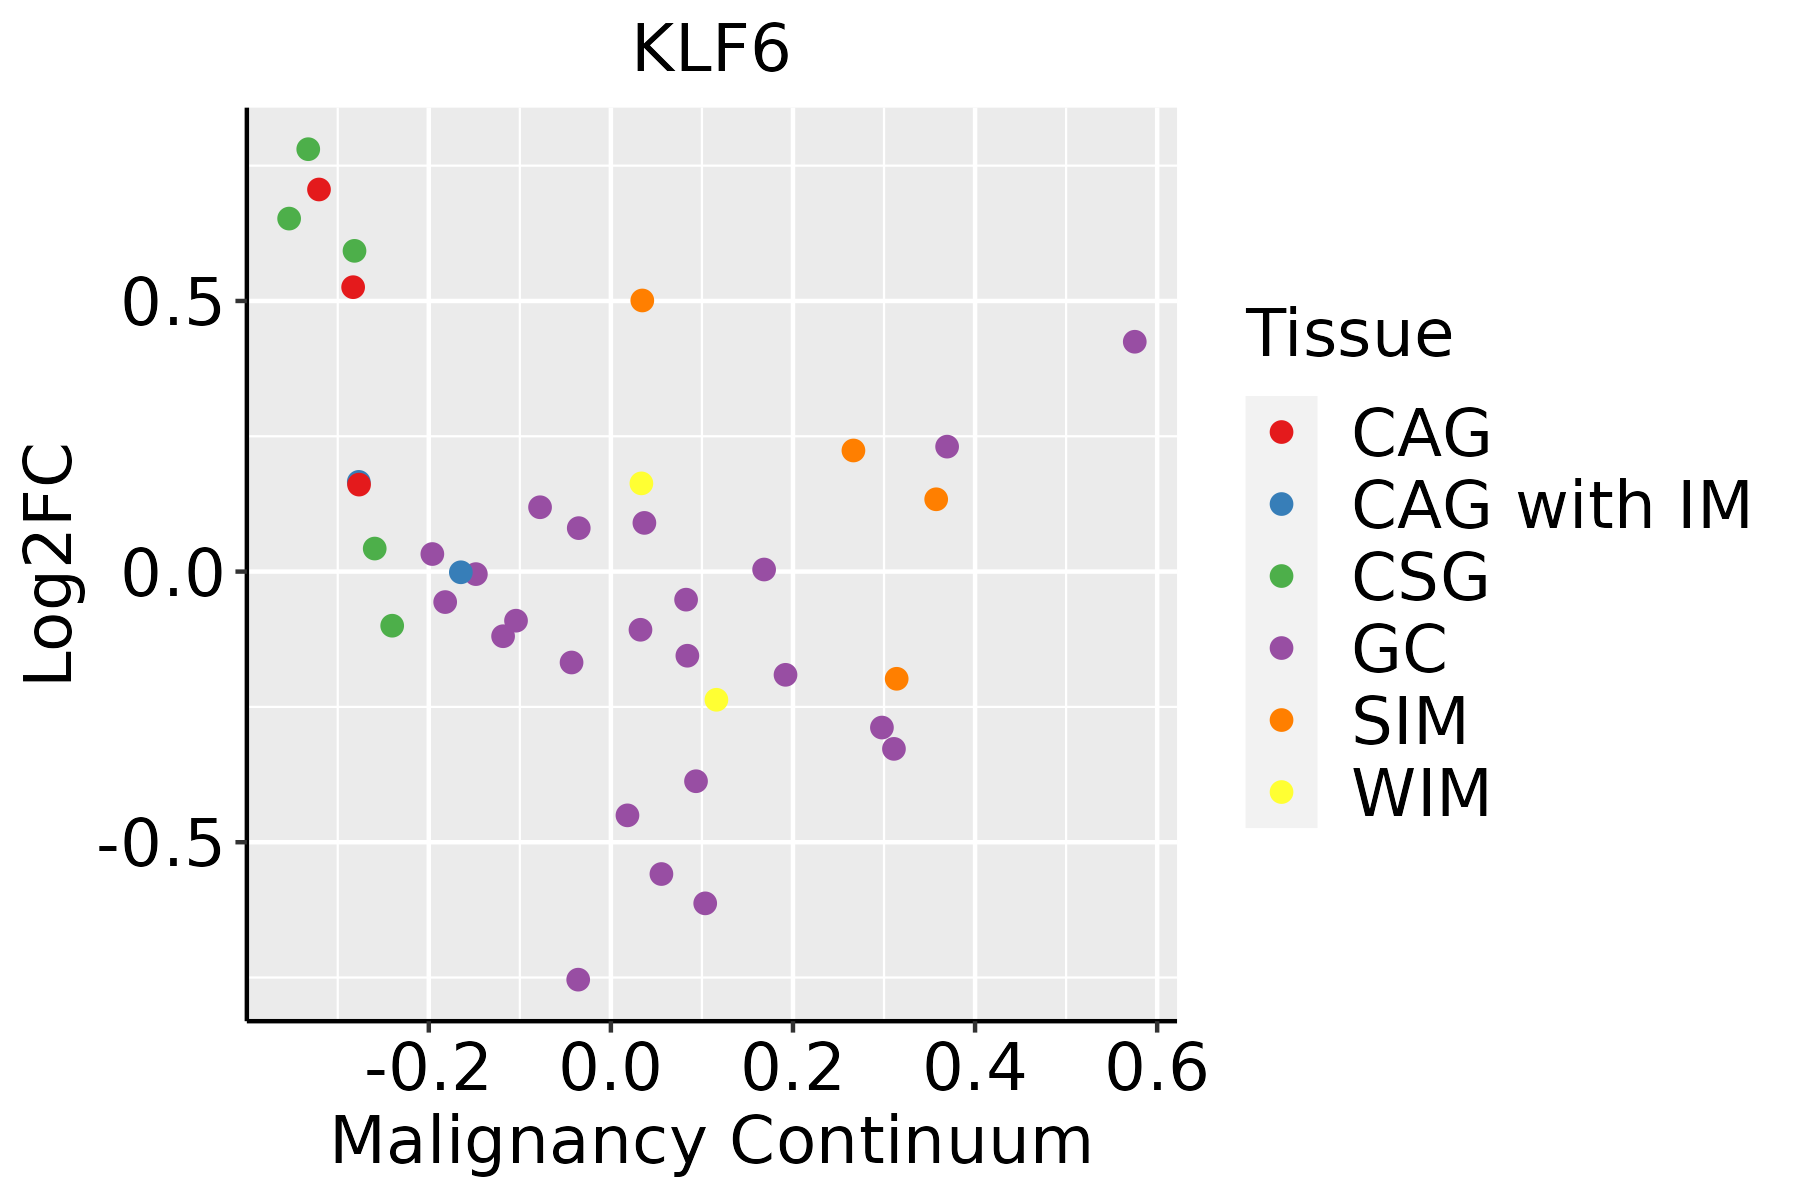 | CAG: Chronic atrophic gastritis |
| CAG with IM: Chronic atrophic gastritis with intestinal metaplasia | ||
| CSG: Chronic superficial gastritis | ||
| GC: Gastric cancer | ||
| SIM: Severe intestinal metaplasia | ||
| WIM: Wild intestinal metaplasia | ||
| Liver | 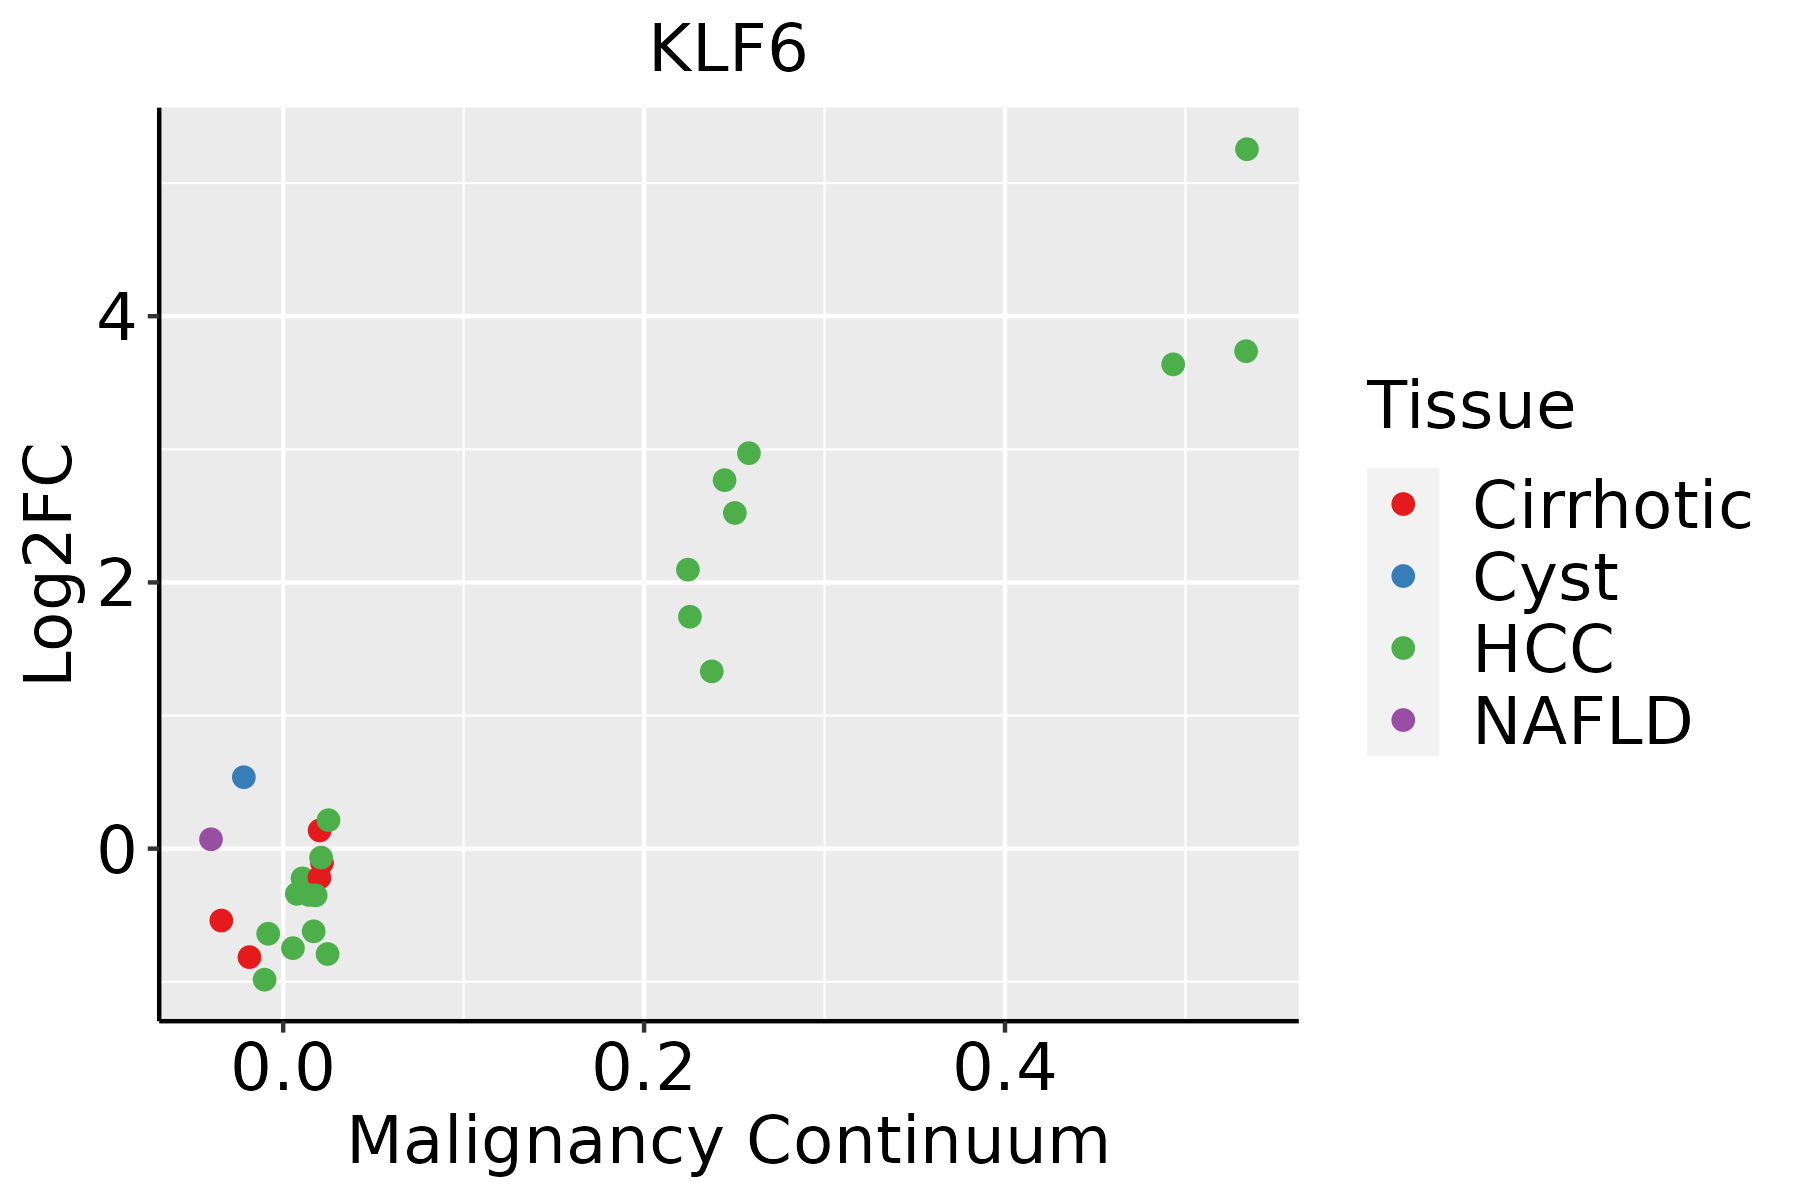 | HCC: Hepatocellular carcinoma |
| NAFLD: Non-alcoholic fatty liver disease | ||
| Lung | 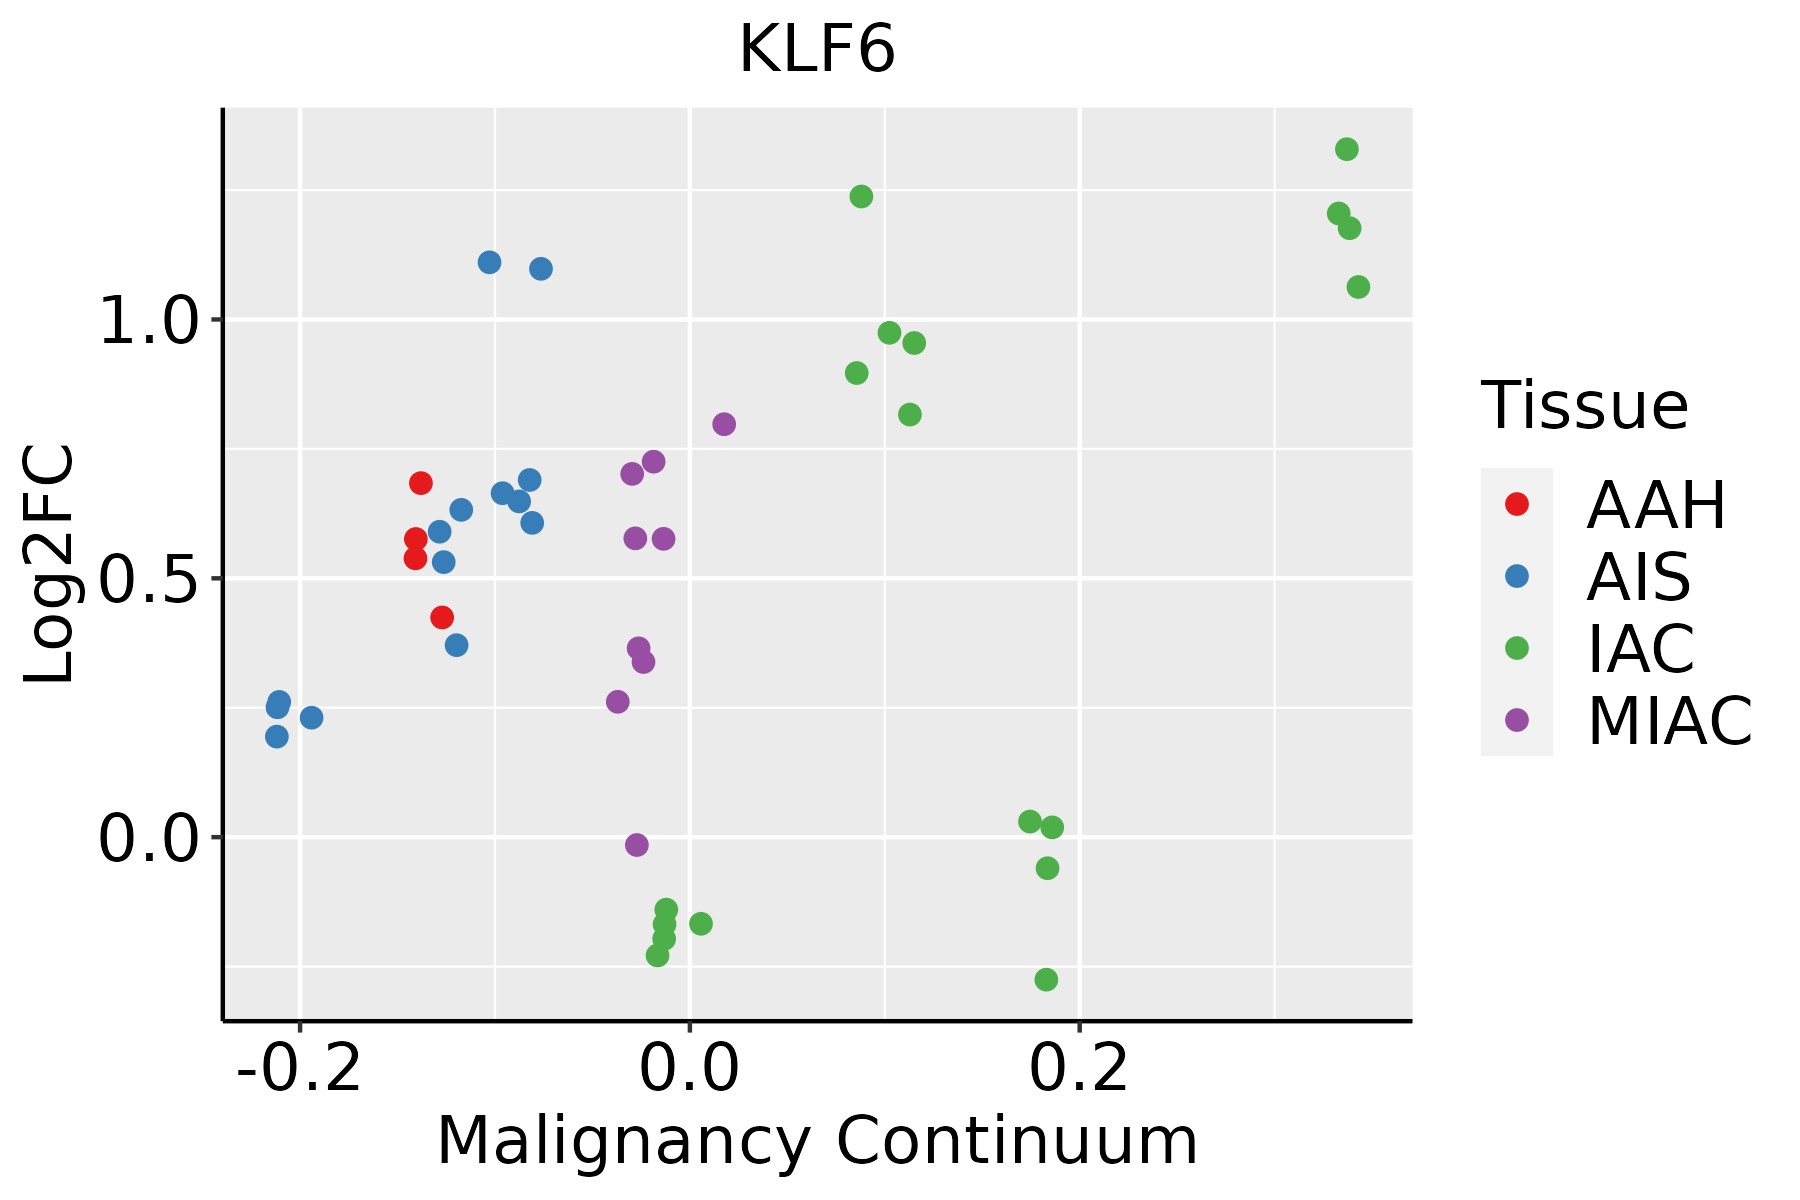 | AAH: Atypical adenomatous hyperplasia |
| AIS: Adenocarcinoma in situ | ||
| IAC: Invasive lung adenocarcinoma | ||
| MIA: Minimally invasive adenocarcinoma | ||
| Oral Cavity |  | EOLP: Erosive Oral lichen planus |
| LP: leukoplakia | ||
| NEOLP: Non-erosive oral lichen planus | ||
| OSCC: Oral squamous cell carcinoma | ||
| Prostate | 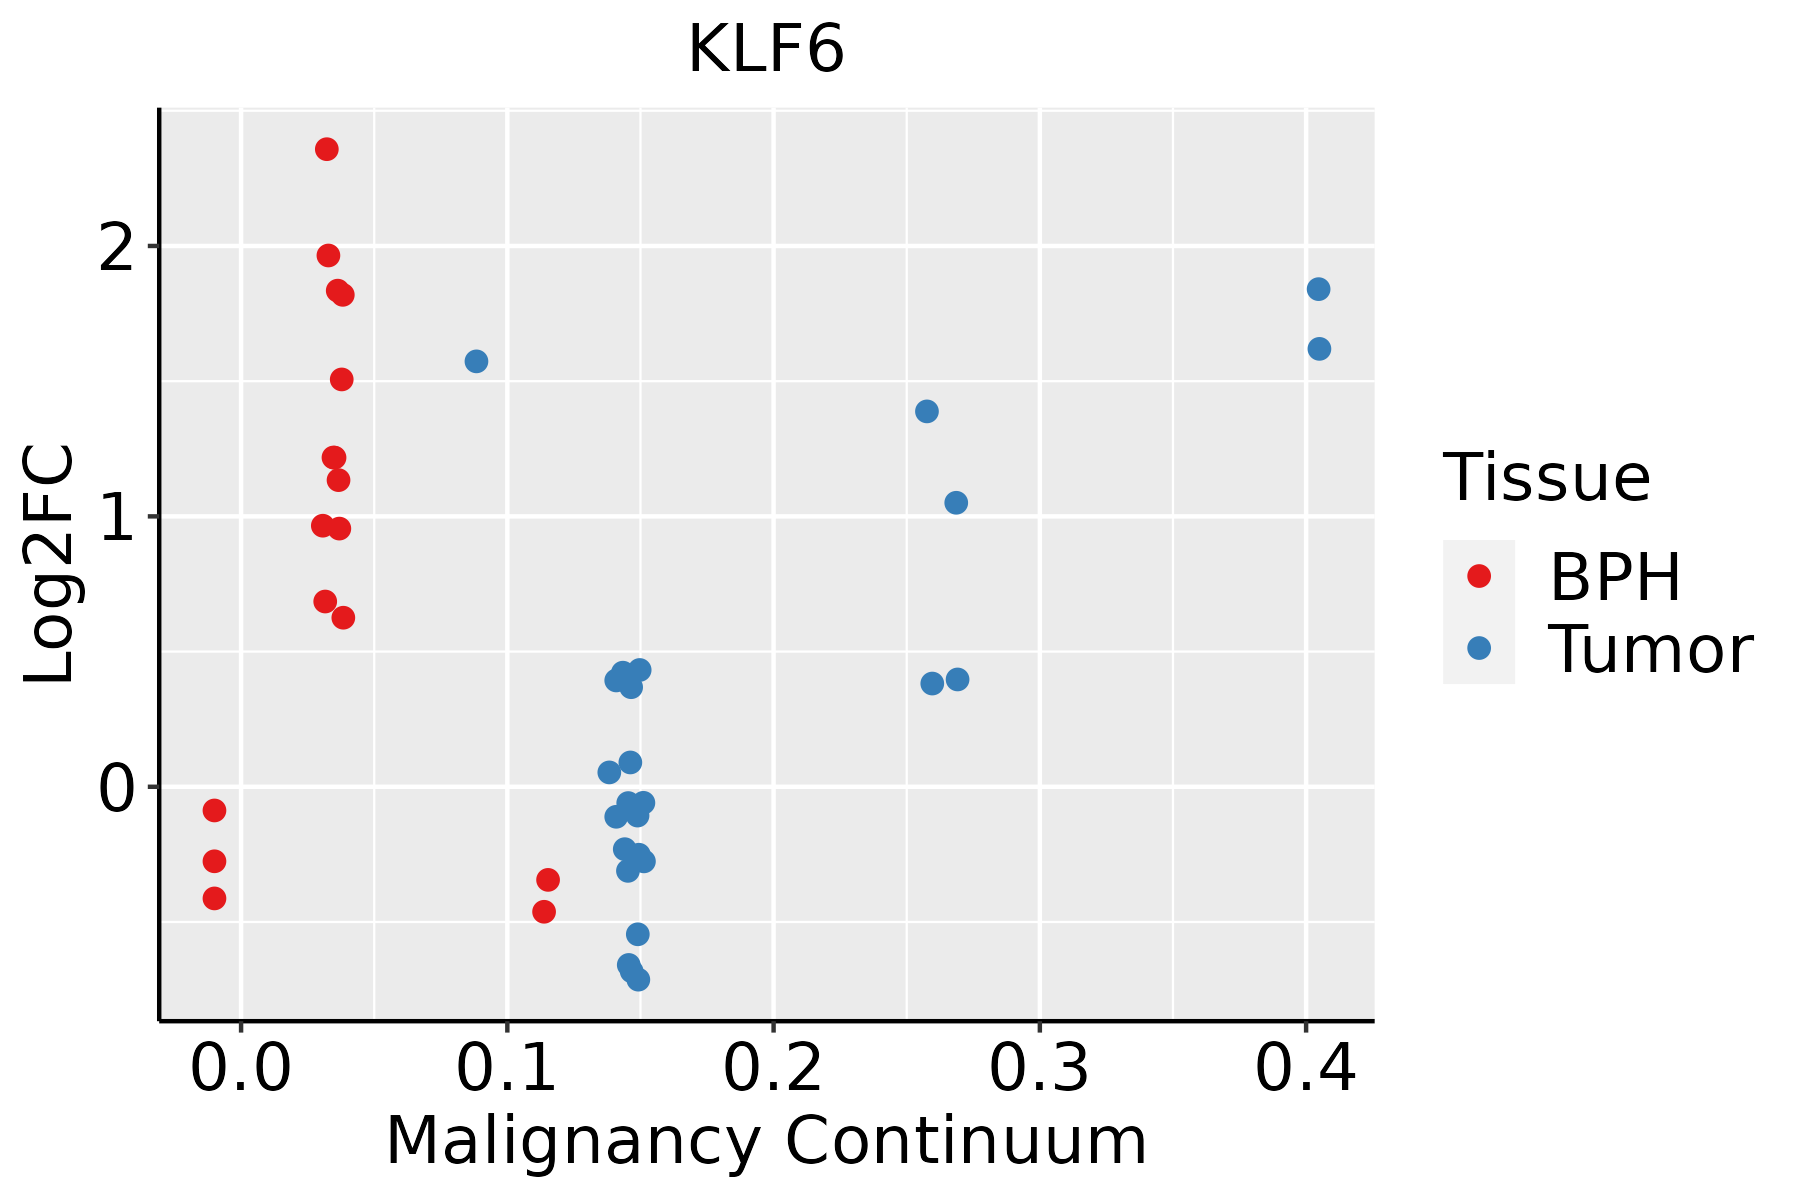 | BPH: Benign Prostatic Hyperplasia |
| Skin | 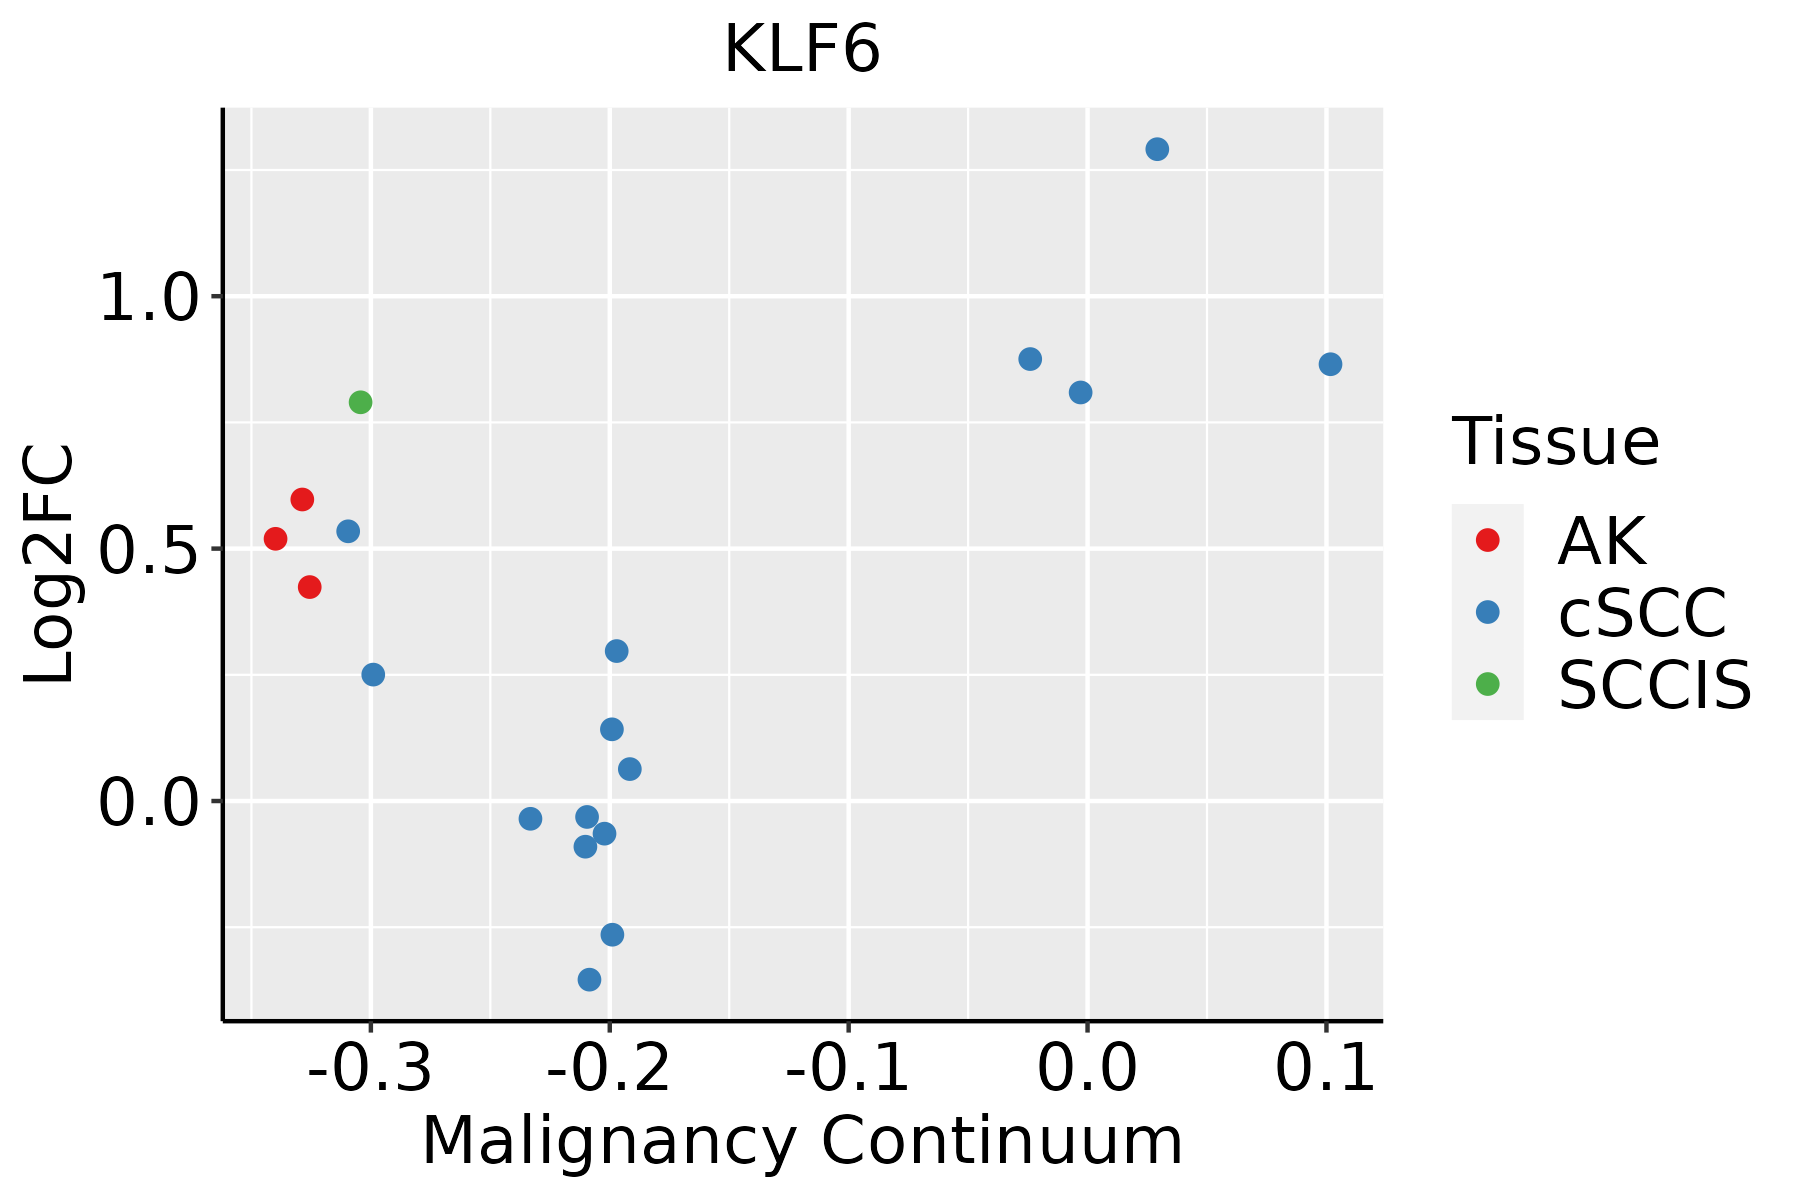 | AK: Actinic keratosis |
| cSCC: Cutaneous squamous cell carcinoma | ||
| SCCIS:squamous cell carcinoma in situ | ||
| Thyroid | 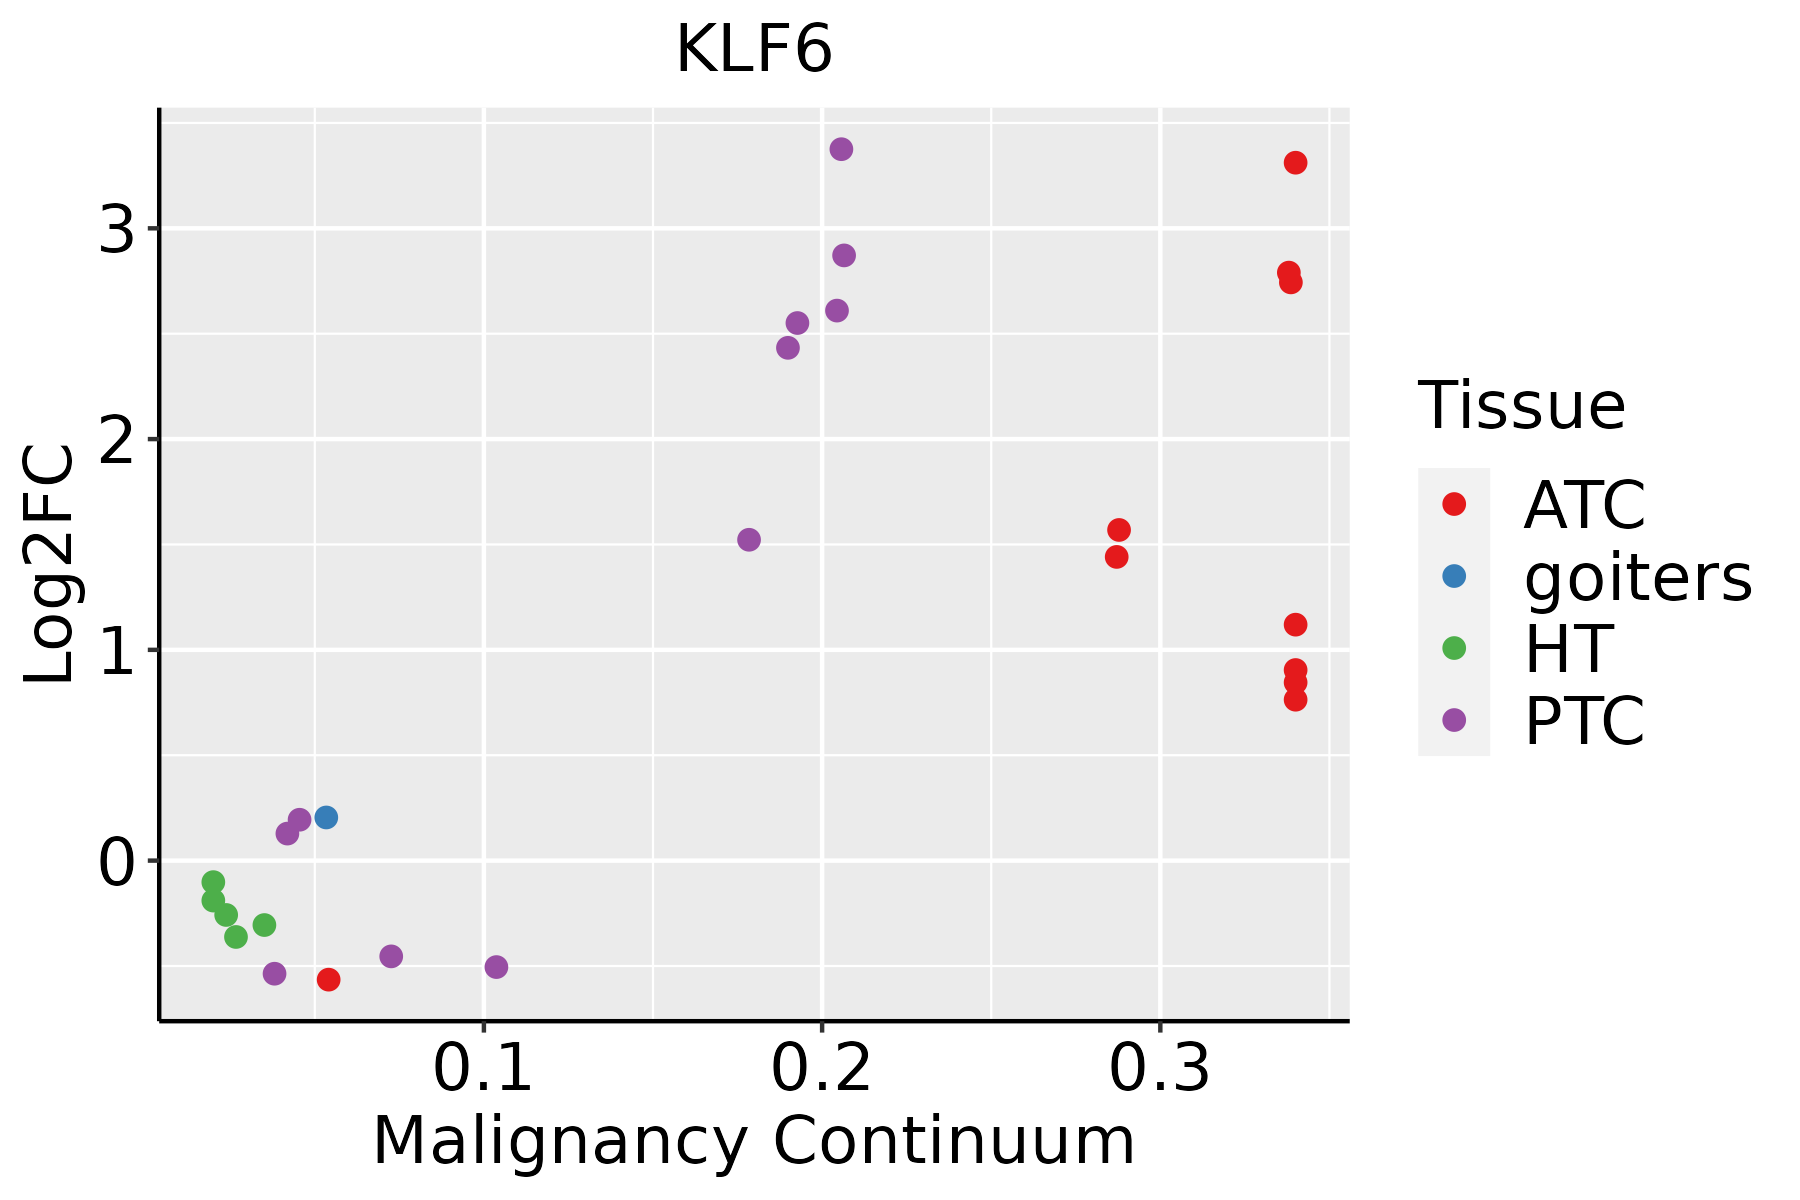 | ATC: Anaplastic thyroid cancer |
| HT: Hashimoto's thyroiditis | ||
| PTC: Papillary thyroid cancer |
| ∗log2FC in expression of this searched gene in stem-like cells from each diseased tissue sample relative to stem-like cells in normal samples in each tissue plotted against the malignancy continuum. Samples are colored based on if they are from different disease stage. |
Top |
Malignant transformation related pathway analysis |
| Find out the enriched GO biological processes and KEGG pathways involved in transition from healthy to precancer to cancer |
| Tissue | Disease Stage | Enriched GO biological Processes |
| Colorectum | AD |  |
| Colorectum | SER |  |
| Colorectum | MSS |  |
| Colorectum | MSI-H |  |
| Colorectum | FAP |  |
| ∗Top 15 enriched GO BP terms are showed in the bar plot of each disease state in each tissue. Each row represents a significant GO biological process which is colored according to the -log10(p.adjust). |
| Page: 1 2 3 4 5 6 7 8 9 |
| GO ID | Tissue | Disease Stage | Description | Gene Ratio | Bg Ratio | pvalue | p.adjust | Count |
| GO:19031313 | Breast | Precancer | mononuclear cell differentiation | 43/1080 | 426/18723 | 2.61e-04 | 3.84e-03 | 43 |
| GO:0030098 | Breast | Precancer | lymphocyte differentiation | 36/1080 | 374/18723 | 1.85e-03 | 1.81e-02 | 36 |
| GO:190313111 | Breast | IDC | mononuclear cell differentiation | 51/1434 | 426/18723 | 9.81e-04 | 1.11e-02 | 51 |
| GO:19031312 | Breast | DCIS | mononuclear cell differentiation | 51/1390 | 426/18723 | 4.88e-04 | 6.40e-03 | 51 |
| GO:19031314 | Cervix | CC | mononuclear cell differentiation | 76/2311 | 426/18723 | 5.66e-04 | 5.42e-03 | 76 |
| GO:00300981 | Cervix | CC | lymphocyte differentiation | 63/2311 | 374/18723 | 6.21e-03 | 3.52e-02 | 63 |
| GO:190313112 | Cervix | HSIL_HPV | mononuclear cell differentiation | 29/737 | 426/18723 | 3.10e-03 | 2.84e-02 | 29 |
| GO:0042113 | Cervix | HSIL_HPV | B cell activation | 24/737 | 334/18723 | 3.48e-03 | 3.14e-02 | 24 |
| GO:190313121 | Cervix | N_HPV | mononuclear cell differentiation | 24/534 | 426/18723 | 1.27e-03 | 1.40e-02 | 24 |
| GO:00421131 | Cervix | N_HPV | B cell activation | 18/534 | 334/18723 | 7.67e-03 | 4.96e-02 | 18 |
| GO:1903131 | Colorectum | FAP | mononuclear cell differentiation | 79/2622 | 426/18723 | 5.00e-03 | 3.33e-02 | 79 |
| GO:19031317 | Esophagus | ESCC | mononuclear cell differentiation | 226/8552 | 426/18723 | 1.20e-03 | 5.88e-03 | 226 |
| GO:00300984 | Esophagus | ESCC | lymphocyte differentiation | 192/8552 | 374/18723 | 1.52e-02 | 4.93e-02 | 192 |
| GO:19031311 | Lung | IAC | mononuclear cell differentiation | 66/2061 | 426/18723 | 2.63e-03 | 2.44e-02 | 66 |
| GO:19031316 | Oral cavity | OSCC | mononuclear cell differentiation | 210/7305 | 426/18723 | 8.44e-06 | 9.02e-05 | 210 |
| GO:00300983 | Oral cavity | OSCC | lymphocyte differentiation | 179/7305 | 374/18723 | 2.74e-04 | 1.74e-03 | 179 |
| GO:190313114 | Oral cavity | EOLP | mononuclear cell differentiation | 88/2218 | 426/18723 | 1.07e-07 | 3.61e-06 | 88 |
| GO:003009812 | Oral cavity | EOLP | lymphocyte differentiation | 76/2218 | 374/18723 | 1.50e-06 | 3.55e-05 | 76 |
| GO:00421132 | Oral cavity | EOLP | B cell activation | 61/2218 | 334/18723 | 3.68e-04 | 3.35e-03 | 61 |
| GO:190313122 | Oral cavity | NEOLP | mononuclear cell differentiation | 77/2005 | 426/18723 | 2.80e-06 | 6.41e-05 | 77 |
| Page: 1 2 |
| Pathway ID | Tissue | Disease Stage | Description | Gene Ratio | Bg Ratio | pvalue | p.adjust | qvalue | Count |
| Page: 1 |
Top |
Cell-cell communication analysis |
| Identification of potential cell-cell interactions between two cell types and their ligand-receptor pairs for different disease states |
| Ligand | Receptor | LRpair | Pathway | Tissue | Disease Stage |
| Page: 1 |
Top |
Single-cell gene regulatory network inference analysis |
| Find out the significant the regulons (TFs) and the target genes of each regulon across cell types for different disease states |
| TF | Cell Type | Tissue | Disease Stage | Target Gene | RSS | Regulon Activity |
| KLF6 | BAS | Skin | Healthy | NEAT1,IRF2BP2,CEBPB, etc. | 2.01e-01 |  |
| ∗The dot plots of a searched regulon are shown for all cell subpopulations in each disease state of each tissue based on the regulon specific score inferred using pySCENIC and by calculating the average expression. |
| Page: 1 |
Top |
Somatic mutation of malignant transformation related genes |
| Annotation of somatic variants for genes involved in malignant transformation |
| Hugo Symbol | Variant Class | Variant Classification | dbSNP RS | HGVSc | HGVSp | HGVSp Short | SWISSPROT | BIOTYPE | SIFT | PolyPhen | Tumor Sample Barcode | Tissue | Histology | Sex | Age | Stage | Therapy Types | Drugs | Outcome |
| KLF6 | SNV | Missense_Mutation | c.240G>C | p.Lys80Asn | p.K80N | Q99612 | protein_coding | tolerated(0.31) | benign(0) | TCGA-C8-A1HM-01 | Breast | breast invasive carcinoma | Female | >=65 | I/II | Chemotherapy | doxorubicin | CR | |
| KLF6 | SNV | Missense_Mutation | c.394G>A | p.Glu132Lys | p.E132K | Q99612 | protein_coding | tolerated(0.22) | benign(0.026) | TCGA-2W-A8YY-01 | Cervix | cervical & endocervical cancer | Female | <65 | I/II | Chemotherapy | cisplatin | CR | |
| KLF6 | SNV | Missense_Mutation | rs773677946 | c.736N>A | p.Glu246Lys | p.E246K | Q99612 | protein_coding | deleterious(0) | probably_damaging(0.998) | TCGA-C5-A2LZ-01 | Cervix | cervical & endocervical cancer | Female | >=65 | III/IV | Unknown | Unknown | PD |
| KLF6 | SNV | Missense_Mutation | c.660N>A | p.His220Gln | p.H220Q | Q99612 | protein_coding | deleterious(0) | probably_damaging(0.982) | TCGA-LP-A4AV-01 | Cervix | cervical & endocervical cancer | Female | <65 | I/II | Unknown | Unknown | SD | |
| KLF6 | SNV | Missense_Mutation | c.347N>G | p.Ser116Cys | p.S116C | Q99612 | protein_coding | tolerated(0.11) | benign(0.01) | TCGA-Q1-A73O-01 | Cervix | cervical & endocervical cancer | Female | <65 | I/II | Chemotherapy | cisplatin | CR | |
| KLF6 | SNV | Missense_Mutation | novel | c.269N>A | p.Leu90His | p.L90H | Q99612 | protein_coding | tolerated(0.21) | benign(0.174) | TCGA-AA-A00N-01 | Colorectum | colon adenocarcinoma | Male | >=65 | I/II | Unknown | Unknown | PD |
| KLF6 | SNV | Missense_Mutation | rs773677946 | c.736N>A | p.Glu246Lys | p.E246K | Q99612 | protein_coding | deleterious(0) | probably_damaging(0.998) | TCGA-CK-4952-01 | Colorectum | colon adenocarcinoma | Female | <65 | III/IV | Unknown | Unknown | SD |
| KLF6 | SNV | Missense_Mutation | c.392G>A | p.Gly131Asp | p.G131D | Q99612 | protein_coding | tolerated(0.17) | benign(0.343) | TCGA-AG-A026-01 | Colorectum | rectum adenocarcinoma | Male | >=65 | I/II | Unknown | Unknown | PD | |
| KLF6 | SNV | Missense_Mutation | rs753610916 | c.232N>A | p.Glu78Lys | p.E78K | Q99612 | protein_coding | tolerated(0.29) | benign(0) | TCGA-EI-6917-01 | Colorectum | rectum adenocarcinoma | Male | <65 | III/IV | Chemotherapy | 5fluorouracil+oxaciplatina+l-folinian | SD |
| KLF6 | SNV | Missense_Mutation | novel | c.590N>T | p.Arg197Met | p.R197M | Q99612 | protein_coding | deleterious(0) | probably_damaging(0.928) | TCGA-A5-A1OF-01 | Endometrium | uterine corpus endometrioid carcinoma | Female | <65 | I/II | Unknown | Unknown | SD |
| Page: 1 2 3 4 |
Top |
Related drugs of malignant transformation related genes |
| Identification of chemicals and drugs interact with genes involved in malignant transfromation |
| (DGIdb 4.0) |
| Entrez ID | Symbol | Category | Interaction Types | Drug Claim Name | Drug Name | PMIDs |
| Page: 1 |

Copyright 2023-Present -The University of Texas Health Science Center at Houston |