
|
|||||
|
 | |
| |
| |
| |
| |
| |
|
Gene: KLF3 |
Gene summary for KLF3 |
| Gene information | Species | Human | Gene symbol | KLF3 | Gene ID | 51274 |
| Gene name | Kruppel like factor 3 | |
| Gene Alias | BKLF | |
| Cytomap | 4p14 | |
| Gene Type | protein-coding | GO ID | GO:0000122 | UniProtAcc | A0A024R9T8 |
Top |
Malignant transformation analysis |
| Identification of the aberrant gene expression in precancerous and cancerous lesions by comparing the gene expression of stem-like cells in diseased tissues with normal stem cells |
| Entrez ID | Symbol | Replicates | Species | Organ | Tissue | Adj P-value | Log2FC | Malignancy |
| 51274 | KLF3 | HTA11_3410_2000001011 | Human | Colorectum | AD | 3.95e-08 | -4.48e-01 | 0.0155 |
| 51274 | KLF3 | HTA11_347_2000001011 | Human | Colorectum | AD | 6.26e-08 | 5.42e-01 | -0.1954 |
| 51274 | KLF3 | HTA11_411_2000001011 | Human | Colorectum | SER | 3.49e-03 | 9.36e-01 | -0.2602 |
| 51274 | KLF3 | HTA11_99999974143_84620 | Human | Colorectum | MSS | 1.44e-05 | -3.26e-01 | 0.3005 |
| 51274 | KLF3 | A015-C-203 | Human | Colorectum | FAP | 1.06e-23 | -3.81e-01 | -0.1294 |
| 51274 | KLF3 | A015-C-204 | Human | Colorectum | FAP | 4.96e-04 | -2.67e-01 | -0.0228 |
| 51274 | KLF3 | A002-C-201 | Human | Colorectum | FAP | 5.45e-07 | -2.50e-01 | 0.0324 |
| 51274 | KLF3 | A001-C-119 | Human | Colorectum | FAP | 9.37e-04 | -3.58e-01 | -0.1557 |
| 51274 | KLF3 | A001-C-108 | Human | Colorectum | FAP | 3.52e-07 | -2.09e-01 | -0.0272 |
| 51274 | KLF3 | A002-C-205 | Human | Colorectum | FAP | 1.26e-15 | -3.83e-01 | -0.1236 |
| 51274 | KLF3 | A015-C-006 | Human | Colorectum | FAP | 6.04e-10 | -3.17e-01 | -0.0994 |
| 51274 | KLF3 | A015-C-106 | Human | Colorectum | FAP | 1.48e-03 | -1.70e-01 | -0.0511 |
| 51274 | KLF3 | A002-C-114 | Human | Colorectum | FAP | 3.76e-14 | -3.73e-01 | -0.1561 |
| 51274 | KLF3 | A015-C-104 | Human | Colorectum | FAP | 6.08e-22 | -3.49e-01 | -0.1899 |
| 51274 | KLF3 | A001-C-014 | Human | Colorectum | FAP | 1.53e-11 | -3.05e-01 | 0.0135 |
| 51274 | KLF3 | A002-C-016 | Human | Colorectum | FAP | 2.93e-15 | -3.88e-01 | 0.0521 |
| 51274 | KLF3 | A015-C-002 | Human | Colorectum | FAP | 3.41e-09 | -4.41e-01 | -0.0763 |
| 51274 | KLF3 | A001-C-203 | Human | Colorectum | FAP | 8.60e-04 | -1.79e-01 | -0.0481 |
| 51274 | KLF3 | A002-C-116 | Human | Colorectum | FAP | 1.43e-25 | -4.34e-01 | -0.0452 |
| 51274 | KLF3 | A014-C-008 | Human | Colorectum | FAP | 2.03e-10 | -4.03e-01 | -0.191 |
| Page: 1 2 3 4 5 6 7 8 |
| Tissue | Expression Dynamics | Abbreviation |
| Colorectum (GSE201348) | 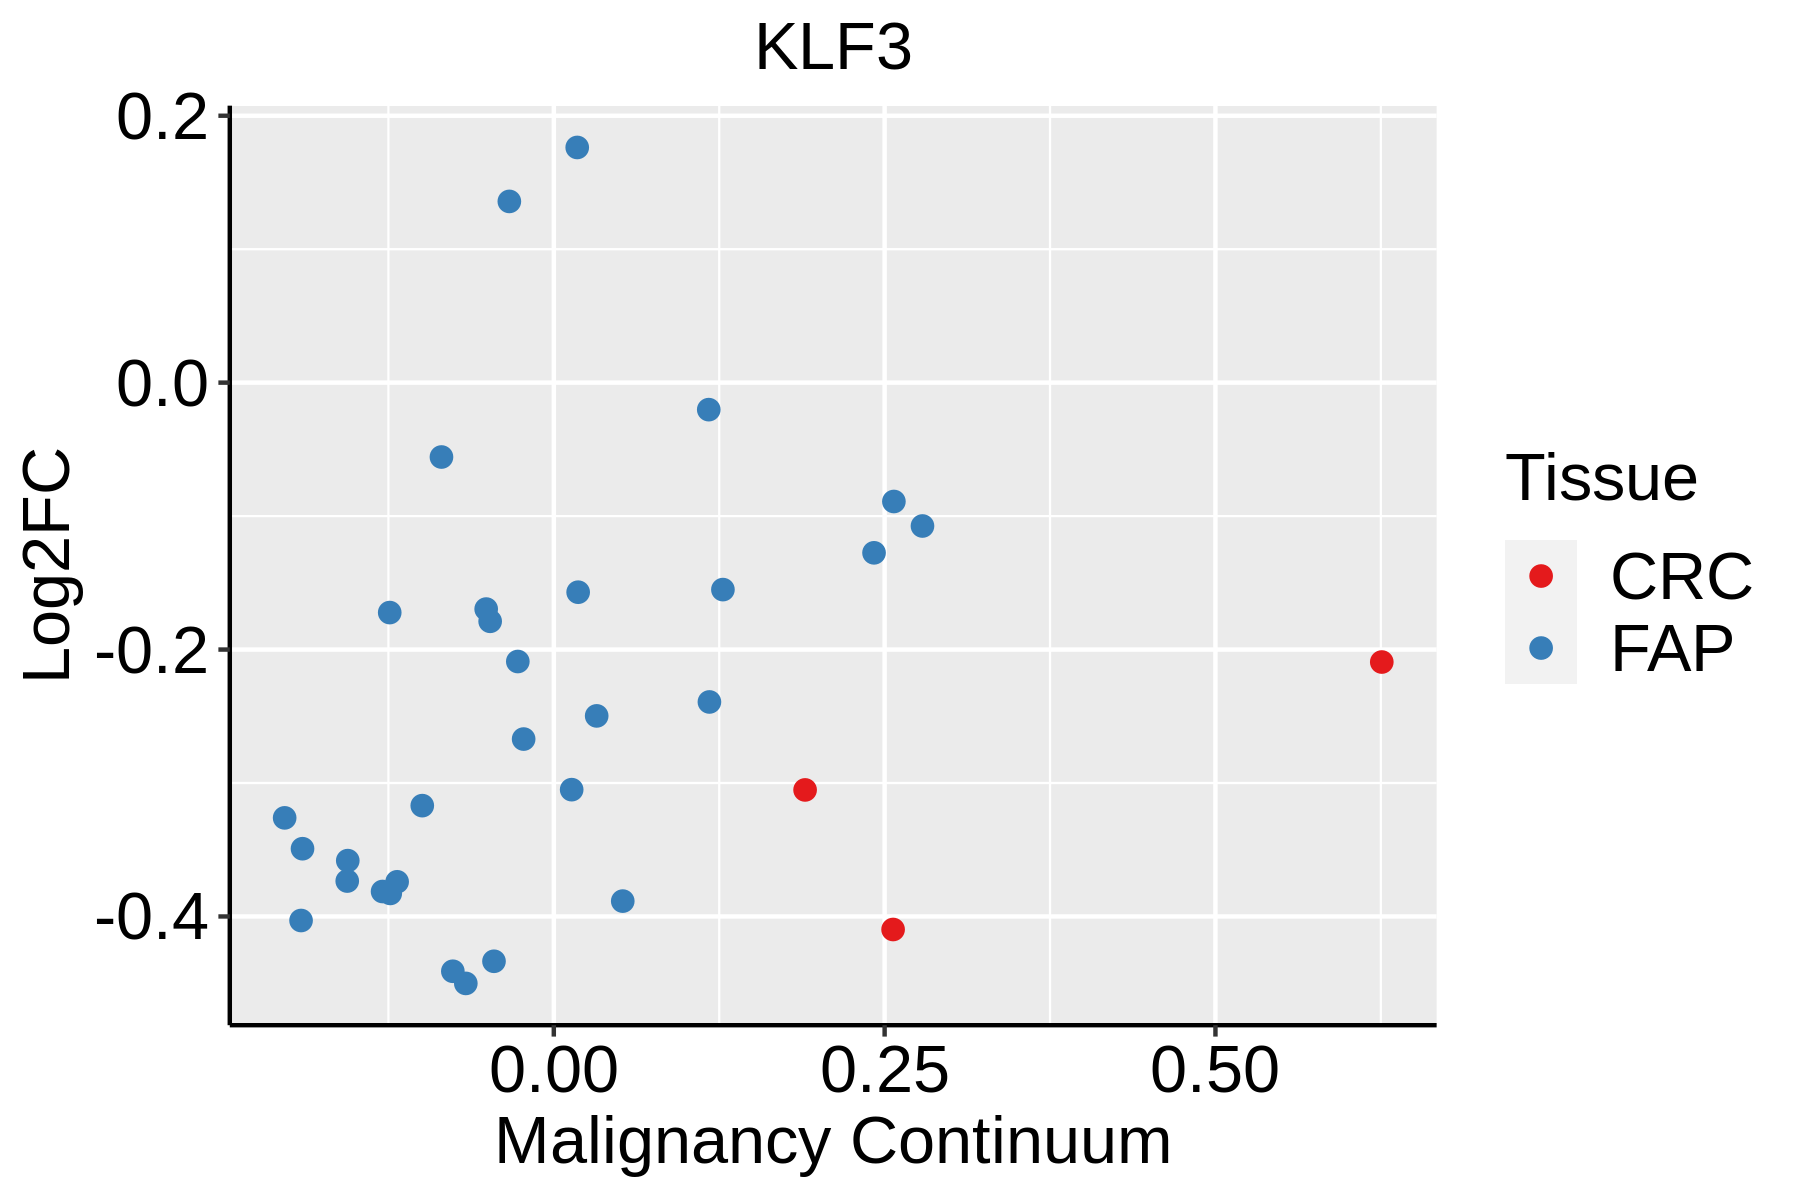 | FAP: Familial adenomatous polyposis |
| CRC: Colorectal cancer | ||
| Colorectum (HTA11) |  | AD: Adenomas |
| SER: Sessile serrated lesions | ||
| MSI-H: Microsatellite-high colorectal cancer | ||
| MSS: Microsatellite stable colorectal cancer | ||
| Esophagus |  | ESCC: Esophageal squamous cell carcinoma |
| HGIN: High-grade intraepithelial neoplasias | ||
| LGIN: Low-grade intraepithelial neoplasias | ||
| Liver |  | HCC: Hepatocellular carcinoma |
| NAFLD: Non-alcoholic fatty liver disease | ||
| Oral Cavity |  | EOLP: Erosive Oral lichen planus |
| LP: leukoplakia | ||
| NEOLP: Non-erosive oral lichen planus | ||
| OSCC: Oral squamous cell carcinoma | ||
| Prostate | 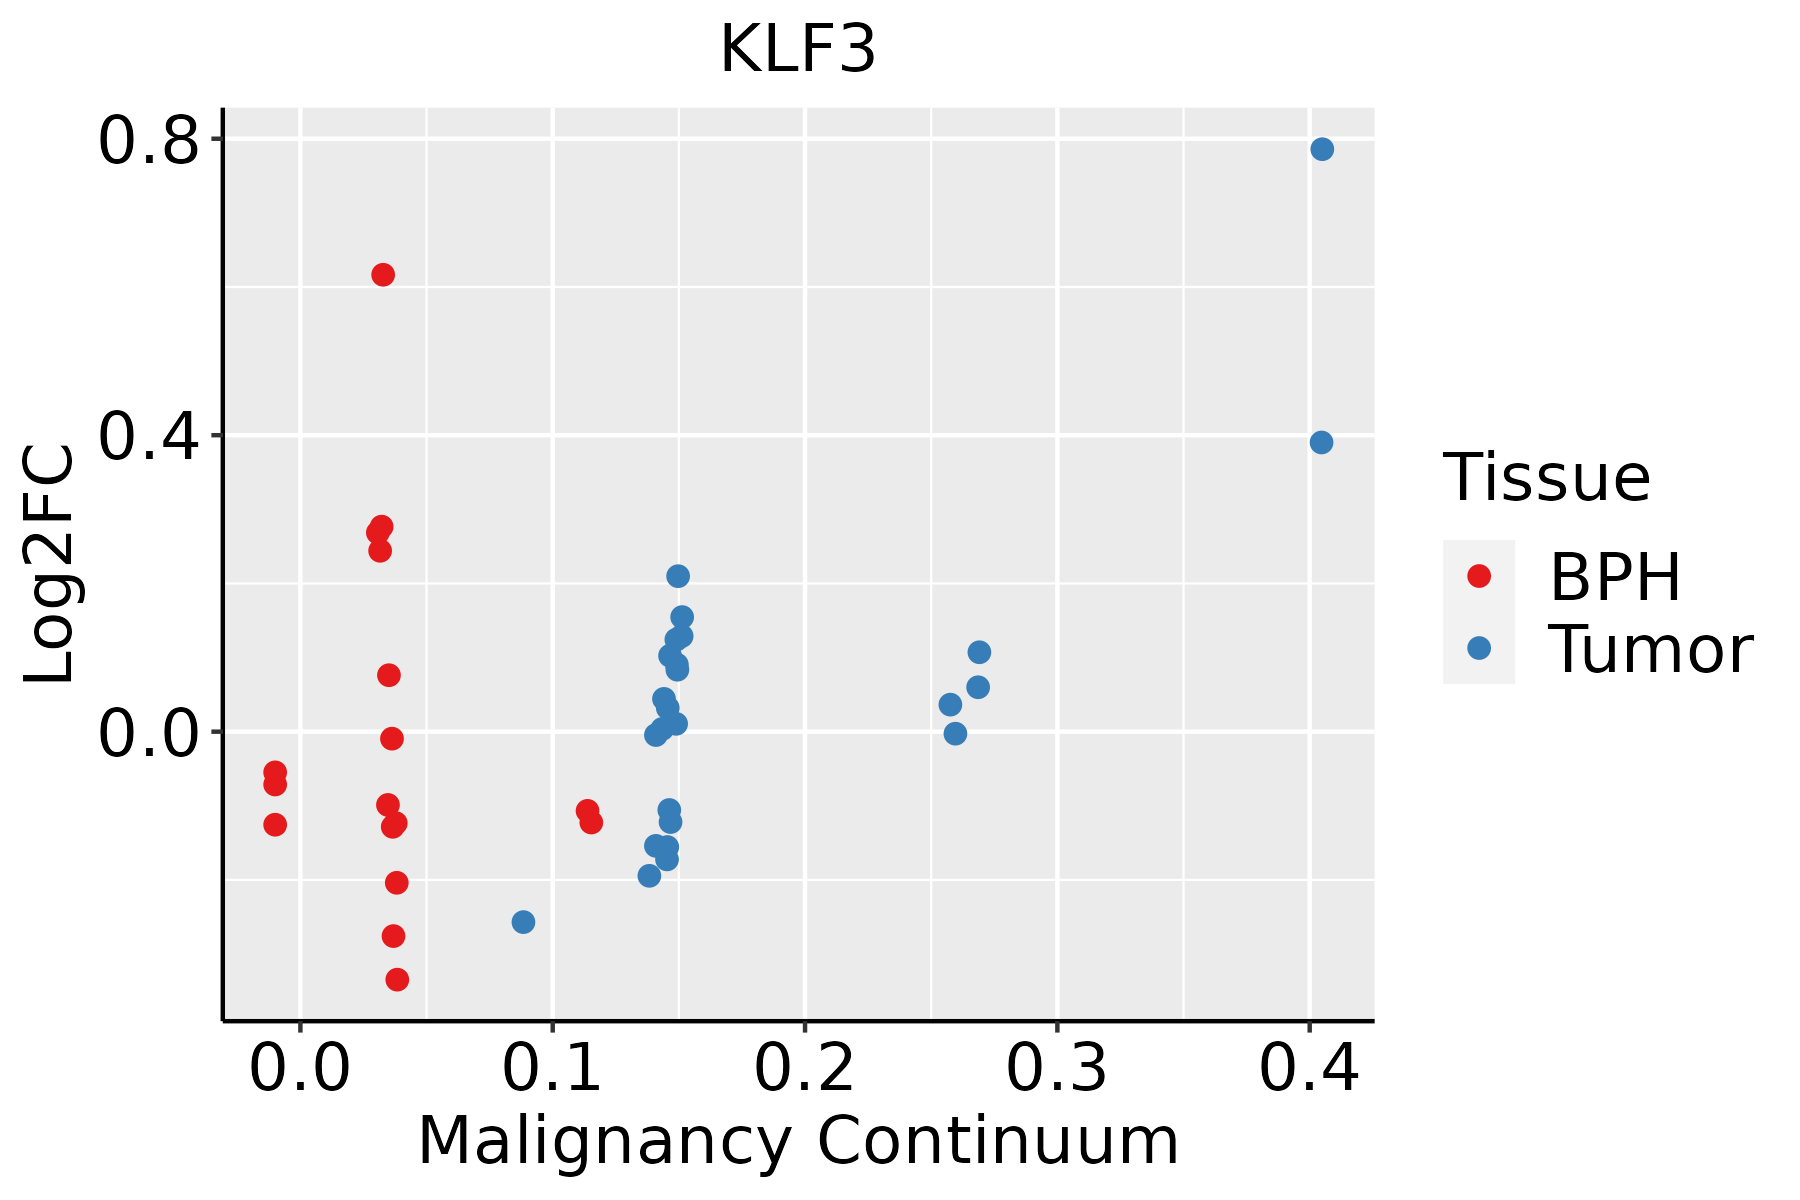 | BPH: Benign Prostatic Hyperplasia |
| Skin | 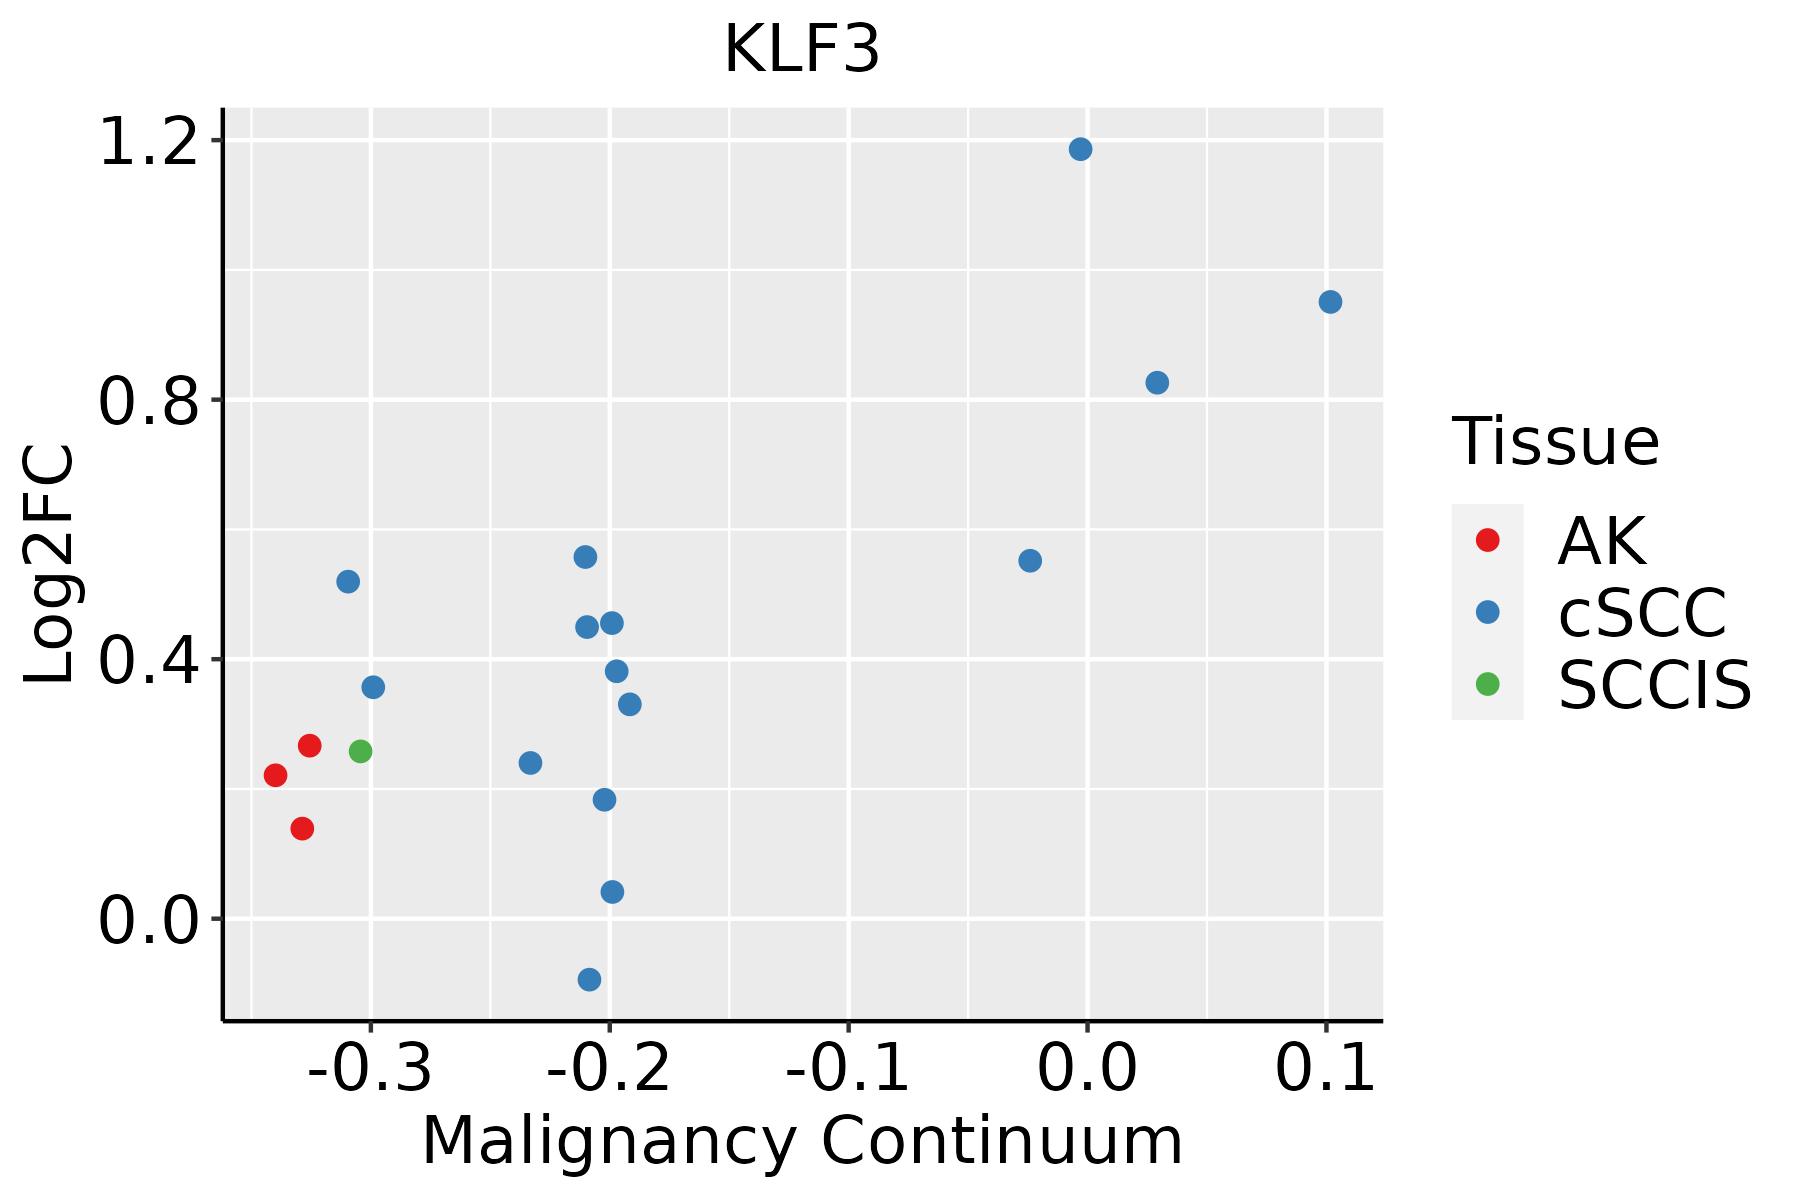 | AK: Actinic keratosis |
| cSCC: Cutaneous squamous cell carcinoma | ||
| SCCIS:squamous cell carcinoma in situ | ||
| Thyroid | 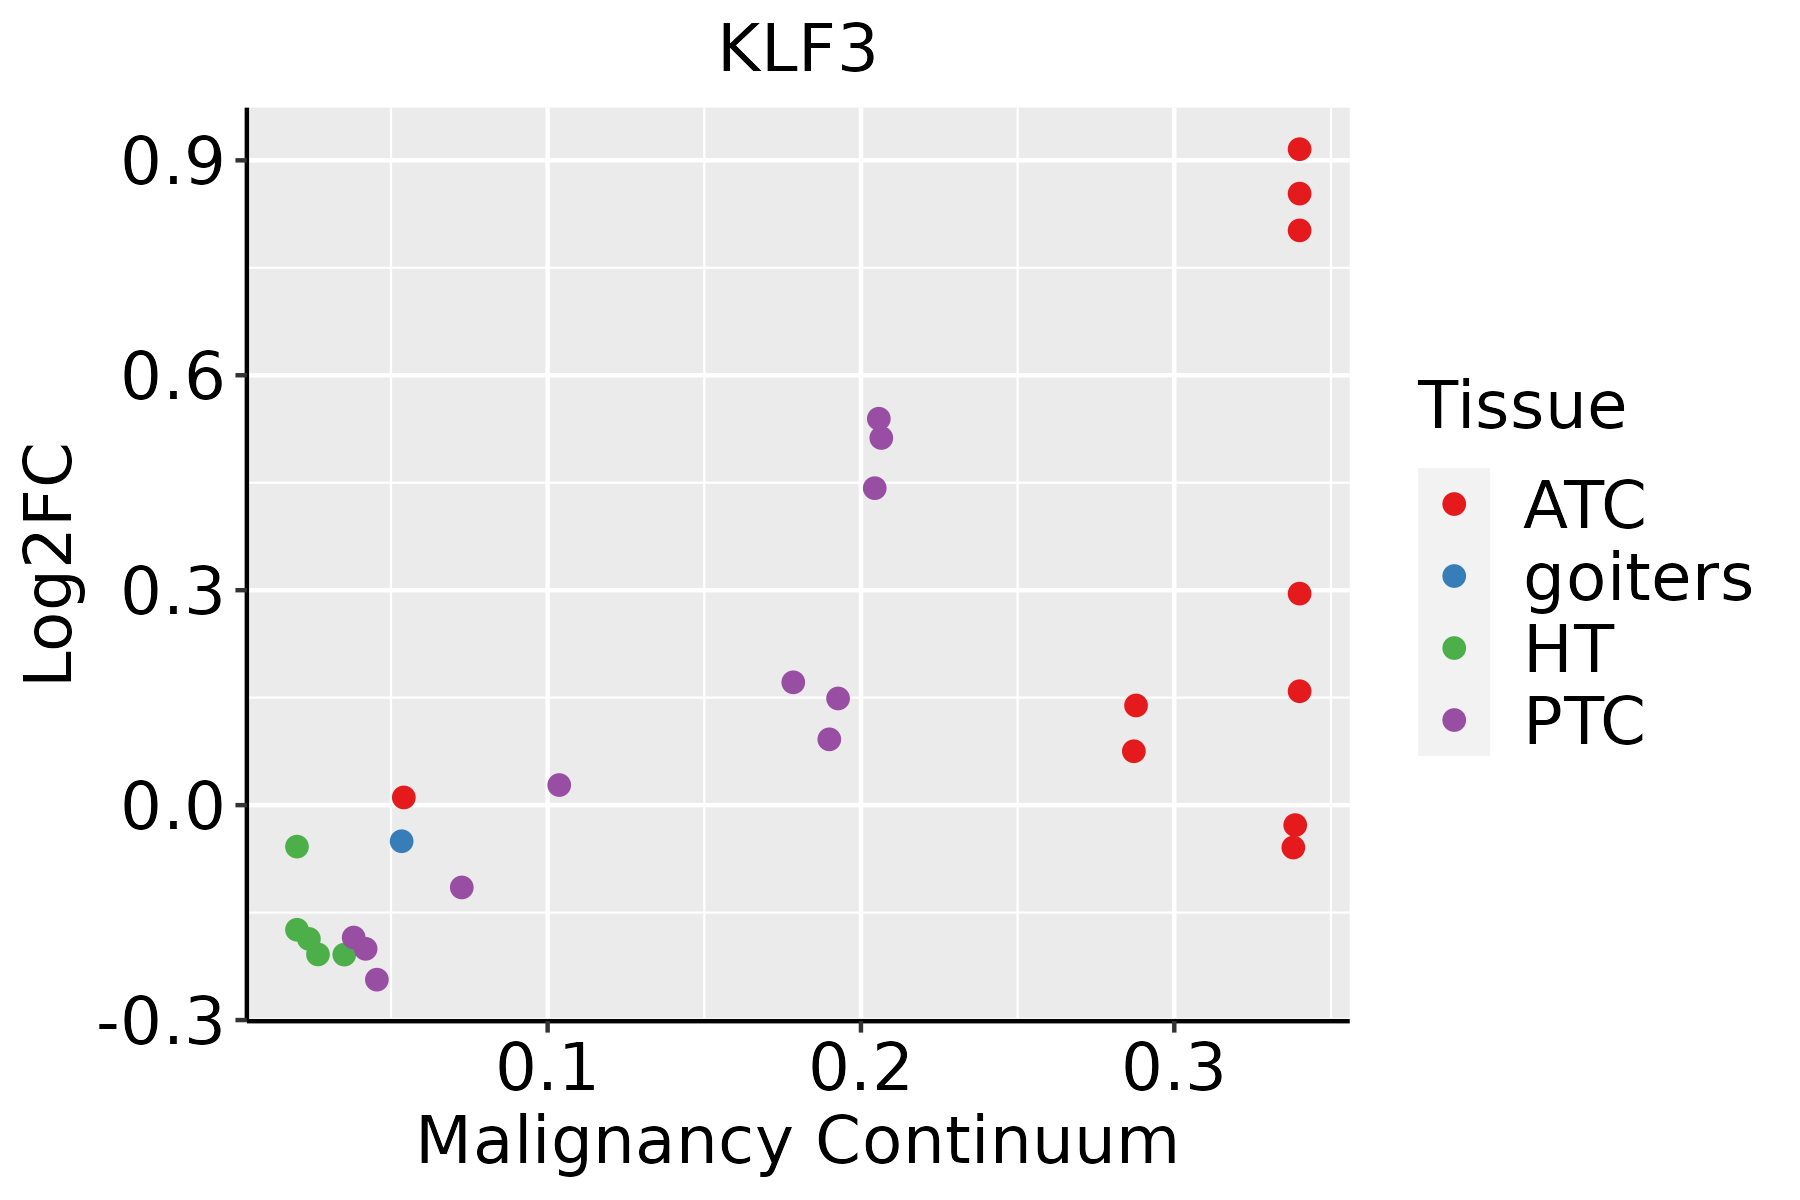 | ATC: Anaplastic thyroid cancer |
| HT: Hashimoto's thyroiditis | ||
| PTC: Papillary thyroid cancer |
| ∗log2FC in expression of this searched gene in stem-like cells from each diseased tissue sample relative to stem-like cells in normal samples in each tissue plotted against the malignancy continuum. Samples are colored based on if they are from different disease stage. |
Top |
Malignant transformation related pathway analysis |
| Find out the enriched GO biological processes and KEGG pathways involved in transition from healthy to precancer to cancer |
| Tissue | Disease Stage | Enriched GO biological Processes |
| Colorectum | AD |  |
| Colorectum | SER |  |
| Colorectum | MSS |  |
| Colorectum | MSI-H |  |
| Colorectum | FAP |  |
| ∗Top 15 enriched GO BP terms are showed in the bar plot of each disease state in each tissue. Each row represents a significant GO biological process which is colored according to the -log10(p.adjust). |
| Page: 1 2 3 4 5 6 7 8 9 |
| GO ID | Tissue | Disease Stage | Description | Gene Ratio | Bg Ratio | pvalue | p.adjust | Count |
| GO:1901653 | Colorectum | AD | cellular response to peptide | 114/3918 | 359/18723 | 8.32e-07 | 2.88e-05 | 114 |
| GO:19016531 | Colorectum | SER | cellular response to peptide | 83/2897 | 359/18723 | 8.03e-05 | 1.77e-03 | 83 |
| GO:19016532 | Colorectum | MSS | cellular response to peptide | 91/3467 | 359/18723 | 7.38e-04 | 7.88e-03 | 91 |
| GO:19016533 | Colorectum | FAP | cellular response to peptide | 89/2622 | 359/18723 | 2.93e-08 | 2.64e-06 | 89 |
| GO:19016534 | Colorectum | CRC | cellular response to peptide | 64/2078 | 359/18723 | 8.54e-05 | 1.75e-03 | 64 |
| GO:190165319 | Esophagus | ESCC | cellular response to peptide | 208/8552 | 359/18723 | 1.68e-06 | 2.01e-05 | 208 |
| GO:190165311 | Liver | Cirrhotic | cellular response to peptide | 129/4634 | 359/18723 | 1.23e-06 | 2.49e-05 | 129 |
| GO:190165321 | Liver | HCC | cellular response to peptide | 211/7958 | 359/18723 | 2.86e-10 | 9.63e-09 | 211 |
| GO:190165316 | Oral cavity | OSCC | cellular response to peptide | 194/7305 | 359/18723 | 4.31e-09 | 9.57e-08 | 194 |
| GO:190165317 | Oral cavity | LP | cellular response to peptide | 122/4623 | 359/18723 | 4.22e-05 | 6.10e-04 | 122 |
| GO:190165323 | Oral cavity | EOLP | cellular response to peptide | 85/2218 | 359/18723 | 2.06e-10 | 2.06e-08 | 85 |
| GO:190165310 | Prostate | BPH | cellular response to peptide | 104/3107 | 359/18723 | 2.51e-09 | 1.00e-07 | 104 |
| GO:190165315 | Prostate | Tumor | cellular response to peptide | 104/3246 | 359/18723 | 2.71e-08 | 8.90e-07 | 104 |
| GO:190165320 | Skin | AK | cellular response to peptide | 61/1910 | 359/18723 | 4.60e-05 | 7.21e-04 | 61 |
| GO:1901653110 | Skin | cSCC | cellular response to peptide | 124/4864 | 359/18723 | 1.75e-04 | 1.49e-03 | 124 |
| GO:1901653111 | Thyroid | PTC | cellular response to peptide | 169/5968 | 359/18723 | 9.81e-10 | 2.89e-08 | 169 |
| GO:190165325 | Thyroid | ATC | cellular response to peptide | 173/6293 | 359/18723 | 5.87e-09 | 1.28e-07 | 173 |
| Page: 1 |
| Pathway ID | Tissue | Disease Stage | Description | Gene Ratio | Bg Ratio | pvalue | p.adjust | qvalue | Count |
| hsa05202 | Colorectum | FAP | Transcriptional misregulation in cancer | 45/1404 | 193/8465 | 9.19e-03 | 3.33e-02 | 2.03e-02 | 45 |
| hsa052021 | Colorectum | FAP | Transcriptional misregulation in cancer | 45/1404 | 193/8465 | 9.19e-03 | 3.33e-02 | 2.03e-02 | 45 |
| hsa052028 | Esophagus | ESCC | Transcriptional misregulation in cancer | 116/4205 | 193/8465 | 2.08e-03 | 5.95e-03 | 3.05e-03 | 116 |
| hsa0520213 | Esophagus | ESCC | Transcriptional misregulation in cancer | 116/4205 | 193/8465 | 2.08e-03 | 5.95e-03 | 3.05e-03 | 116 |
| hsa052027 | Prostate | BPH | Transcriptional misregulation in cancer | 53/1718 | 193/8465 | 9.56e-03 | 2.92e-02 | 1.81e-02 | 53 |
| hsa0520212 | Prostate | BPH | Transcriptional misregulation in cancer | 53/1718 | 193/8465 | 9.56e-03 | 2.92e-02 | 1.81e-02 | 53 |
| hsa0520221 | Prostate | Tumor | Transcriptional misregulation in cancer | 59/1791 | 193/8465 | 1.22e-03 | 5.26e-03 | 3.26e-03 | 59 |
| hsa0520231 | Prostate | Tumor | Transcriptional misregulation in cancer | 59/1791 | 193/8465 | 1.22e-03 | 5.26e-03 | 3.26e-03 | 59 |
| Page: 1 |
Top |
Cell-cell communication analysis |
| Identification of potential cell-cell interactions between two cell types and their ligand-receptor pairs for different disease states |
| Ligand | Receptor | LRpair | Pathway | Tissue | Disease Stage |
| Page: 1 |
Top |
Single-cell gene regulatory network inference analysis |
| Find out the significant the regulons (TFs) and the target genes of each regulon across cell types for different disease states |
| TF | Cell Type | Tissue | Disease Stage | Target Gene | RSS | Regulon Activity |
| KLF3 | INMON | Esophagus | ADJ | DVL1,PWAR6,RP5-1021I20.1, etc. | 5.15e-02 |  |
| KLF3 | DUCT1 | Pancreas | PDAC | AC015912.3,SNHG17,CCDC68, etc. | 6.33e-01 |  |
| KLF3 | CD8TEXP | Stomach | GC | SELL,AES,CD55, etc. | 1.60e-01 |  |
| ∗The dot plots of a searched regulon are shown for all cell subpopulations in each disease state of each tissue based on the regulon specific score inferred using pySCENIC and by calculating the average expression. |
| Page: 1 |
Top |
Somatic mutation of malignant transformation related genes |
| Annotation of somatic variants for genes involved in malignant transformation |
| Hugo Symbol | Variant Class | Variant Classification | dbSNP RS | HGVSc | HGVSp | HGVSp Short | SWISSPROT | BIOTYPE | SIFT | PolyPhen | Tumor Sample Barcode | Tissue | Histology | Sex | Age | Stage | Therapy Types | Drugs | Outcome |
| KLF3 | SNV | Missense_Mutation | rs773018621 | c.967N>T | p.Pro323Ser | p.P323S | P57682 | protein_coding | tolerated(0.06) | possibly_damaging(0.613) | TCGA-B6-A0I9-01 | Breast | breast invasive carcinoma | Female | <65 | III/IV | Unknown | Unknown | PD |
| KLF3 | SNV | Missense_Mutation | c.130N>A | p.Glu44Lys | p.E44K | P57682 | protein_coding | tolerated(0.42) | benign(0.003) | TCGA-B6-A0IK-01 | Breast | breast invasive carcinoma | Female | <65 | III/IV | Unknown | Unknown | PD | |
| KLF3 | insertion | Frame_Shift_Ins | novel | c.404_405insCTCCAGCCTGAGTAACAGTGAGACCCTATCTCAAA | p.Ile136SerfsTer61 | p.I136Sfs*61 | P57682 | protein_coding | TCGA-BH-A0DP-01 | Breast | breast invasive carcinoma | Female | <65 | I/II | Hormone Therapy | arimidex | SD | ||
| KLF3 | insertion | Nonsense_Mutation | novel | c.391_392insAAGTGTCTGAATATGGTAGCAACTGAGCAATAAGGATTTTAT | p.Leu131delinsGlnValSerGluTyrGlySerAsnTerAlaIleArgIleLeuPhe | p.L131delinsQVSEYGSN*AIRILF | P57682 | protein_coding | TCGA-BH-A0HU-01 | Breast | breast invasive carcinoma | Female | <65 | I/II | Chemotherapy | docetaxel | SD | ||
| KLF3 | deletion | Frame_Shift_Del | novel | c.85delN | p.Met29Ter | p.M29* | P57682 | protein_coding | TCGA-D8-A27V-01 | Breast | breast invasive carcinoma | Female | <65 | I/II | Hormone Therapy | tamoxiphen | SD | ||
| KLF3 | SNV | Missense_Mutation | rs183262895 | c.770N>A | p.Arg257Gln | p.R257Q | P57682 | protein_coding | deleterious(0) | probably_damaging(0.982) | TCGA-C5-A7CH-01 | Cervix | cervical & endocervical cancer | Female | <65 | I/II | Unspecific | SD | |
| KLF3 | SNV | Missense_Mutation | c.1022G>A | p.Arg341His | p.R341H | P57682 | protein_coding | deleterious(0) | benign(0.073) | TCGA-AA-3663-01 | Colorectum | colon adenocarcinoma | Male | <65 | I/II | Unknown | Unknown | SD | |
| KLF3 | SNV | Missense_Mutation | c.769C>T | p.Arg257Trp | p.R257W | P57682 | protein_coding | deleterious(0) | probably_damaging(0.996) | TCGA-AA-3814-01 | Colorectum | colon adenocarcinoma | Female | >=65 | I/II | Unknown | Unknown | SD | |
| KLF3 | SNV | Missense_Mutation | novel | c.1010N>G | p.Leu337Arg | p.L337R | P57682 | protein_coding | deleterious(0) | benign(0.211) | TCGA-AA-3930-01 | Colorectum | colon adenocarcinoma | Male | >=65 | III/IV | Chemotherapy | capecitabine | PD |
| KLF3 | SNV | Missense_Mutation | c.1022N>A | p.Arg341His | p.R341H | P57682 | protein_coding | deleterious(0) | benign(0.073) | TCGA-AD-6895-01 | Colorectum | colon adenocarcinoma | Male | >=65 | III/IV | Unknown | Unknown | SD |
| Page: 1 2 3 4 5 6 7 |
Top |
Related drugs of malignant transformation related genes |
| Identification of chemicals and drugs interact with genes involved in malignant transfromation |
| (DGIdb 4.0) |
| Entrez ID | Symbol | Category | Interaction Types | Drug Claim Name | Drug Name | PMIDs |
| Page: 1 |

Copyright 2023-Present -The University of Texas Health Science Center at Houston |