
|
|||||
|
 | |
| |
| |
| |
| |
| |
|
Gene: KLF2 |
Gene summary for KLF2 |
| Gene information | Species | Human | Gene symbol | KLF2 | Gene ID | 10365 |
| Gene name | Kruppel like factor 2 | |
| Gene Alias | LKLF | |
| Cytomap | 19p13.11 | |
| Gene Type | protein-coding | GO ID | GO:0000122 | UniProtAcc | Q9Y5W3 |
Top |
Malignant transformation analysis |
| Identification of the aberrant gene expression in precancerous and cancerous lesions by comparing the gene expression of stem-like cells in diseased tissues with normal stem cells |
| Entrez ID | Symbol | Replicates | Species | Organ | Tissue | Adj P-value | Log2FC | Malignancy |
| 10365 | KLF2 | LZE5T | Human | Esophagus | ESCC | 7.41e-04 | 1.32e-01 | 0.0514 |
| 10365 | KLF2 | LZE24T | Human | Esophagus | ESCC | 5.85e-03 | 1.36e-01 | 0.0596 |
| 10365 | KLF2 | P2T-E | Human | Esophagus | ESCC | 7.66e-04 | 3.37e-01 | 0.1177 |
| 10365 | KLF2 | P4T-E | Human | Esophagus | ESCC | 1.95e-15 | 1.06e+00 | 0.1323 |
| 10365 | KLF2 | P8T-E | Human | Esophagus | ESCC | 1.46e-06 | 5.70e-01 | 0.0889 |
| 10365 | KLF2 | P9T-E | Human | Esophagus | ESCC | 3.04e-04 | 6.57e-01 | 0.1131 |
| 10365 | KLF2 | P11T-E | Human | Esophagus | ESCC | 8.02e-07 | 8.69e-01 | 0.1426 |
| 10365 | KLF2 | P16T-E | Human | Esophagus | ESCC | 5.26e-08 | -8.60e-02 | 0.1153 |
| 10365 | KLF2 | P21T-E | Human | Esophagus | ESCC | 6.23e-06 | -7.45e-02 | 0.1617 |
| 10365 | KLF2 | P22T-E | Human | Esophagus | ESCC | 2.81e-08 | -1.03e-01 | 0.1236 |
| 10365 | KLF2 | P26T-E | Human | Esophagus | ESCC | 5.20e-07 | -1.94e-01 | 0.1276 |
| 10365 | KLF2 | P28T-E | Human | Esophagus | ESCC | 1.75e-02 | 5.81e-02 | 0.1149 |
| 10365 | KLF2 | P42T-E | Human | Esophagus | ESCC | 1.53e-05 | 4.72e-01 | 0.1175 |
| 10365 | KLF2 | P48T-E | Human | Esophagus | ESCC | 4.38e-06 | -7.11e-02 | 0.0959 |
| 10365 | KLF2 | P57T-E | Human | Esophagus | ESCC | 1.40e-02 | 1.33e-01 | 0.0926 |
| 10365 | KLF2 | P61T-E | Human | Esophagus | ESCC | 4.12e-07 | 3.33e-01 | 0.099 |
| 10365 | KLF2 | P62T-E | Human | Esophagus | ESCC | 4.08e-05 | 1.44e-01 | 0.1302 |
| 10365 | KLF2 | P75T-E | Human | Esophagus | ESCC | 2.26e-03 | -1.29e-01 | 0.1125 |
| 10365 | KLF2 | P76T-E | Human | Esophagus | ESCC | 1.47e-05 | -1.34e-01 | 0.1207 |
| 10365 | KLF2 | P79T-E | Human | Esophagus | ESCC | 2.25e-03 | -1.16e-01 | 0.1154 |
| Page: 1 2 3 4 5 |
| Tissue | Expression Dynamics | Abbreviation |
| Esophagus | 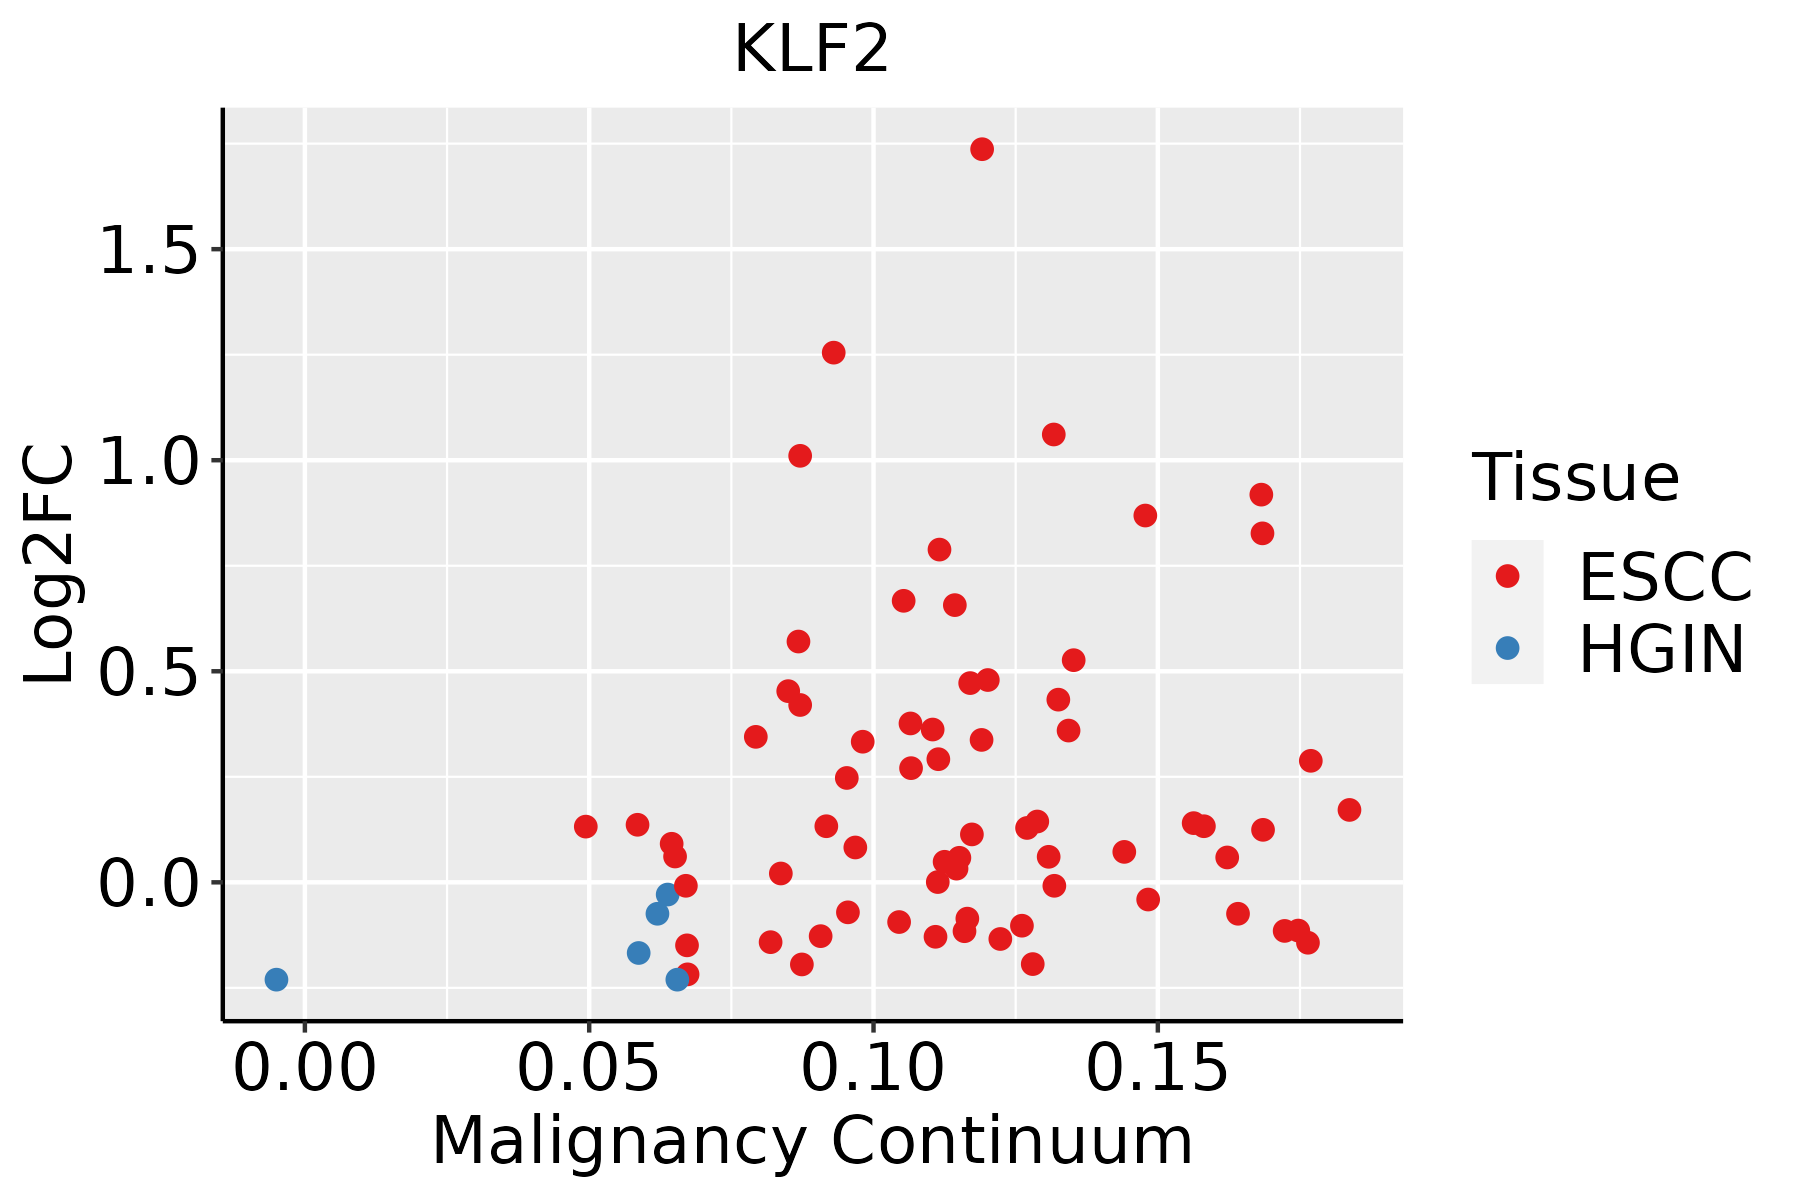 | ESCC: Esophageal squamous cell carcinoma |
| HGIN: High-grade intraepithelial neoplasias | ||
| LGIN: Low-grade intraepithelial neoplasias | ||
| GC | 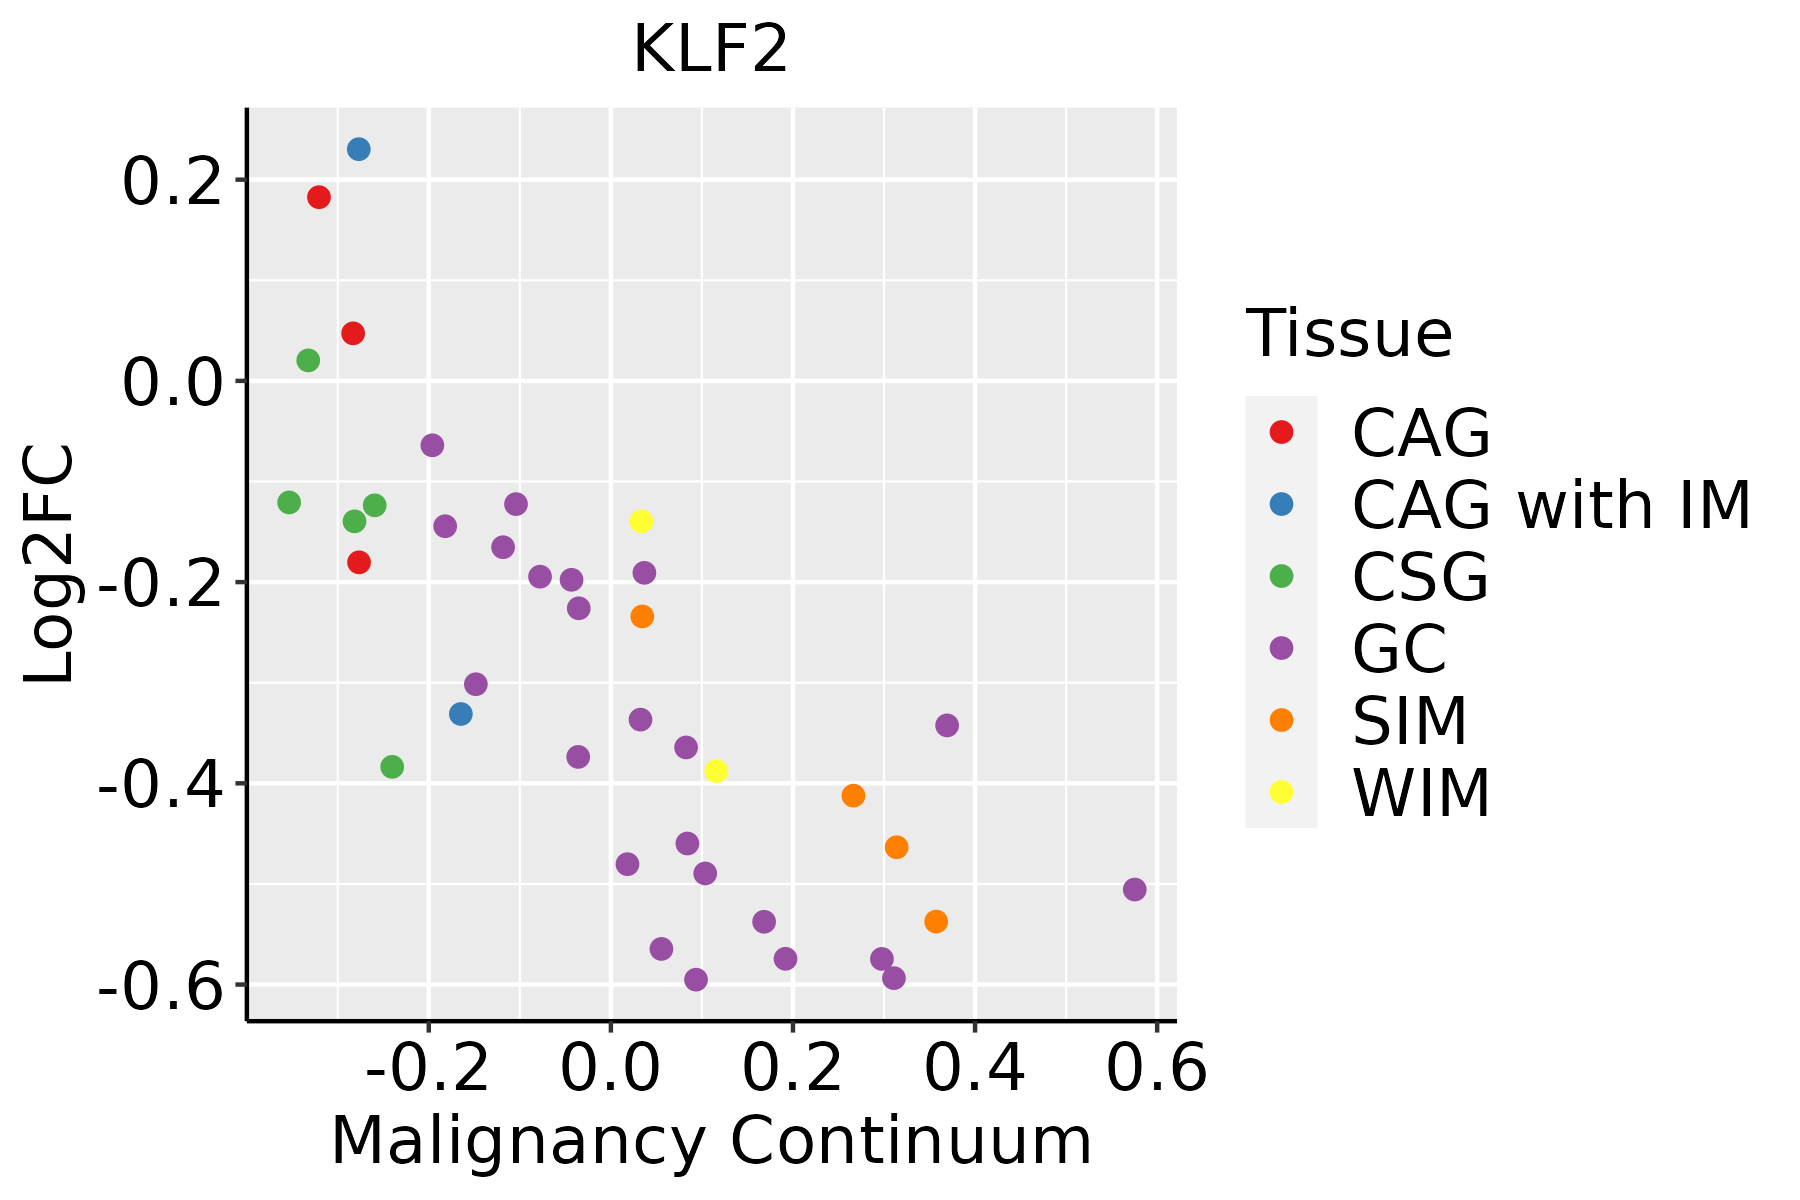 | CAG: Chronic atrophic gastritis |
| CAG with IM: Chronic atrophic gastritis with intestinal metaplasia | ||
| CSG: Chronic superficial gastritis | ||
| GC: Gastric cancer | ||
| SIM: Severe intestinal metaplasia | ||
| WIM: Wild intestinal metaplasia | ||
| Liver | 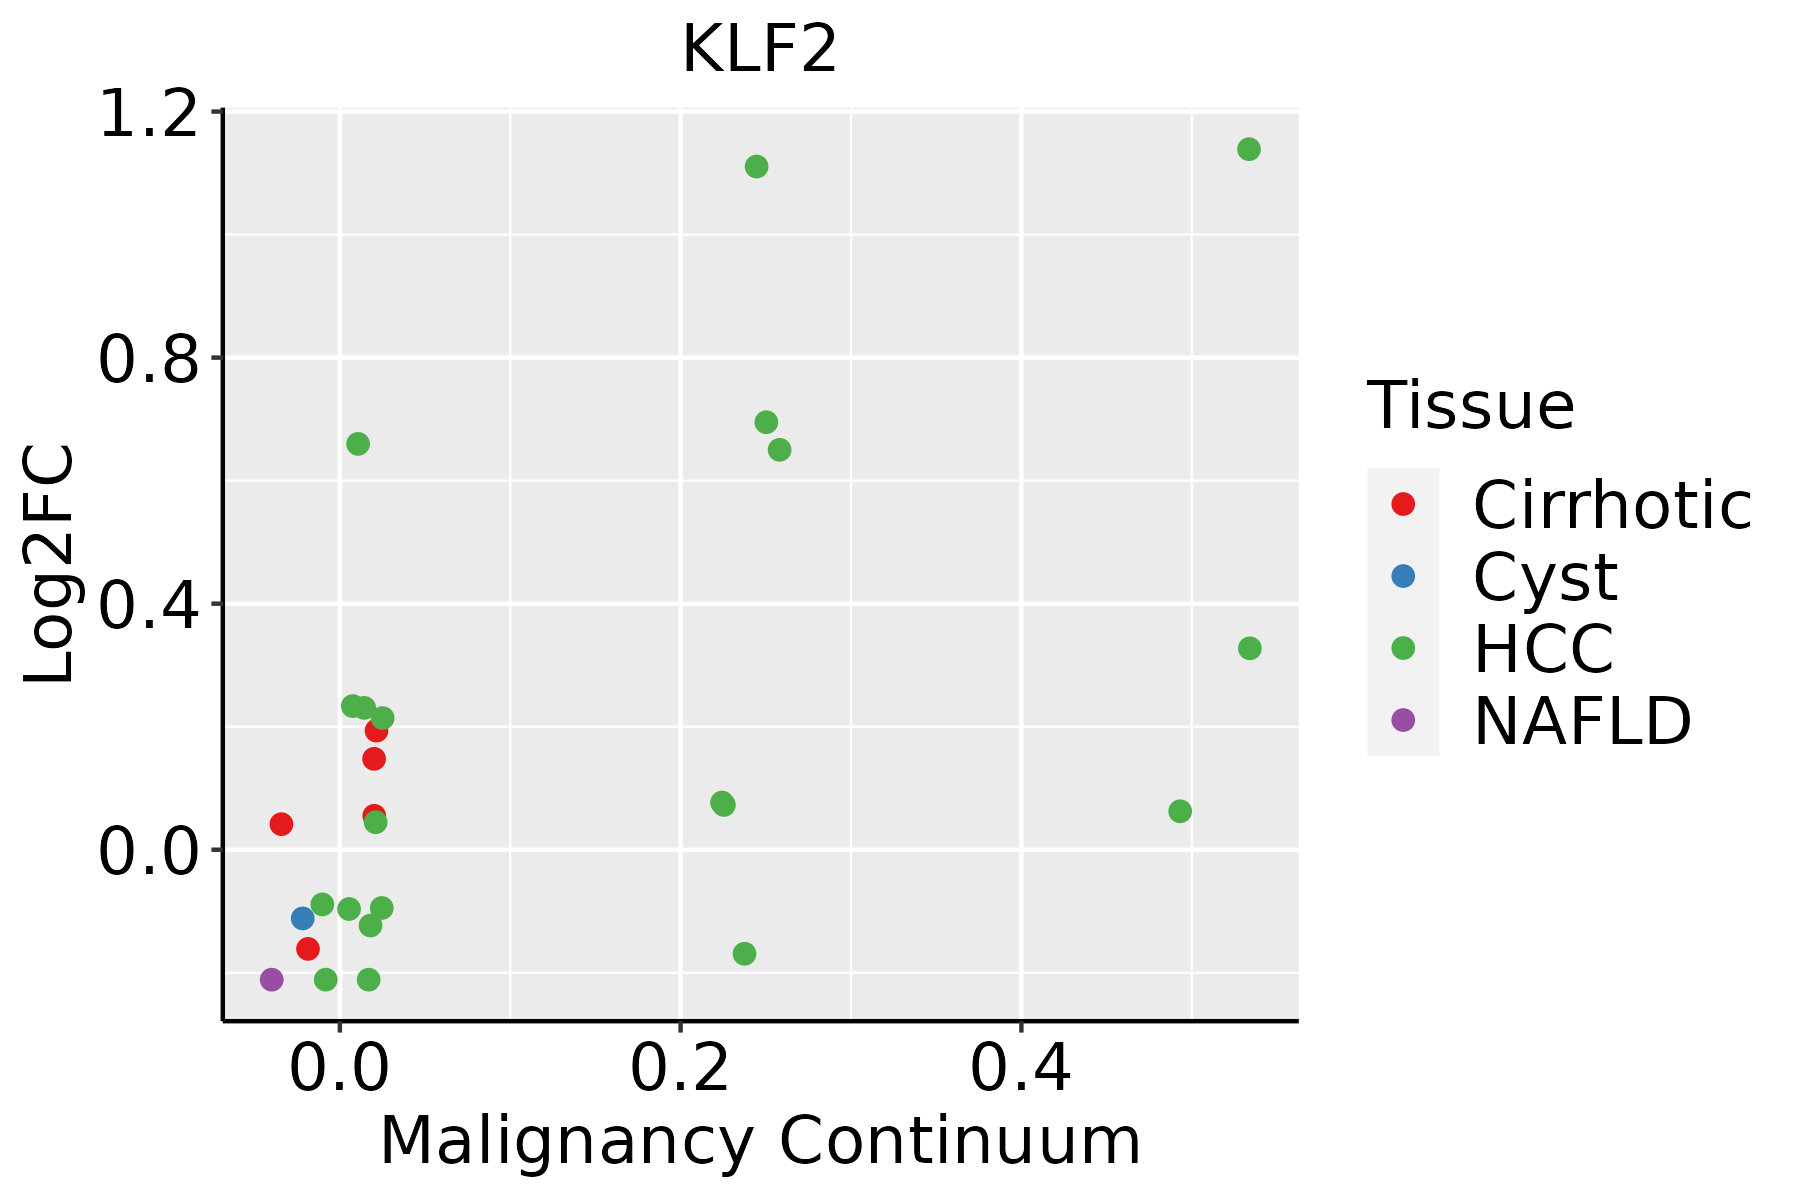 | HCC: Hepatocellular carcinoma |
| NAFLD: Non-alcoholic fatty liver disease | ||
| Oral Cavity | 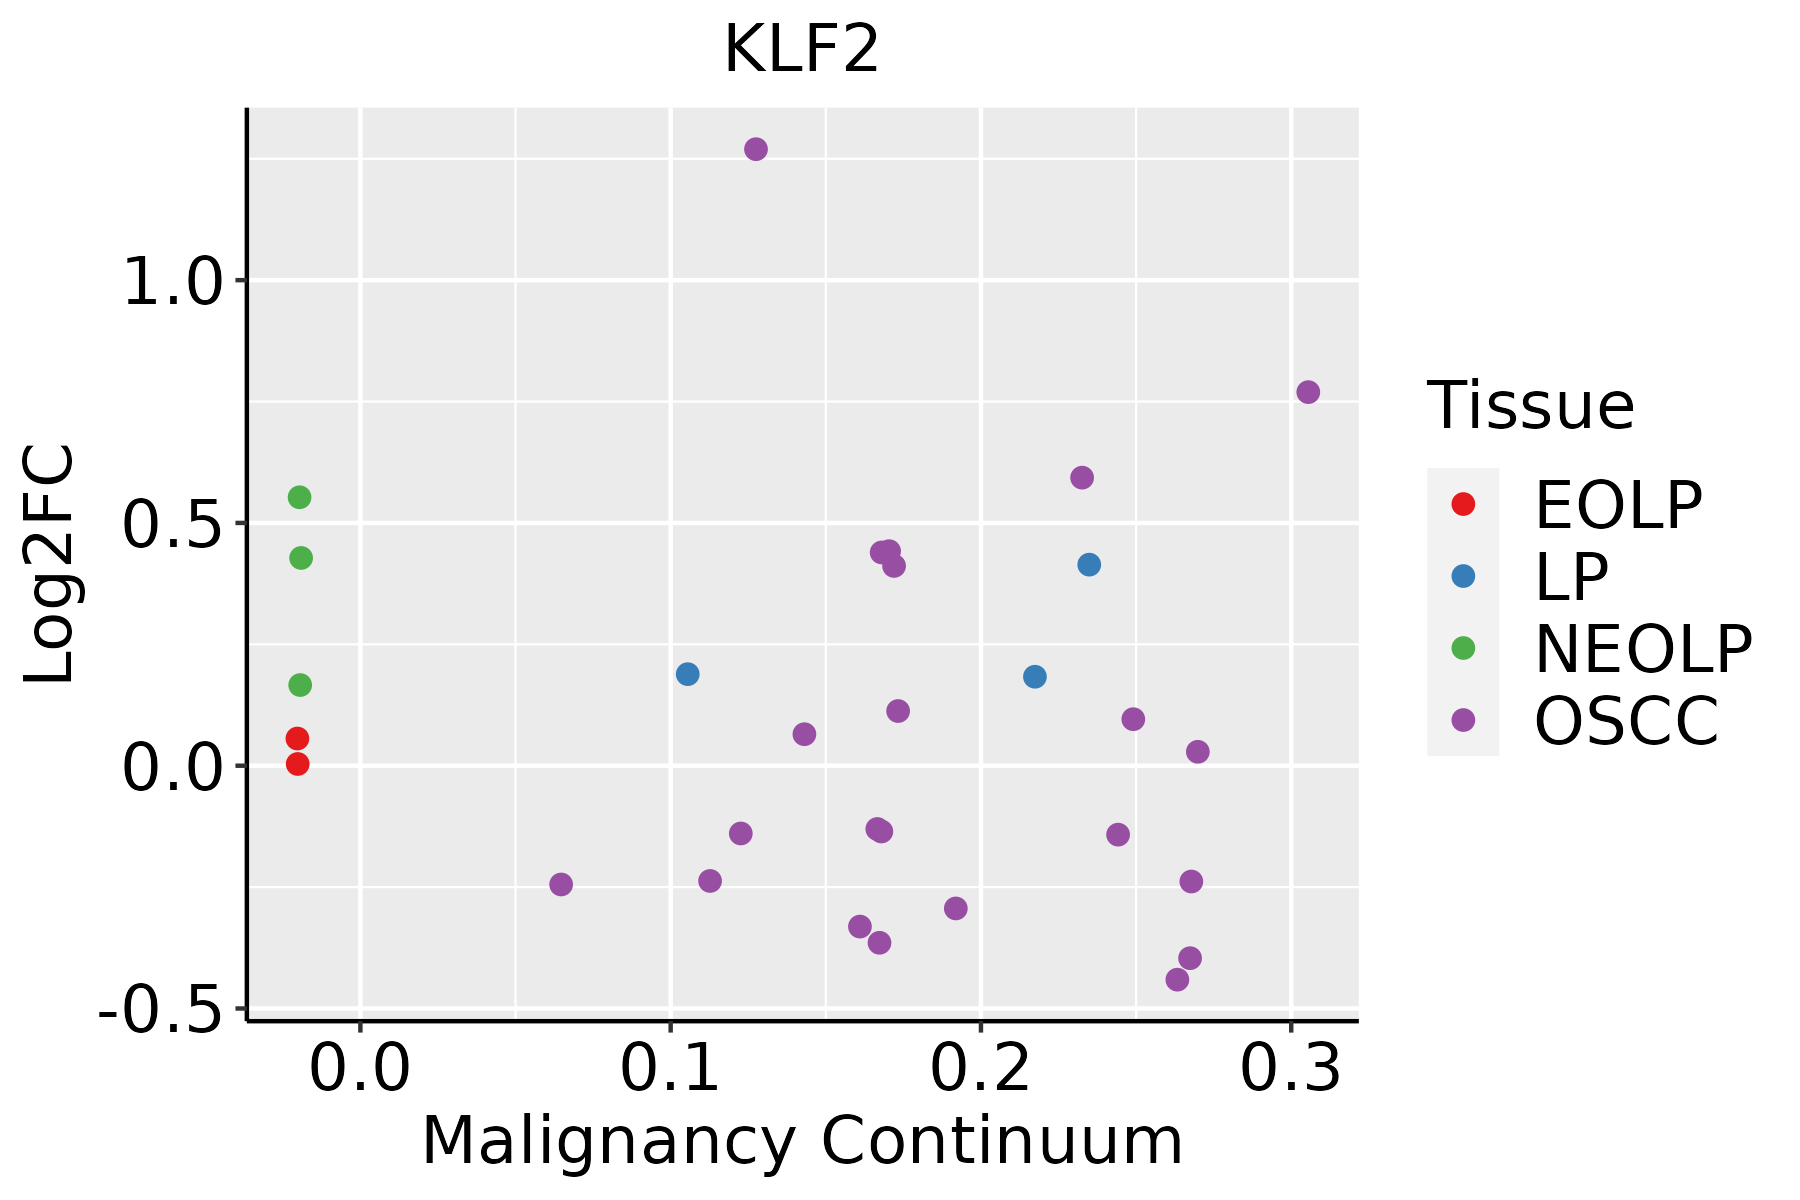 | EOLP: Erosive Oral lichen planus |
| LP: leukoplakia | ||
| NEOLP: Non-erosive oral lichen planus | ||
| OSCC: Oral squamous cell carcinoma | ||
| Prostate | 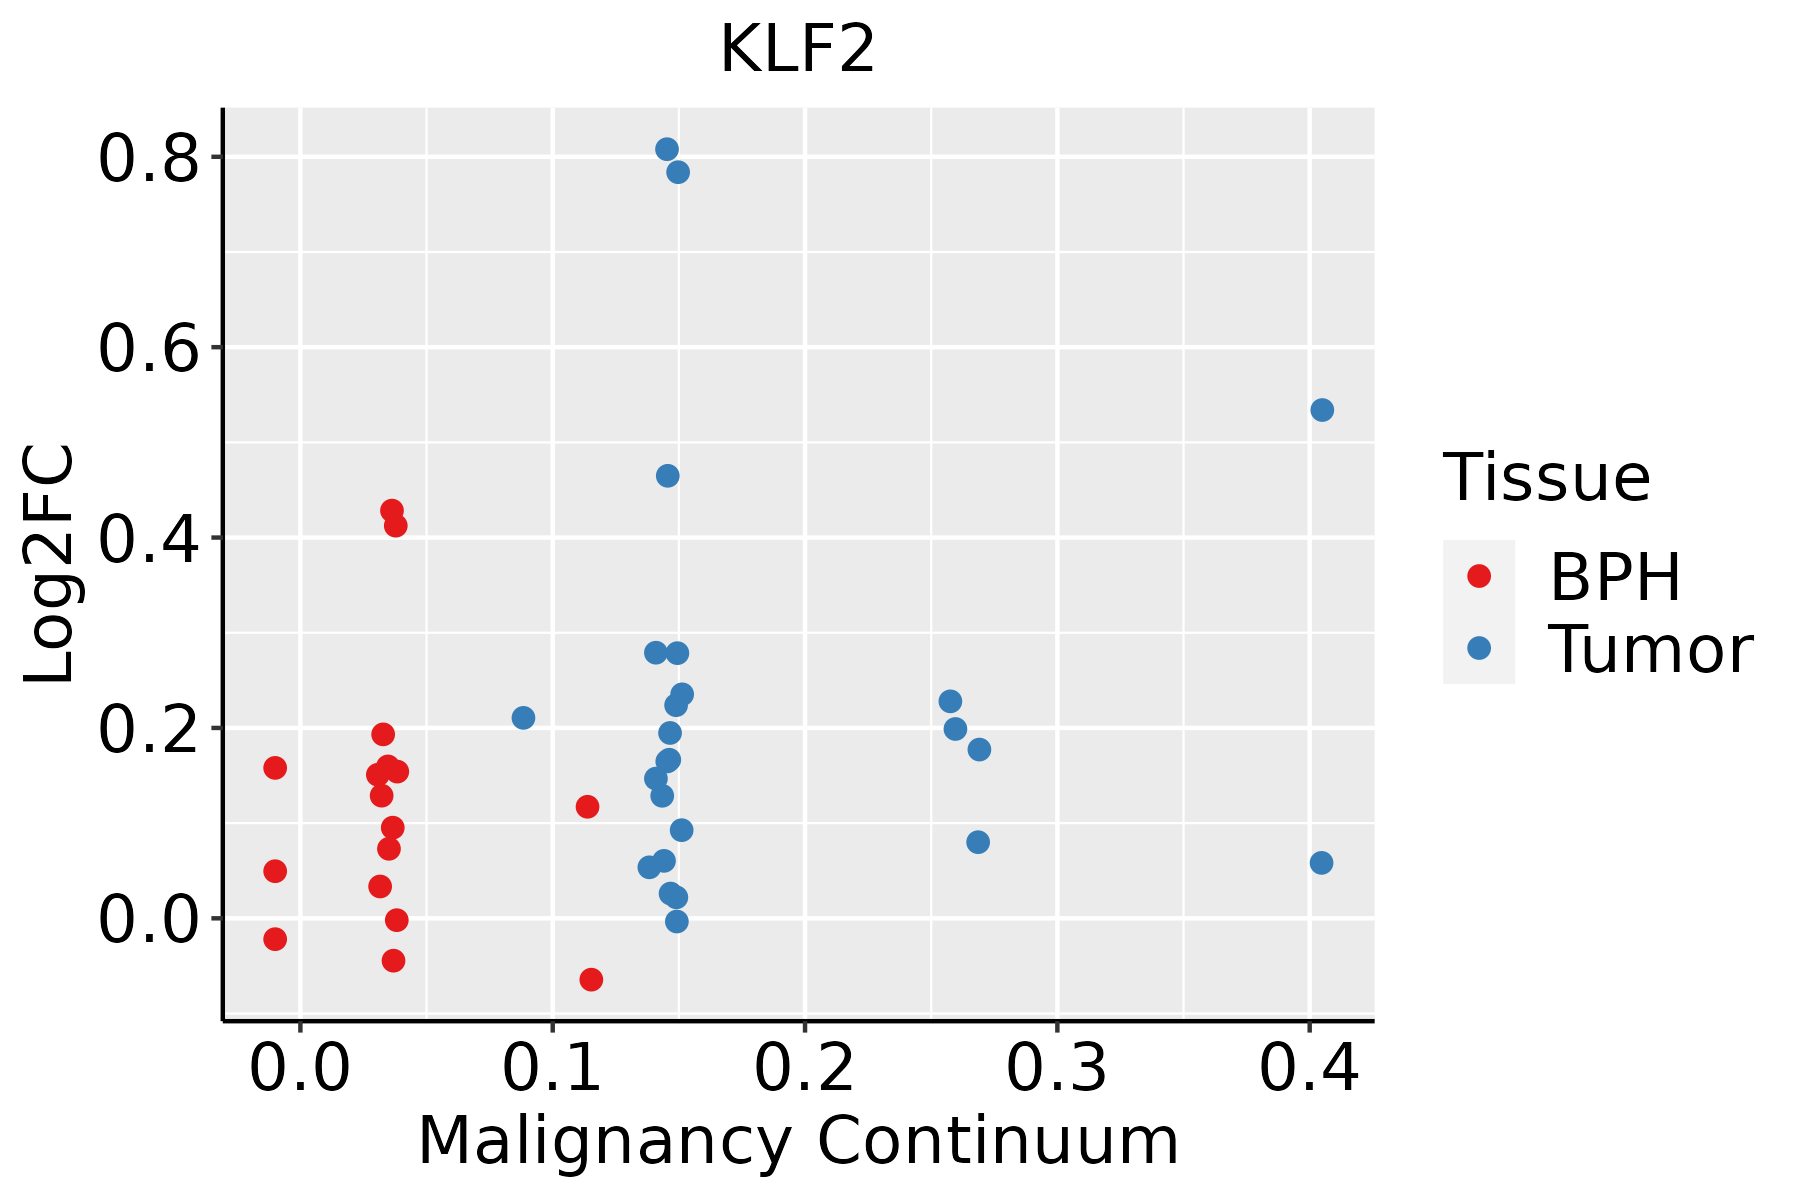 | BPH: Benign Prostatic Hyperplasia |
| Thyroid | 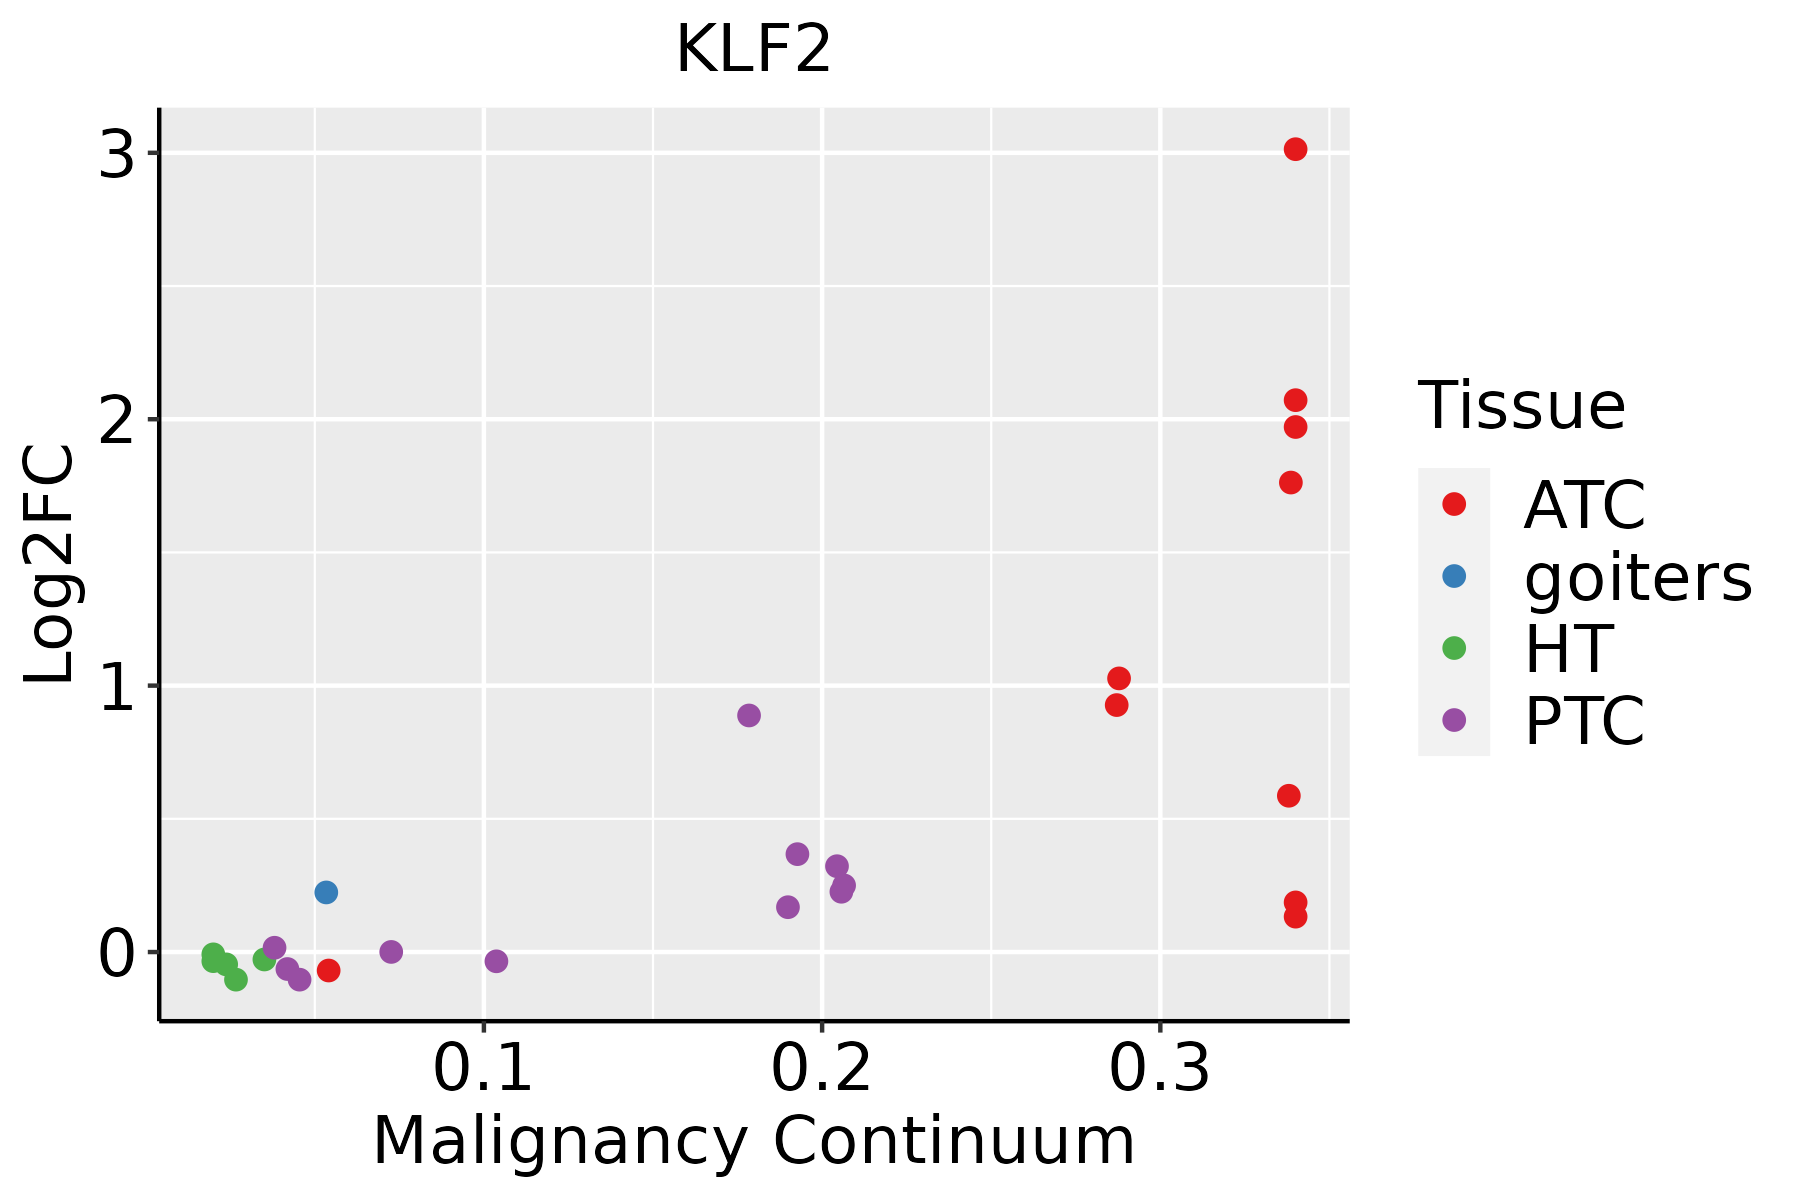 | ATC: Anaplastic thyroid cancer |
| HT: Hashimoto's thyroiditis | ||
| PTC: Papillary thyroid cancer |
| ∗log2FC in expression of this searched gene in stem-like cells from each diseased tissue sample relative to stem-like cells in normal samples in each tissue plotted against the malignancy continuum. Samples are colored based on if they are from different disease stage. |
Top |
Malignant transformation related pathway analysis |
| Find out the enriched GO biological processes and KEGG pathways involved in transition from healthy to precancer to cancer |
| Tissue | Disease Stage | Enriched GO biological Processes |
| Colorectum | AD |  |
| Colorectum | SER |  |
| Colorectum | MSS |  |
| Colorectum | MSI-H |  |
| Colorectum | FAP |  |
| ∗Top 15 enriched GO BP terms are showed in the bar plot of each disease state in each tissue. Each row represents a significant GO biological process which is colored according to the -log10(p.adjust). |
| Page: 1 2 3 4 5 6 7 8 9 |
| GO ID | Tissue | Disease Stage | Description | Gene Ratio | Bg Ratio | pvalue | p.adjust | Count |
| GO:0006979111 | Esophagus | ESCC | response to oxidative stress | 303/8552 | 446/18723 | 7.15e-22 | 1.30e-19 | 303 |
| GO:0062197111 | Esophagus | ESCC | cellular response to chemical stress | 234/8552 | 337/18723 | 5.37e-19 | 5.97e-17 | 234 |
| GO:000170119 | Esophagus | ESCC | in utero embryonic development | 243/8552 | 367/18723 | 1.00e-15 | 6.86e-14 | 243 |
| GO:0034599111 | Esophagus | ESCC | cellular response to oxidative stress | 197/8552 | 288/18723 | 3.76e-15 | 2.15e-13 | 197 |
| GO:0000302111 | Esophagus | ESCC | response to reactive oxygen species | 150/8552 | 222/18723 | 3.06e-11 | 1.02e-09 | 150 |
| GO:0043618111 | Esophagus | ESCC | regulation of transcription from RNA polymerase II promoter in response to stress | 42/8552 | 47/18723 | 3.91e-10 | 1.05e-08 | 42 |
| GO:0043620111 | Esophagus | ESCC | regulation of DNA-templated transcription in response to stress | 46/8552 | 53/18723 | 5.17e-10 | 1.33e-08 | 46 |
| GO:0030522110 | Esophagus | ESCC | intracellular receptor signaling pathway | 170/8552 | 265/18723 | 8.58e-10 | 2.09e-08 | 170 |
| GO:0030099111 | Esophagus | ESCC | myeloid cell differentiation | 232/8552 | 381/18723 | 1.22e-09 | 2.90e-08 | 232 |
| GO:0042542111 | Esophagus | ESCC | response to hydrogen peroxide | 102/8552 | 146/18723 | 2.64e-09 | 5.81e-08 | 102 |
| GO:003461420 | Esophagus | ESCC | cellular response to reactive oxygen species | 103/8552 | 155/18723 | 1.34e-07 | 2.17e-06 | 103 |
| GO:0002262111 | Esophagus | ESCC | myeloid cell homeostasis | 104/8552 | 157/18723 | 1.49e-07 | 2.36e-06 | 104 |
| GO:0034101111 | Esophagus | ESCC | erythrocyte homeostasis | 88/8552 | 129/18723 | 1.81e-07 | 2.84e-06 | 88 |
| GO:00400295 | Esophagus | ESCC | regulation of gene expression, epigenetic | 74/8552 | 105/18723 | 2.24e-07 | 3.42e-06 | 74 |
| GO:0048872111 | Esophagus | ESCC | homeostasis of number of cells | 163/8552 | 272/18723 | 1.40e-06 | 1.69e-05 | 163 |
| GO:190165319 | Esophagus | ESCC | cellular response to peptide | 208/8552 | 359/18723 | 1.68e-06 | 2.01e-05 | 208 |
| GO:00703018 | Esophagus | ESCC | cellular response to hydrogen peroxide | 68/8552 | 98/18723 | 1.70e-06 | 2.03e-05 | 68 |
| GO:0030218111 | Esophagus | ESCC | erythrocyte differentiation | 80/8552 | 120/18723 | 2.69e-06 | 3.08e-05 | 80 |
| GO:00303239 | Esophagus | ESCC | respiratory tube development | 112/8552 | 181/18723 | 7.82e-06 | 7.69e-05 | 112 |
| GO:00605417 | Esophagus | ESCC | respiratory system development | 123/8552 | 203/18723 | 1.26e-05 | 1.15e-04 | 123 |
| Page: 1 2 3 4 5 6 7 8 9 10 11 12 13 14 15 16 17 18 19 20 21 22 23 24 25 |
| Pathway ID | Tissue | Disease Stage | Description | Gene Ratio | Bg Ratio | pvalue | p.adjust | qvalue | Count |
| hsa05418211 | Esophagus | ESCC | Fluid shear stress and atherosclerosis | 109/4205 | 139/8465 | 2.00e-12 | 3.72e-11 | 1.90e-11 | 109 |
| hsa040689 | Esophagus | ESCC | FoxO signaling pathway | 89/4205 | 131/8465 | 1.56e-05 | 7.98e-05 | 4.09e-05 | 89 |
| hsa05418310 | Esophagus | ESCC | Fluid shear stress and atherosclerosis | 109/4205 | 139/8465 | 2.00e-12 | 3.72e-11 | 1.90e-11 | 109 |
| hsa0406814 | Esophagus | ESCC | FoxO signaling pathway | 89/4205 | 131/8465 | 1.56e-05 | 7.98e-05 | 4.09e-05 | 89 |
| hsa0541822 | Liver | Cirrhotic | Fluid shear stress and atherosclerosis | 62/2530 | 139/8465 | 1.53e-04 | 1.06e-03 | 6.54e-04 | 62 |
| hsa040682 | Liver | Cirrhotic | FoxO signaling pathway | 52/2530 | 131/8465 | 9.98e-03 | 3.32e-02 | 2.05e-02 | 52 |
| hsa0541832 | Liver | Cirrhotic | Fluid shear stress and atherosclerosis | 62/2530 | 139/8465 | 1.53e-04 | 1.06e-03 | 6.54e-04 | 62 |
| hsa040683 | Liver | Cirrhotic | FoxO signaling pathway | 52/2530 | 131/8465 | 9.98e-03 | 3.32e-02 | 2.05e-02 | 52 |
| hsa040684 | Liver | HCC | FoxO signaling pathway | 85/4020 | 131/8465 | 3.99e-05 | 2.16e-04 | 1.20e-04 | 85 |
| hsa0541842 | Liver | HCC | Fluid shear stress and atherosclerosis | 89/4020 | 139/8465 | 5.58e-05 | 2.88e-04 | 1.60e-04 | 89 |
| hsa040685 | Liver | HCC | FoxO signaling pathway | 85/4020 | 131/8465 | 3.99e-05 | 2.16e-04 | 1.20e-04 | 85 |
| hsa0541852 | Liver | HCC | Fluid shear stress and atherosclerosis | 89/4020 | 139/8465 | 5.58e-05 | 2.88e-04 | 1.60e-04 | 89 |
| hsa0541863 | Oral cavity | NEOLP | Fluid shear stress and atherosclerosis | 40/1112 | 139/8465 | 7.44e-07 | 9.10e-06 | 5.72e-06 | 40 |
| hsa0406841 | Oral cavity | NEOLP | FoxO signaling pathway | 27/1112 | 131/8465 | 1.07e-02 | 3.54e-02 | 2.22e-02 | 27 |
| hsa0541873 | Oral cavity | NEOLP | Fluid shear stress and atherosclerosis | 40/1112 | 139/8465 | 7.44e-07 | 9.10e-06 | 5.72e-06 | 40 |
| hsa0406851 | Oral cavity | NEOLP | FoxO signaling pathway | 27/1112 | 131/8465 | 1.07e-02 | 3.54e-02 | 2.22e-02 | 27 |
| hsa0541828 | Prostate | BPH | Fluid shear stress and atherosclerosis | 58/1718 | 139/8465 | 5.48e-09 | 7.24e-08 | 4.48e-08 | 58 |
| hsa040687 | Prostate | BPH | FoxO signaling pathway | 54/1718 | 131/8465 | 3.05e-08 | 3.59e-07 | 2.22e-07 | 54 |
| hsa05418113 | Prostate | BPH | Fluid shear stress and atherosclerosis | 58/1718 | 139/8465 | 5.48e-09 | 7.24e-08 | 4.48e-08 | 58 |
| hsa0406812 | Prostate | BPH | FoxO signaling pathway | 54/1718 | 131/8465 | 3.05e-08 | 3.59e-07 | 2.22e-07 | 54 |
| Page: 1 2 |
Top |
Cell-cell communication analysis |
| Identification of potential cell-cell interactions between two cell types and their ligand-receptor pairs for different disease states |
| Ligand | Receptor | LRpair | Pathway | Tissue | Disease Stage |
| Page: 1 |
Top |
Single-cell gene regulatory network inference analysis |
| Find out the significant the regulons (TFs) and the target genes of each regulon across cell types for different disease states |
| TF | Cell Type | Tissue | Disease Stage | Target Gene | RSS | Regulon Activity |
| KLF2 | CD4TN | Cervix | CC | FGFBP2,SELL,RHOB, etc. | 1.28e-01 |  |
| KLF2 | TFH | Cervix | CC | FGFBP2,SELL,RHOB, etc. | 6.38e-02 | |
| KLF2 | GOB | Colorectum | SER | PI3,PHLDA2,GSN, etc. | 4.05e-01 |  |
| KLF2 | TH17 | Colorectum | ADJ | TSC22D3,CITED2,CD55, etc. | 7.18e-02 |  |
| KLF2 | PLA | Colorectum | FAP | TSC22D3,CITED2,CD55, etc. | 2.23e-01 |  |
| KLF2 | END | Colorectum | FAP | HEG1,SRP14,CD34, etc. | 3.37e-01 | |
| KLF2 | GDT | Lung | ADJ | GIMAP7,CCND3,ABHD17A, etc. | 1.30e-01 |  |
| KLF2 | CD8TCM | Lung | AIS | NKG7,GZMH,KLF3, etc. | 1.70e-01 |  |
| KLF2 | GDT | Lung | AIS | NKG7,GZMH,KLF3, etc. | 1.31e-01 | |
| KLF2 | CD8TEXP | Stomach | ADJ | RHOB,C12orf57,KLF6, etc. | 3.05e-02 |  |
| ∗The dot plots of a searched regulon are shown for all cell subpopulations in each disease state of each tissue based on the regulon specific score inferred using pySCENIC and by calculating the average expression. |
| Page: 1 2 |
Top |
Somatic mutation of malignant transformation related genes |
| Annotation of somatic variants for genes involved in malignant transformation |
| Hugo Symbol | Variant Class | Variant Classification | dbSNP RS | HGVSc | HGVSp | HGVSp Short | SWISSPROT | BIOTYPE | SIFT | PolyPhen | Tumor Sample Barcode | Tissue | Histology | Sex | Age | Stage | Therapy Types | Drugs | Outcome |
| KLF2 | SNV | Missense_Mutation | c.5N>T | p.Ala2Val | p.A2V | Q9Y5W3 | protein_coding | deleterious(0) | possibly_damaging(0.834) | TCGA-CK-4951-01 | Colorectum | colon adenocarcinoma | Female | >=65 | I/II | Unknown | Unknown | PD | |
| KLF2 | SNV | Missense_Mutation | c.818C>T | p.Thr273Ile | p.T273I | Q9Y5W3 | protein_coding | deleterious(0) | benign(0.34) | TCGA-D5-6930-01 | Colorectum | colon adenocarcinoma | Male | >=65 | I/II | Unknown | Unknown | SD | |
| KLF2 | SNV | Missense_Mutation | novel | c.1027N>T | p.Arg343Cys | p.R343C | Q9Y5W3 | protein_coding | deleterious(0) | probably_damaging(0.999) | TCGA-AX-A2HC-01 | Endometrium | uterine corpus endometrioid carcinoma | Female | <65 | III/IV | Chemotherapy | paclitaxel | PD |
| KLF2 | SNV | Missense_Mutation | novel | c.1027N>T | p.Arg343Cys | p.R343C | Q9Y5W3 | protein_coding | deleterious(0) | probably_damaging(0.999) | TCGA-FI-A2D5-01 | Endometrium | uterine corpus endometrioid carcinoma | Female | <65 | III/IV | Chemotherapy | carboplatinum | PD |
| KLF2 | SNV | Missense_Mutation | c.910N>C | p.Cys304Arg | p.C304R | Q9Y5W3 | protein_coding | deleterious(0) | probably_damaging(1) | TCGA-33-4532-01 | Lung | lung squamous cell carcinoma | Male | >=65 | I/II | Unknown | Unknown | SD |
| Page: 1 |
Top |
Related drugs of malignant transformation related genes |
| Identification of chemicals and drugs interact with genes involved in malignant transfromation |
| (DGIdb 4.0) |
| Entrez ID | Symbol | Category | Interaction Types | Drug Claim Name | Drug Name | PMIDs |
| Page: 1 |

Copyright 2023-Present -The University of Texas Health Science Center at Houston |