
|
|||||
|
 | |
| |
| |
| |
| |
| |
|
Gene: KLF13 |
Gene summary for KLF13 |
| Gene information | Species | Human | Gene symbol | KLF13 | Gene ID | 51621 |
| Gene name | Kruppel like factor 13 | |
| Gene Alias | BTEB3 | |
| Cytomap | 15q13.3 | |
| Gene Type | protein-coding | GO ID | GO:0002262 | UniProtAcc | Q9Y2Y9 |
Top |
Malignant transformation analysis |
| Identification of the aberrant gene expression in precancerous and cancerous lesions by comparing the gene expression of stem-like cells in diseased tissues with normal stem cells |
| Entrez ID | Symbol | Replicates | Species | Organ | Tissue | Adj P-value | Log2FC | Malignancy |
| 51621 | KLF13 | HTA11_3410_2000001011 | Human | Colorectum | AD | 1.27e-02 | 4.29e-02 | 0.0155 |
| 51621 | KLF13 | HTA11_2487_2000001011 | Human | Colorectum | SER | 5.91e-05 | 3.66e-01 | -0.1808 |
| 51621 | KLF13 | HTA11_1938_2000001011 | Human | Colorectum | AD | 5.22e-09 | 4.72e-01 | -0.0811 |
| 51621 | KLF13 | HTA11_78_2000001011 | Human | Colorectum | AD | 1.16e-05 | 3.15e-01 | -0.1088 |
| 51621 | KLF13 | HTA11_347_2000001011 | Human | Colorectum | AD | 8.37e-19 | 5.19e-01 | -0.1954 |
| 51621 | KLF13 | HTA11_83_2000001011 | Human | Colorectum | SER | 5.52e-04 | 4.00e-01 | -0.1526 |
| 51621 | KLF13 | HTA11_696_2000001011 | Human | Colorectum | AD | 1.75e-13 | 4.90e-01 | -0.1464 |
| 51621 | KLF13 | HTA11_866_2000001011 | Human | Colorectum | AD | 6.94e-03 | 2.63e-01 | -0.1001 |
| 51621 | KLF13 | HTA11_1391_2000001011 | Human | Colorectum | AD | 1.95e-09 | 4.84e-01 | -0.059 |
| 51621 | KLF13 | HTA11_7862_2000001011 | Human | Colorectum | AD | 4.11e-02 | 2.00e-01 | -0.0179 |
| 51621 | KLF13 | HTA11_8622_2000001021 | Human | Colorectum | SER | 3.15e-02 | 2.91e-01 | 0.0528 |
| 51621 | KLF13 | HTA11_6818_2000001021 | Human | Colorectum | AD | 3.27e-03 | 2.83e-01 | 0.0588 |
| 51621 | KLF13 | HTA11_99999970781_79442 | Human | Colorectum | MSS | 7.32e-03 | 2.68e-01 | 0.294 |
| 51621 | KLF13 | A015-C-203 | Human | Colorectum | FAP | 1.14e-02 | -1.11e-01 | -0.1294 |
| 51621 | KLF13 | A015-C-104 | Human | Colorectum | FAP | 3.59e-04 | -1.56e-01 | -0.1899 |
| 51621 | KLF13 | A002-C-116 | Human | Colorectum | FAP | 2.05e-02 | -1.67e-01 | -0.0452 |
| 51621 | KLF13 | LZE4T | Human | Esophagus | ESCC | 3.51e-05 | -2.15e-01 | 0.0811 |
| 51621 | KLF13 | LZE7T | Human | Esophagus | ESCC | 3.34e-05 | -6.92e-02 | 0.0667 |
| 51621 | KLF13 | LZE24T | Human | Esophagus | ESCC | 6.98e-11 | -1.51e-01 | 0.0596 |
| 51621 | KLF13 | P1T-E | Human | Esophagus | ESCC | 1.15e-06 | 1.28e-01 | 0.0875 |
| Page: 1 2 3 4 5 6 7 |
| Tissue | Expression Dynamics | Abbreviation |
| Colorectum (GSE201348) |  | FAP: Familial adenomatous polyposis |
| CRC: Colorectal cancer | ||
| Colorectum (HTA11) |  | AD: Adenomas |
| SER: Sessile serrated lesions | ||
| MSI-H: Microsatellite-high colorectal cancer | ||
| MSS: Microsatellite stable colorectal cancer | ||
| Esophagus | 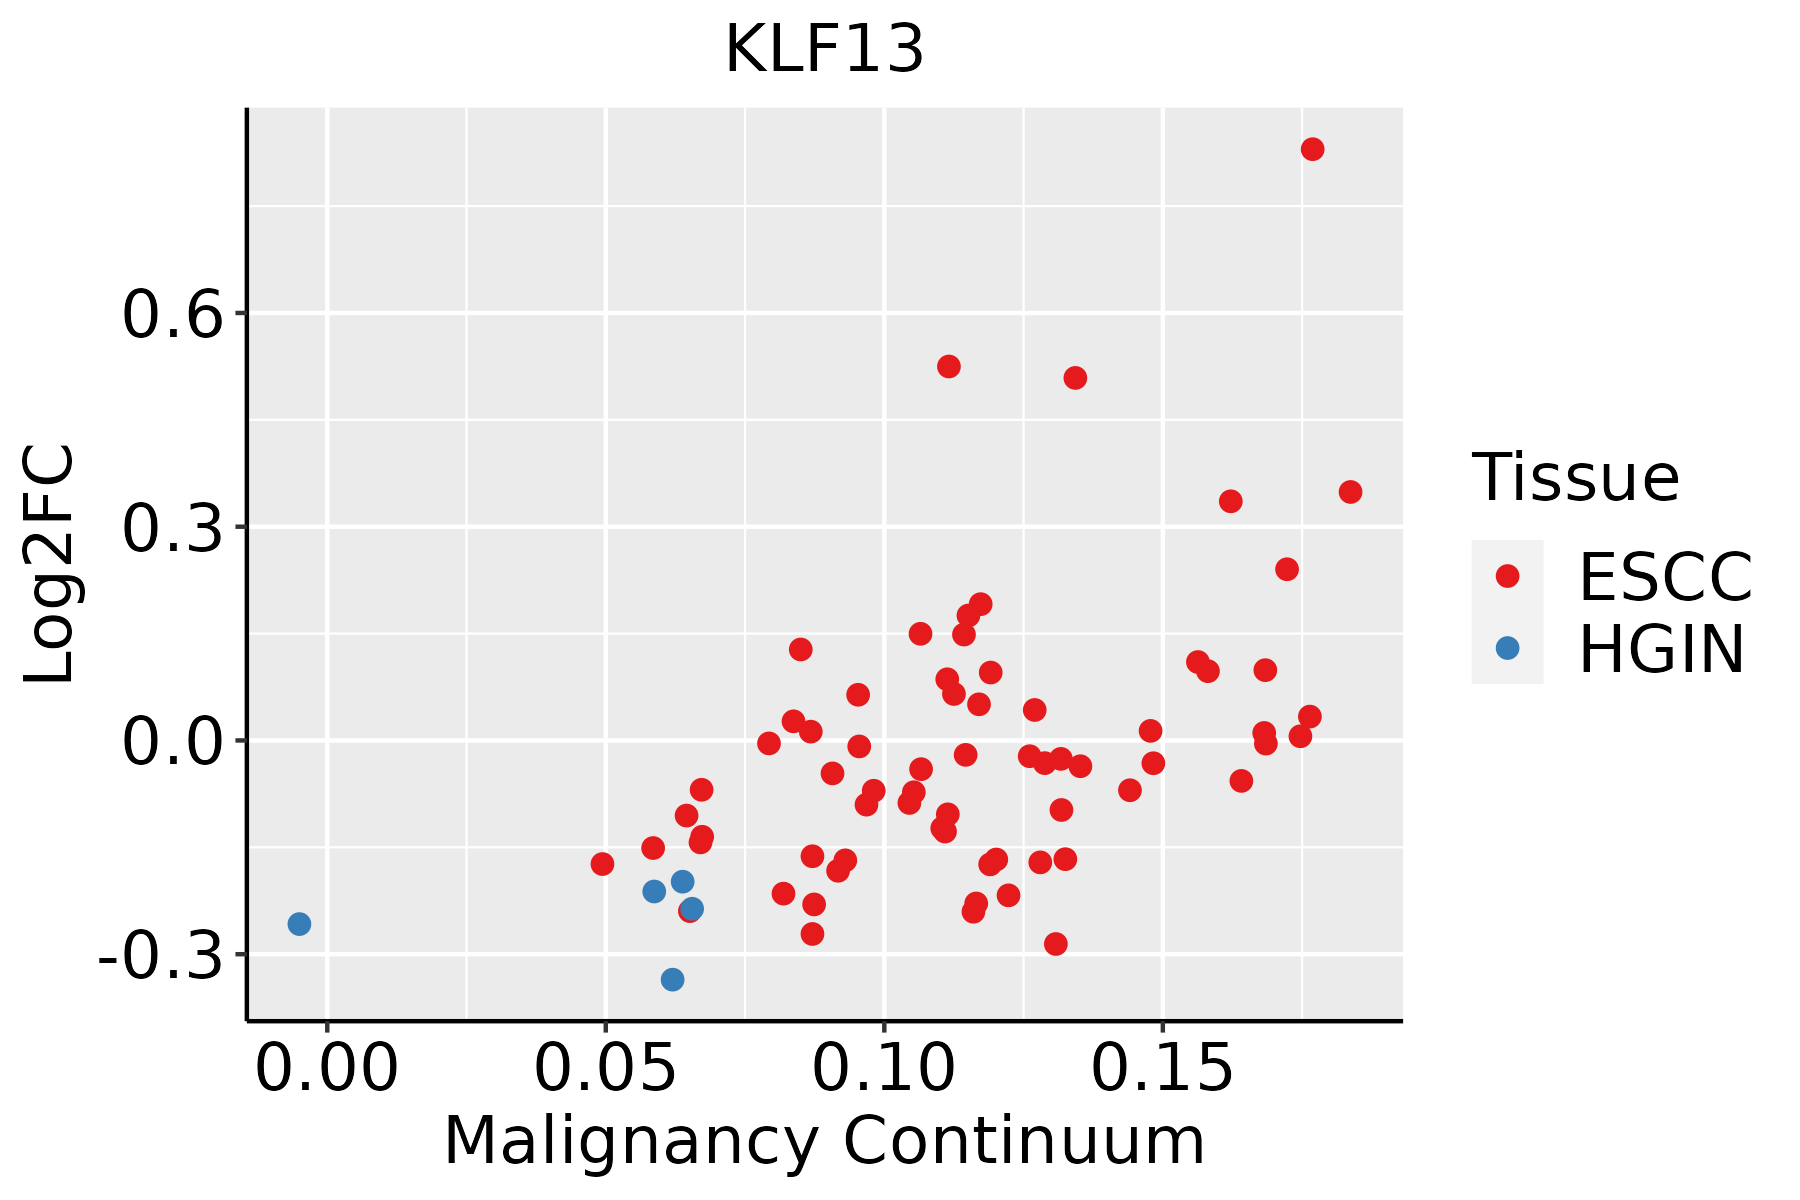 | ESCC: Esophageal squamous cell carcinoma |
| HGIN: High-grade intraepithelial neoplasias | ||
| LGIN: Low-grade intraepithelial neoplasias | ||
| Liver | 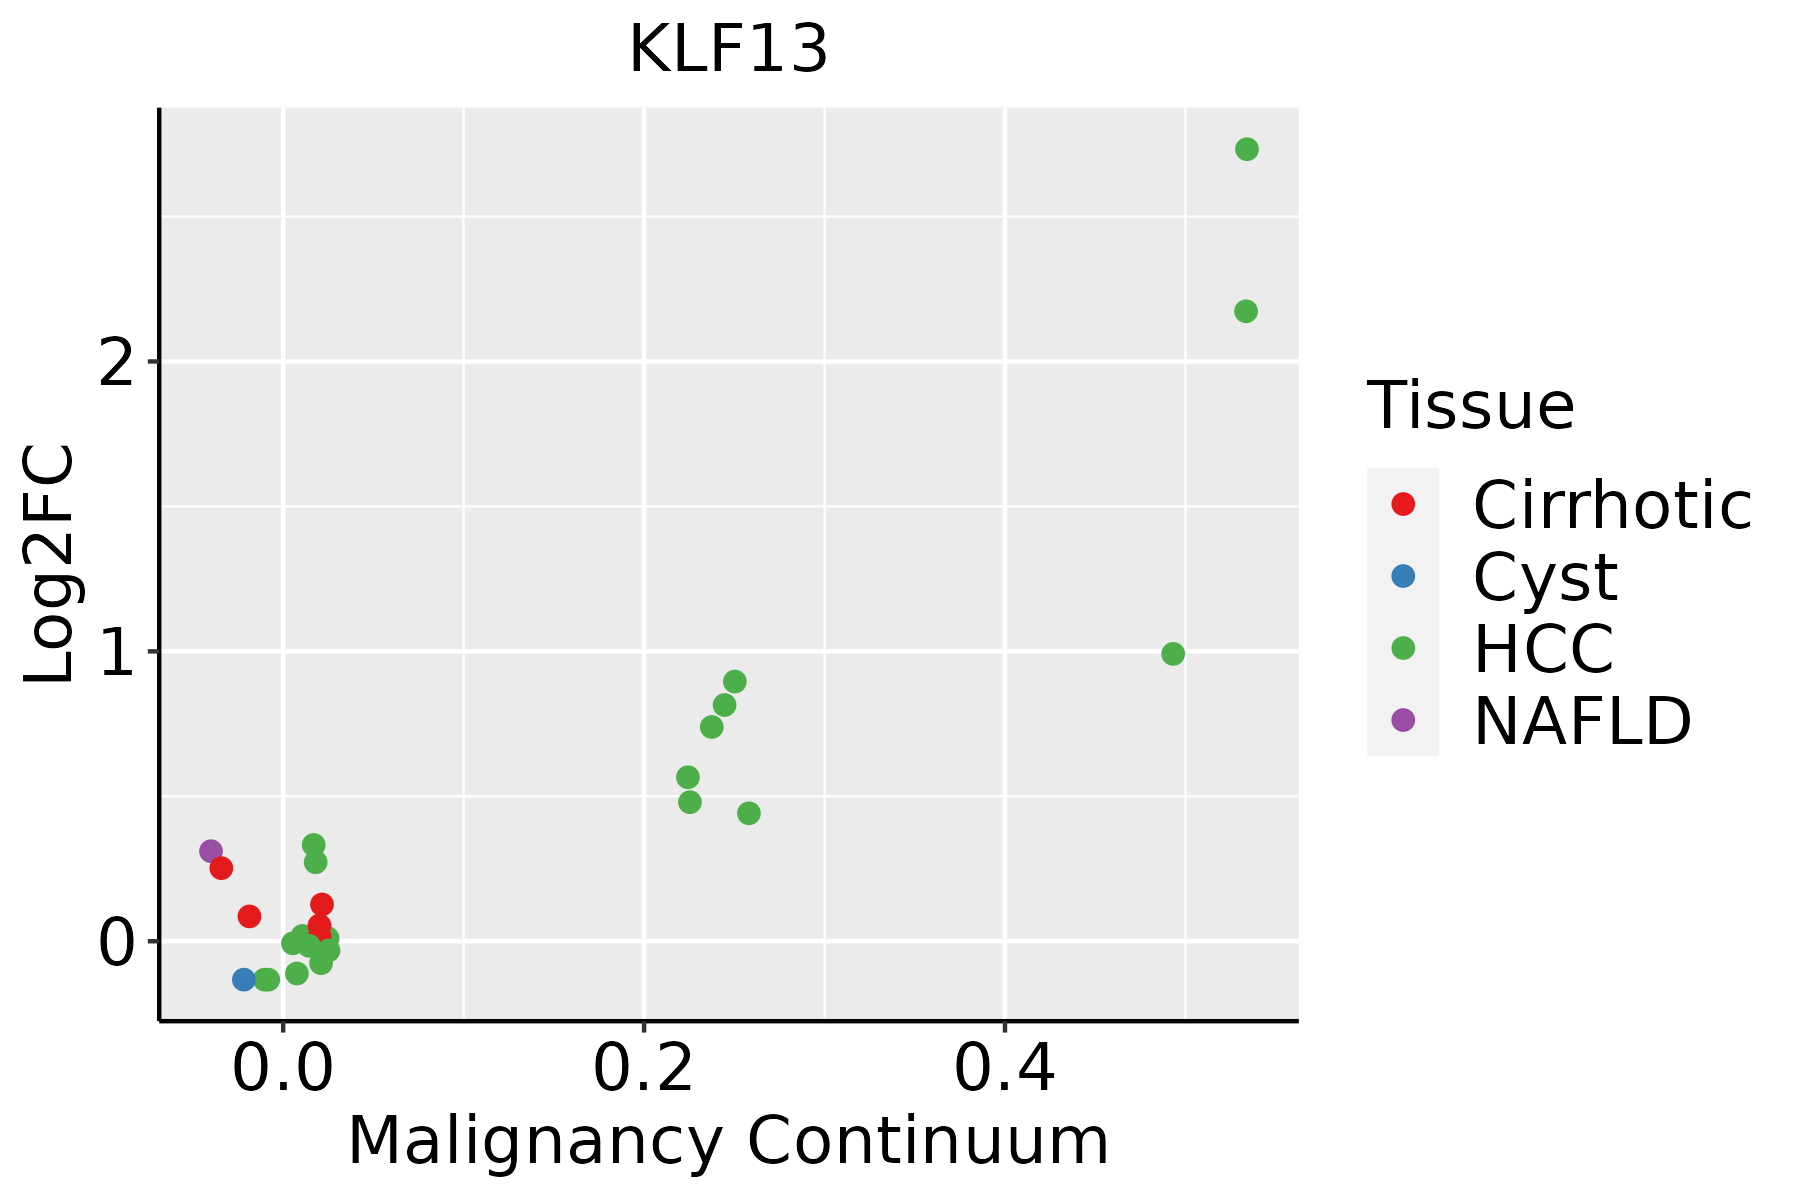 | HCC: Hepatocellular carcinoma |
| NAFLD: Non-alcoholic fatty liver disease | ||
| Oral Cavity |  | EOLP: Erosive Oral lichen planus |
| LP: leukoplakia | ||
| NEOLP: Non-erosive oral lichen planus | ||
| OSCC: Oral squamous cell carcinoma | ||
| Skin |  | AK: Actinic keratosis |
| cSCC: Cutaneous squamous cell carcinoma | ||
| SCCIS:squamous cell carcinoma in situ | ||
| Thyroid | 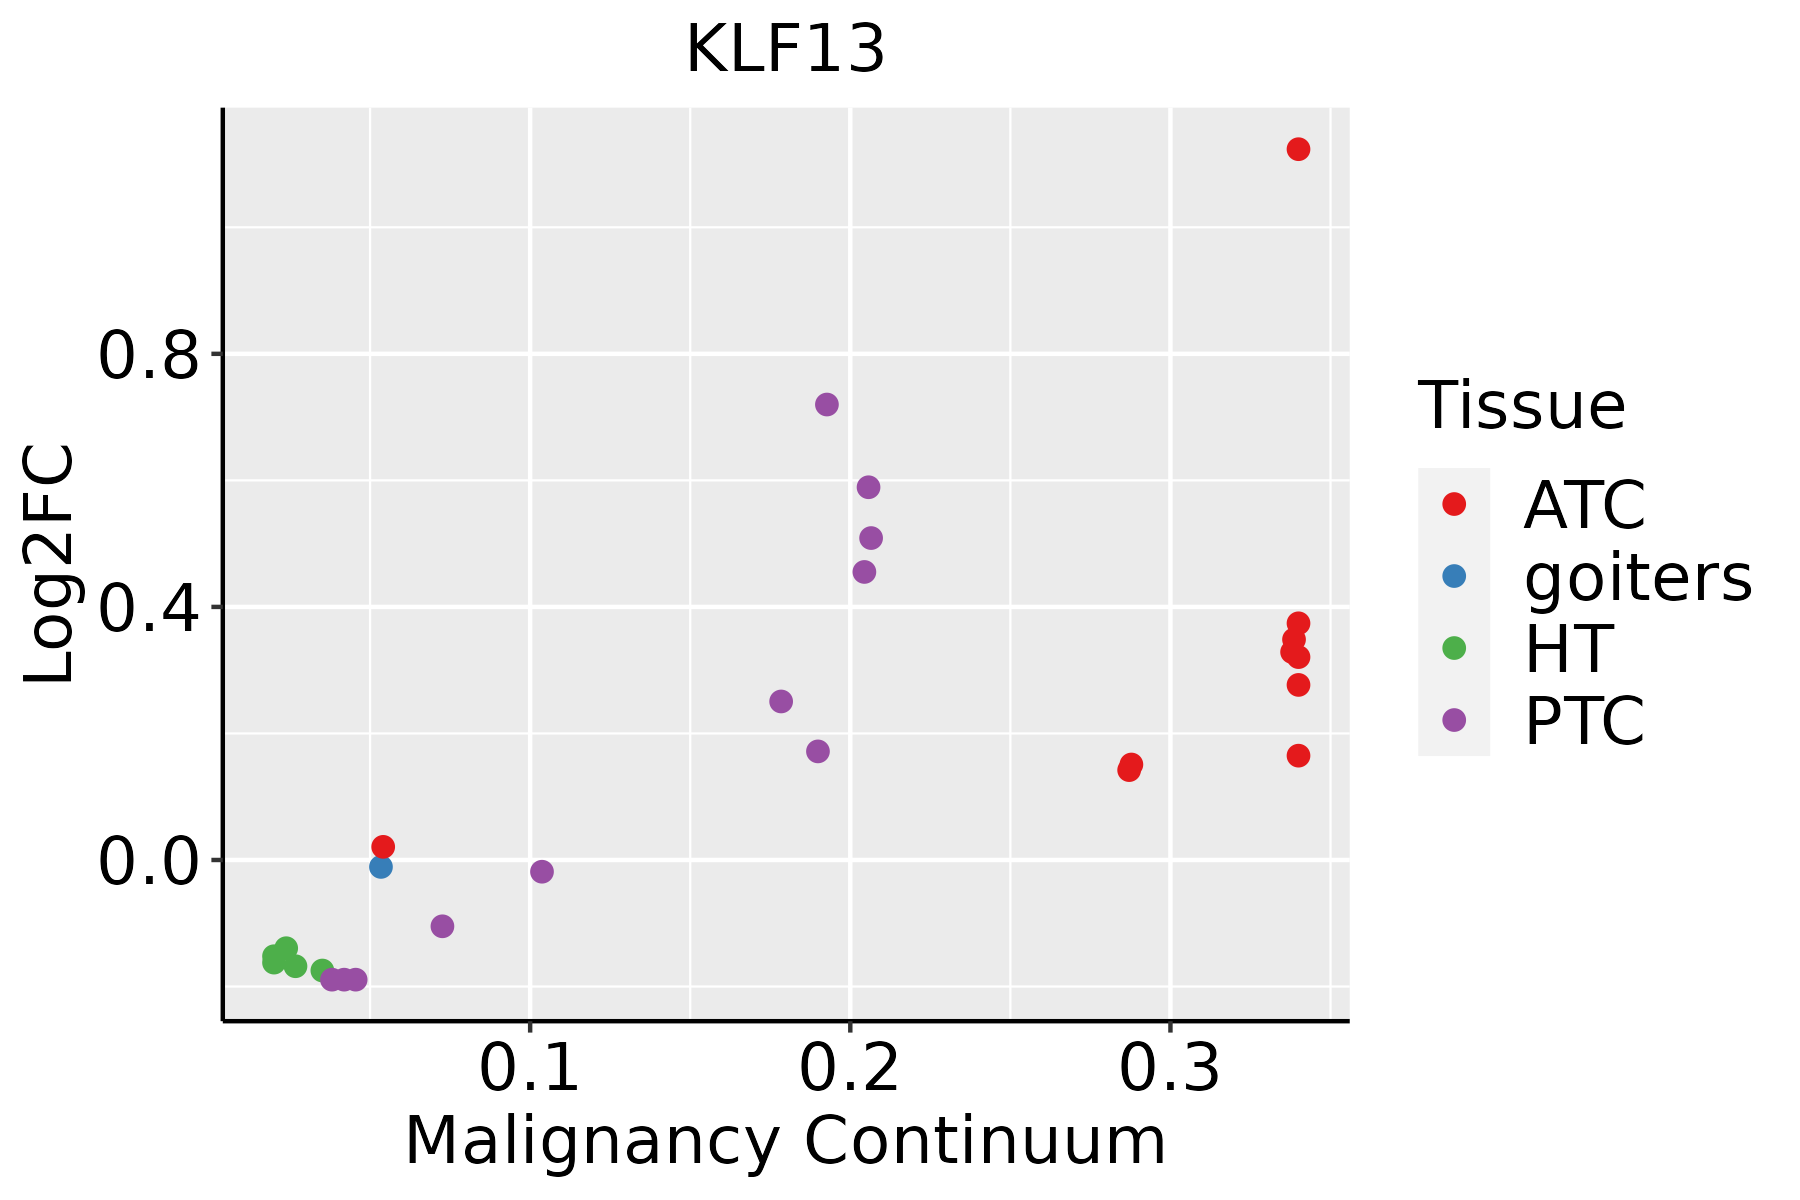 | ATC: Anaplastic thyroid cancer |
| HT: Hashimoto's thyroiditis | ||
| PTC: Papillary thyroid cancer |
| ∗log2FC in expression of this searched gene in stem-like cells from each diseased tissue sample relative to stem-like cells in normal samples in each tissue plotted against the malignancy continuum. Samples are colored based on if they are from different disease stage. |
Top |
Malignant transformation related pathway analysis |
| Find out the enriched GO biological processes and KEGG pathways involved in transition from healthy to precancer to cancer |
| Tissue | Disease Stage | Enriched GO biological Processes |
| Colorectum | AD |  |
| Colorectum | SER |  |
| Colorectum | MSS |  |
| Colorectum | MSI-H |  |
| Colorectum | FAP |  |
| ∗Top 15 enriched GO BP terms are showed in the bar plot of each disease state in each tissue. Each row represents a significant GO biological process which is colored according to the -log10(p.adjust). |
| Page: 1 2 3 4 5 6 7 8 9 |
| GO ID | Tissue | Disease Stage | Description | Gene Ratio | Bg Ratio | pvalue | p.adjust | Count |
| GO:0034101 | Colorectum | AD | erythrocyte homeostasis | 51/3918 | 129/18723 | 1.07e-06 | 3.59e-05 | 51 |
| GO:0030099 | Colorectum | AD | myeloid cell differentiation | 119/3918 | 381/18723 | 1.24e-06 | 4.01e-05 | 119 |
| GO:0002262 | Colorectum | AD | myeloid cell homeostasis | 57/3918 | 157/18723 | 6.17e-06 | 1.56e-04 | 57 |
| GO:0048872 | Colorectum | AD | homeostasis of number of cells | 87/3918 | 272/18723 | 1.16e-05 | 2.61e-04 | 87 |
| GO:0030218 | Colorectum | AD | erythrocyte differentiation | 45/3918 | 120/18723 | 2.22e-05 | 4.39e-04 | 45 |
| GO:0045646 | Colorectum | AD | regulation of erythrocyte differentiation | 20/3918 | 47/18723 | 6.54e-04 | 6.75e-03 | 20 |
| GO:1903706 | Colorectum | AD | regulation of hemopoiesis | 99/3918 | 367/18723 | 3.08e-03 | 2.28e-02 | 99 |
| GO:0045637 | Colorectum | AD | regulation of myeloid cell differentiation | 61/3918 | 210/18723 | 3.17e-03 | 2.35e-02 | 61 |
| GO:00341011 | Colorectum | SER | erythrocyte homeostasis | 39/2897 | 129/18723 | 1.70e-05 | 5.11e-04 | 39 |
| GO:00022621 | Colorectum | SER | myeloid cell homeostasis | 44/2897 | 157/18723 | 4.09e-05 | 1.03e-03 | 44 |
| GO:00488721 | Colorectum | SER | homeostasis of number of cells | 65/2897 | 272/18723 | 1.70e-04 | 3.19e-03 | 65 |
| GO:00302181 | Colorectum | SER | erythrocyte differentiation | 33/2897 | 120/18723 | 5.15e-04 | 7.30e-03 | 33 |
| GO:00456461 | Colorectum | SER | regulation of erythrocyte differentiation | 16/2897 | 47/18723 | 1.29e-03 | 1.44e-02 | 16 |
| GO:00300991 | Colorectum | SER | myeloid cell differentiation | 80/2897 | 381/18723 | 2.28e-03 | 2.18e-02 | 80 |
| GO:00341012 | Colorectum | MSS | erythrocyte homeostasis | 49/3467 | 129/18723 | 1.58e-07 | 7.19e-06 | 49 |
| GO:00300992 | Colorectum | MSS | myeloid cell differentiation | 110/3467 | 381/18723 | 4.48e-07 | 1.75e-05 | 110 |
| GO:00022622 | Colorectum | MSS | myeloid cell homeostasis | 55/3467 | 157/18723 | 6.35e-07 | 2.34e-05 | 55 |
| GO:00488722 | Colorectum | MSS | homeostasis of number of cells | 82/3467 | 272/18723 | 2.02e-06 | 6.28e-05 | 82 |
| GO:00302182 | Colorectum | MSS | erythrocyte differentiation | 44/3467 | 120/18723 | 2.03e-06 | 6.28e-05 | 44 |
| GO:00456462 | Colorectum | MSS | regulation of erythrocyte differentiation | 19/3467 | 47/18723 | 3.88e-04 | 4.86e-03 | 19 |
| Page: 1 2 3 4 5 6 |
| Pathway ID | Tissue | Disease Stage | Description | Gene Ratio | Bg Ratio | pvalue | p.adjust | qvalue | Count |
| Page: 1 |
Top |
Cell-cell communication analysis |
| Identification of potential cell-cell interactions between two cell types and their ligand-receptor pairs for different disease states |
| Ligand | Receptor | LRpair | Pathway | Tissue | Disease Stage |
| Page: 1 |
Top |
Single-cell gene regulatory network inference analysis |
| Find out the significant the regulons (TFs) and the target genes of each regulon across cell types for different disease states |
| TF | Cell Type | Tissue | Disease Stage | Target Gene | RSS | Regulon Activity |
| KLF13 | ABS | Colorectum | ADJ | AZIN2,SNRPE,HSPA12A, etc. | 3.15e-01 |  |
| KLF13 | KER | Esophagus | ESCC | PCSK1,LTBP4,RXRA, etc. | 3.59e-01 |  |
| KLF13 | STM | Esophagus | Healthy | TSLP,PGF,TPBG, etc. | 4.48e-01 |  |
| KLF13 | TFH | Lung | MIAC | MIR4435-2HG,ABHD17A,ARL4D, etc. | 1.96e-01 |  |
| KLF13 | PLA | Stomach | ADJ | SSR4,MAFF,FKBP11, etc. | 4.53e-01 |  |
| KLF13 | PLA | Stomach | CAG | SSR4,MAFF,FKBP11, etc. | 5.00e-01 |  |
| KLF13 | PLA | Stomach | CAG with IM | SSR4,MAFF,FKBP11, etc. | 5.49e-01 |  |
| KLF13 | PLA | Stomach | CSG | SSR4,MAFF,FKBP11, etc. | 6.06e-01 |  |
| KLF13 | PLA | Stomach | GC | SSR4,MAFF,FKBP11, etc. | 2.92e-01 |  |
| KLF13 | PLA | Stomach | SIM | SSR4,MAFF,FKBP11, etc. | 6.00e-01 |  |
| ∗The dot plots of a searched regulon are shown for all cell subpopulations in each disease state of each tissue based on the regulon specific score inferred using pySCENIC and by calculating the average expression. |
| Page: 1 2 |
Top |
Somatic mutation of malignant transformation related genes |
| Annotation of somatic variants for genes involved in malignant transformation |
| Hugo Symbol | Variant Class | Variant Classification | dbSNP RS | HGVSc | HGVSp | HGVSp Short | SWISSPROT | BIOTYPE | SIFT | PolyPhen | Tumor Sample Barcode | Tissue | Histology | Sex | Age | Stage | Therapy Types | Drugs | Outcome |
| KLF13 | deletion | Frame_Shift_Del | novel | c.512_516delACGCG | p.Tyr171TrpfsTer22 | p.Y171Wfs*22 | Q9Y2Y9 | protein_coding | TCGA-E2-A9RU-01 | Breast | breast invasive carcinoma | Female | >=65 | III/IV | Hormone Therapy | arimidex | SD | ||
| KLF13 | SNV | Missense_Mutation | novel | c.592G>A | p.Ala198Thr | p.A198T | Q9Y2Y9 | protein_coding | deleterious(0.01) | possibly_damaging(0.72) | TCGA-AA-3549-01 | Colorectum | colon adenocarcinoma | Male | >=65 | I/II | Unknown | Unknown | SD |
| KLF13 | SNV | Missense_Mutation | c.712C>T | p.Arg238Cys | p.R238C | Q9Y2Y9 | protein_coding | deleterious(0) | probably_damaging(0.999) | TCGA-AA-3713-01 | Colorectum | colon adenocarcinoma | Male | >=65 | III/IV | Chemotherapy | 5-fluorouracil | PR | |
| KLF13 | SNV | Missense_Mutation | novel | c.614A>G | p.Asn205Ser | p.N205S | Q9Y2Y9 | protein_coding | tolerated(0.93) | benign(0.03) | TCGA-AA-A010-01 | Colorectum | colon adenocarcinoma | Female | <65 | I/II | Chemotherapy | folinic | CR |
| KLF13 | SNV | Missense_Mutation | c.704N>A | p.Arg235His | p.R235H | Q9Y2Y9 | protein_coding | deleterious(0) | probably_damaging(0.993) | TCGA-G4-6588-01 | Colorectum | colon adenocarcinoma | Female | <65 | I/II | Unknown | Unknown | SD | |
| KLF13 | SNV | Missense_Mutation | rs778732073 | c.794N>A | p.Arg265Gln | p.R265Q | Q9Y2Y9 | protein_coding | deleterious_low_confidence(0.01) | probably_damaging(0.92) | TCGA-WS-AB45-01 | Colorectum | colon adenocarcinoma | Female | <65 | I/II | Unknown | Unknown | SD |
| KLF13 | SNV | Missense_Mutation | novel | c.592N>A | p.Ala198Thr | p.A198T | Q9Y2Y9 | protein_coding | deleterious(0.01) | possibly_damaging(0.72) | TCGA-AX-A2HD-01 | Endometrium | uterine corpus endometrioid carcinoma | Female | >=65 | III/IV | Unknown | Unknown | SD |
| KLF13 | SNV | Missense_Mutation | rs147413291 | c.703N>T | p.Arg235Cys | p.R235C | Q9Y2Y9 | protein_coding | deleterious(0.03) | possibly_damaging(0.658) | TCGA-AX-A2HD-01 | Endometrium | uterine corpus endometrioid carcinoma | Female | >=65 | III/IV | Unknown | Unknown | SD |
| KLF13 | SNV | Missense_Mutation | novel | c.595N>C | p.Cys199Arg | p.C199R | Q9Y2Y9 | protein_coding | deleterious(0) | probably_damaging(1) | TCGA-B5-A5OC-01 | Endometrium | uterine corpus endometrioid carcinoma | Female | >=65 | III/IV | Chemotherapy | cisplatin | SD |
| KLF13 | SNV | Missense_Mutation | c.712N>T | p.Arg238Cys | p.R238C | Q9Y2Y9 | protein_coding | deleterious(0) | probably_damaging(0.999) | TCGA-FI-A2D5-01 | Endometrium | uterine corpus endometrioid carcinoma | Female | <65 | III/IV | Chemotherapy | carboplatinum | PD |
| Page: 1 2 |
Top |
Related drugs of malignant transformation related genes |
| Identification of chemicals and drugs interact with genes involved in malignant transfromation |
| (DGIdb 4.0) |
| Entrez ID | Symbol | Category | Interaction Types | Drug Claim Name | Drug Name | PMIDs |
| Page: 1 |

Copyright 2023-Present -The University of Texas Health Science Center at Houston |