
|
|||||
|
 | |
| |
| |
| |
| |
| |
|
Gene: KLC4 |
Gene summary for KLC4 |
| Gene information | Species | Human | Gene symbol | KLC4 | Gene ID | 89953 |
| Gene name | kinesin light chain 4 | |
| Gene Alias | KNSL8 | |
| Cytomap | 6p21.1 | |
| Gene Type | protein-coding | GO ID | GO:0005575 | UniProtAcc | A0A024RCZ8 |
Top |
Malignant transformation analysis |
| Identification of the aberrant gene expression in precancerous and cancerous lesions by comparing the gene expression of stem-like cells in diseased tissues with normal stem cells |
| Entrez ID | Symbol | Replicates | Species | Organ | Tissue | Adj P-value | Log2FC | Malignancy |
| 89953 | KLC4 | HTA11_2487_2000001011 | Human | Colorectum | SER | 1.32e-09 | 4.88e-01 | -0.1808 |
| 89953 | KLC4 | HTA11_1938_2000001011 | Human | Colorectum | AD | 8.84e-03 | 3.58e-01 | -0.0811 |
| 89953 | KLC4 | HTA11_347_2000001011 | Human | Colorectum | AD | 1.05e-29 | 7.46e-01 | -0.1954 |
| 89953 | KLC4 | HTA11_411_2000001011 | Human | Colorectum | SER | 1.72e-02 | 8.67e-01 | -0.2602 |
| 89953 | KLC4 | HTA11_2112_2000001011 | Human | Colorectum | SER | 7.97e-04 | 6.79e-01 | -0.2196 |
| 89953 | KLC4 | HTA11_3361_2000001011 | Human | Colorectum | AD | 1.41e-05 | 4.81e-01 | -0.1207 |
| 89953 | KLC4 | HTA11_83_2000001011 | Human | Colorectum | SER | 3.75e-09 | 6.46e-01 | -0.1526 |
| 89953 | KLC4 | HTA11_696_2000001011 | Human | Colorectum | AD | 1.45e-21 | 6.55e-01 | -0.1464 |
| 89953 | KLC4 | HTA11_866_2000001011 | Human | Colorectum | AD | 1.31e-05 | 3.24e-01 | -0.1001 |
| 89953 | KLC4 | HTA11_1391_2000001011 | Human | Colorectum | AD | 6.39e-08 | 4.70e-01 | -0.059 |
| 89953 | KLC4 | HTA11_5212_2000001011 | Human | Colorectum | AD | 1.29e-03 | 5.99e-01 | -0.2061 |
| 89953 | KLC4 | HTA11_5216_2000001011 | Human | Colorectum | SER | 7.78e-03 | 5.94e-01 | -0.1462 |
| 89953 | KLC4 | HTA11_546_2000001011 | Human | Colorectum | AD | 1.21e-07 | 6.27e-01 | -0.0842 |
| 89953 | KLC4 | HTA11_8622_2000001021 | Human | Colorectum | SER | 1.20e-02 | 3.54e-01 | 0.0528 |
| 89953 | KLC4 | HTA11_10623_2000001011 | Human | Colorectum | AD | 4.21e-03 | 4.13e-01 | -0.0177 |
| 89953 | KLC4 | HTA11_6818_2000001011 | Human | Colorectum | AD | 9.96e-03 | 4.53e-01 | 0.0112 |
| 89953 | KLC4 | HTA11_99999965104_69814 | Human | Colorectum | MSS | 1.32e-03 | 2.70e-01 | 0.281 |
| 89953 | KLC4 | HTA11_99999971662_82457 | Human | Colorectum | MSS | 2.32e-11 | 5.47e-01 | 0.3859 |
| 89953 | KLC4 | A002-C-116 | Human | Colorectum | FAP | 1.61e-02 | -1.48e-01 | -0.0452 |
| 89953 | KLC4 | NAFLD1 | Human | Liver | NAFLD | 4.04e-03 | 4.79e-01 | -0.04 |
| Page: 1 2 |
| Tissue | Expression Dynamics | Abbreviation |
| Colorectum (GSE201348) |  | FAP: Familial adenomatous polyposis |
| CRC: Colorectal cancer | ||
| Colorectum (HTA11) |  | AD: Adenomas |
| SER: Sessile serrated lesions | ||
| MSI-H: Microsatellite-high colorectal cancer | ||
| MSS: Microsatellite stable colorectal cancer | ||
| Liver |  | HCC: Hepatocellular carcinoma |
| NAFLD: Non-alcoholic fatty liver disease | ||
| Thyroid | 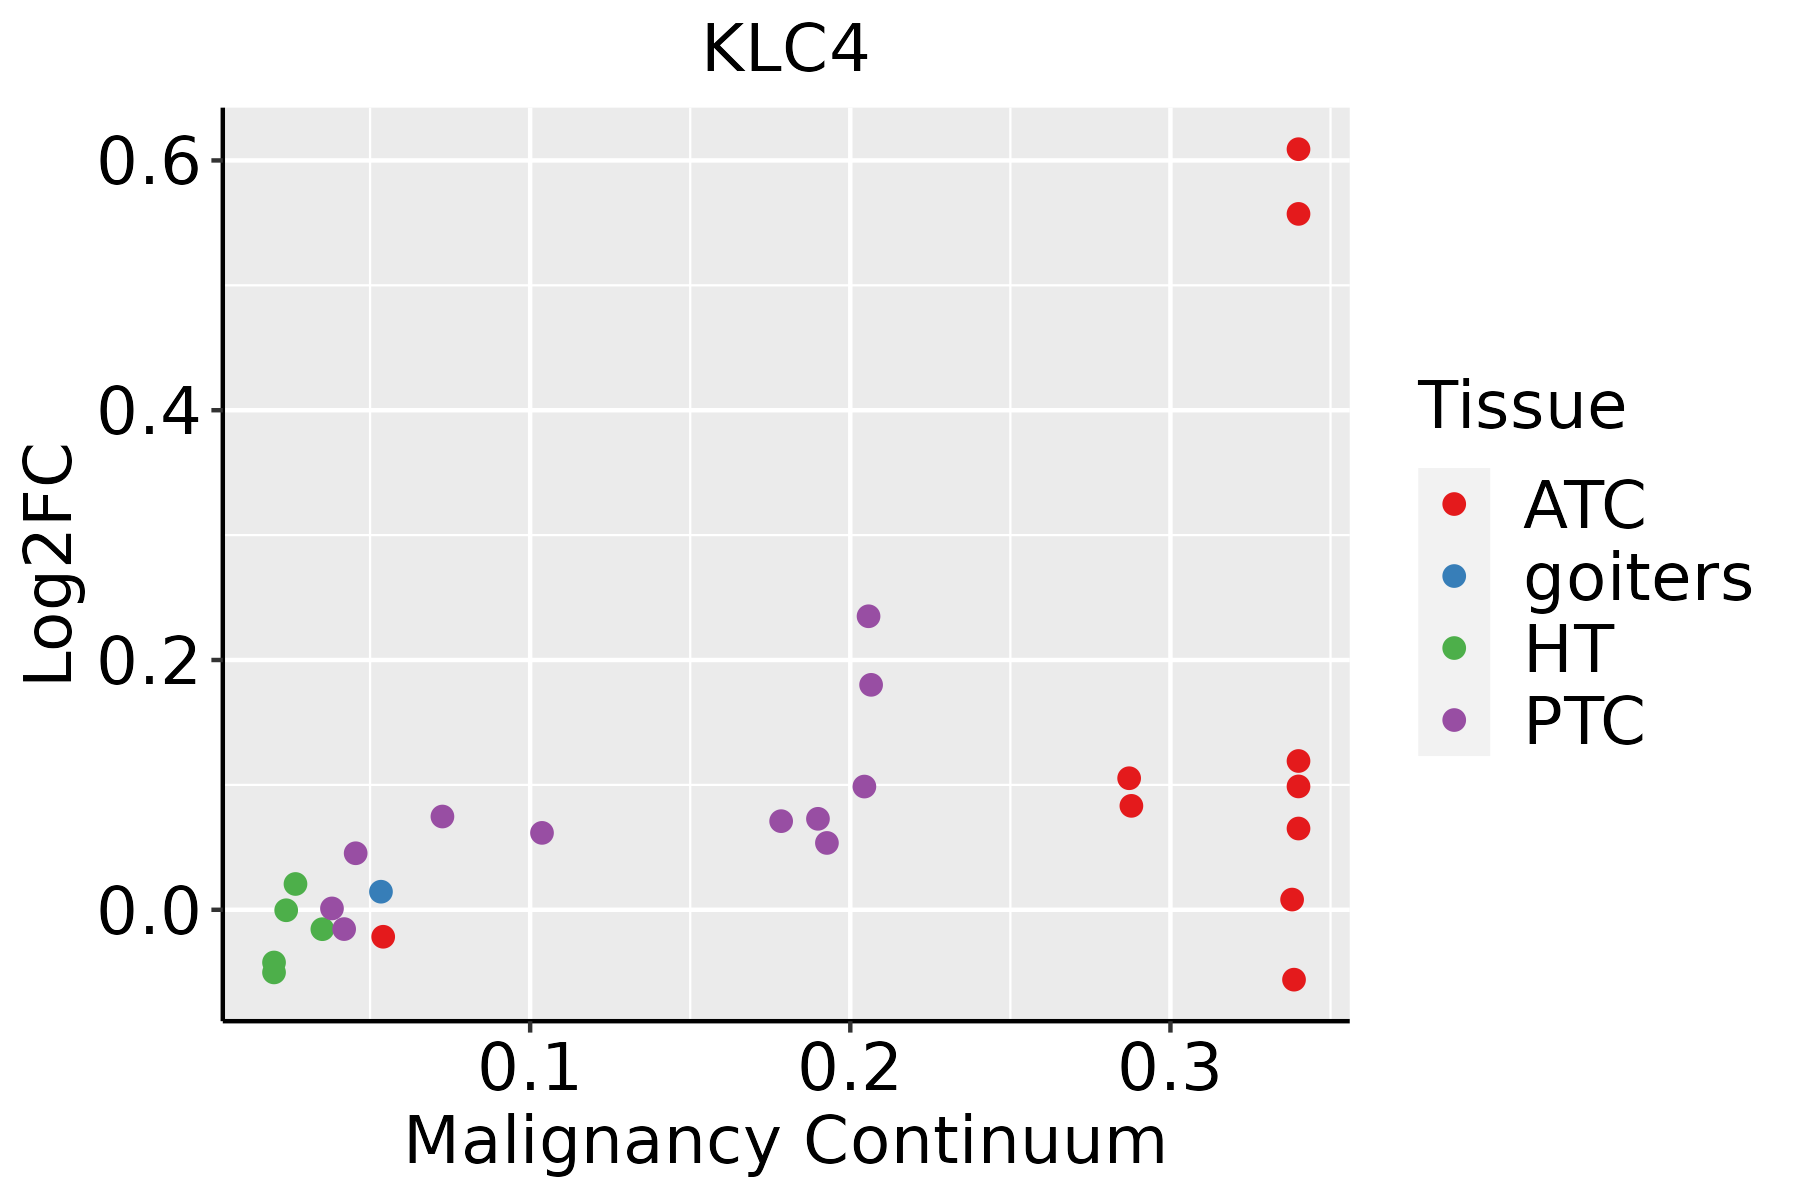 | ATC: Anaplastic thyroid cancer |
| HT: Hashimoto's thyroiditis | ||
| PTC: Papillary thyroid cancer |
| ∗log2FC in expression of this searched gene in stem-like cells from each diseased tissue sample relative to stem-like cells in normal samples in each tissue plotted against the malignancy continuum. Samples are colored based on if they are from different disease stage. |
Top |
Malignant transformation related pathway analysis |
| Find out the enriched GO biological processes and KEGG pathways involved in transition from healthy to precancer to cancer |
| Tissue | Disease Stage | Enriched GO biological Processes |
| Colorectum | AD |  |
| Colorectum | SER |  |
| Colorectum | MSS |  |
| Colorectum | MSI-H |  |
| Colorectum | FAP |  |
| ∗Top 15 enriched GO BP terms are showed in the bar plot of each disease state in each tissue. Each row represents a significant GO biological process which is colored according to the -log10(p.adjust). |
| Page: 1 2 3 4 5 6 7 8 9 |
| GO ID | Tissue | Disease Stage | Description | Gene Ratio | Bg Ratio | pvalue | p.adjust | Count |
| Page: 1 |
| Pathway ID | Tissue | Disease Stage | Description | Gene Ratio | Bg Ratio | pvalue | p.adjust | qvalue | Count |
| hsa05012 | Colorectum | AD | Parkinson disease | 147/2092 | 266/8465 | 2.53e-27 | 8.48e-25 | 5.41e-25 | 147 |
| hsa05010 | Colorectum | AD | Alzheimer disease | 174/2092 | 384/8465 | 1.82e-19 | 9.26e-18 | 5.91e-18 | 174 |
| hsa05016 | Colorectum | AD | Huntington disease | 147/2092 | 306/8465 | 1.93e-19 | 9.26e-18 | 5.91e-18 | 147 |
| hsa05020 | Colorectum | AD | Prion disease | 133/2092 | 273/8465 | 2.47e-18 | 8.29e-17 | 5.29e-17 | 133 |
| hsa05014 | Colorectum | AD | Amyotrophic lateral sclerosis | 164/2092 | 364/8465 | 4.28e-18 | 1.27e-16 | 8.09e-17 | 164 |
| hsa05022 | Colorectum | AD | Pathways of neurodegeneration - multiple diseases | 201/2092 | 476/8465 | 4.54e-18 | 1.27e-16 | 8.09e-17 | 201 |
| hsa05132 | Colorectum | AD | Salmonella infection | 102/2092 | 249/8465 | 7.65e-09 | 1.28e-07 | 8.17e-08 | 102 |
| hsa050121 | Colorectum | AD | Parkinson disease | 147/2092 | 266/8465 | 2.53e-27 | 8.48e-25 | 5.41e-25 | 147 |
| hsa050101 | Colorectum | AD | Alzheimer disease | 174/2092 | 384/8465 | 1.82e-19 | 9.26e-18 | 5.91e-18 | 174 |
| hsa050161 | Colorectum | AD | Huntington disease | 147/2092 | 306/8465 | 1.93e-19 | 9.26e-18 | 5.91e-18 | 147 |
| hsa050201 | Colorectum | AD | Prion disease | 133/2092 | 273/8465 | 2.47e-18 | 8.29e-17 | 5.29e-17 | 133 |
| hsa050141 | Colorectum | AD | Amyotrophic lateral sclerosis | 164/2092 | 364/8465 | 4.28e-18 | 1.27e-16 | 8.09e-17 | 164 |
| hsa050221 | Colorectum | AD | Pathways of neurodegeneration - multiple diseases | 201/2092 | 476/8465 | 4.54e-18 | 1.27e-16 | 8.09e-17 | 201 |
| hsa051321 | Colorectum | AD | Salmonella infection | 102/2092 | 249/8465 | 7.65e-09 | 1.28e-07 | 8.17e-08 | 102 |
| hsa050122 | Colorectum | SER | Parkinson disease | 132/1580 | 266/8465 | 2.72e-31 | 9.03e-29 | 6.55e-29 | 132 |
| hsa050202 | Colorectum | SER | Prion disease | 119/1580 | 273/8465 | 4.61e-22 | 3.06e-20 | 2.22e-20 | 119 |
| hsa050162 | Colorectum | SER | Huntington disease | 127/1580 | 306/8465 | 3.29e-21 | 1.37e-19 | 9.92e-20 | 127 |
| hsa050102 | Colorectum | SER | Alzheimer disease | 146/1580 | 384/8465 | 6.52e-20 | 2.40e-18 | 1.75e-18 | 146 |
| hsa050222 | Colorectum | SER | Pathways of neurodegeneration - multiple diseases | 168/1580 | 476/8465 | 6.23e-19 | 2.07e-17 | 1.50e-17 | 168 |
| hsa050142 | Colorectum | SER | Amyotrophic lateral sclerosis | 138/1580 | 364/8465 | 9.89e-19 | 2.99e-17 | 2.17e-17 | 138 |
| Page: 1 2 3 4 |
Top |
Cell-cell communication analysis |
| Identification of potential cell-cell interactions between two cell types and their ligand-receptor pairs for different disease states |
| Ligand | Receptor | LRpair | Pathway | Tissue | Disease Stage |
| Page: 1 |
Top |
Single-cell gene regulatory network inference analysis |
| Find out the significant the regulons (TFs) and the target genes of each regulon across cell types for different disease states |
| TF | Cell Type | Tissue | Disease Stage | Target Gene | RSS | Regulon Activity |
| ∗The dot plots of a searched regulon are shown for all cell subpopulations in each disease state of each tissue based on the regulon specific score inferred using pySCENIC and by calculating the average expression. |
| Page: 1 |
Top |
Somatic mutation of malignant transformation related genes |
| Annotation of somatic variants for genes involved in malignant transformation |
| Hugo Symbol | Variant Class | Variant Classification | dbSNP RS | HGVSc | HGVSp | HGVSp Short | SWISSPROT | BIOTYPE | SIFT | PolyPhen | Tumor Sample Barcode | Tissue | Histology | Sex | Age | Stage | Therapy Types | Drugs | Outcome |
| KLC4 | SNV | Missense_Mutation | c.1125A>T | p.Glu375Asp | p.E375D | Q9NSK0 | protein_coding | deleterious(0) | probably_damaging(0.977) | TCGA-A8-A09W-01 | Breast | breast invasive carcinoma | Female | >=65 | III/IV | Unknown | Unknown | SD | |
| KLC4 | SNV | Missense_Mutation | rs557603845 | c.1480C>T | p.Arg494Cys | p.R494C | Q9NSK0 | protein_coding | deleterious(0) | probably_damaging(0.932) | TCGA-AO-A0JD-01 | Breast | breast invasive carcinoma | Female | <65 | III/IV | Chemotherapy | cyclophosphamide | SD |
| KLC4 | SNV | Missense_Mutation | c.275C>T | p.Ser92Phe | p.S92F | Q9NSK0 | protein_coding | deleterious(0.03) | probably_damaging(0.994) | TCGA-D8-A142-01 | Breast | breast invasive carcinoma | Female | >=65 | I/II | Chemotherapy | cyclophosphamid | SD | |
| KLC4 | SNV | Missense_Mutation | novel | c.634N>T | p.Gly212Cys | p.G212C | Q9NSK0 | protein_coding | deleterious(0) | probably_damaging(0.917) | TCGA-OL-A5DA-01 | Breast | breast invasive carcinoma | Female | <65 | I/II | Unknown | Unknown | SD |
| KLC4 | SNV | Missense_Mutation | novel | c.1557N>G | p.Ile519Met | p.I519M | Q9NSK0 | protein_coding | tolerated(0.05) | possibly_damaging(0.515) | TCGA-DS-A1OB-01 | Cervix | cervical & endocervical cancer | Female | <65 | I/II | Chemotherapy | carboplatin | PD |
| KLC4 | SNV | Missense_Mutation | rs368025562 | c.1534C>T | p.Arg512Trp | p.R512W | Q9NSK0 | protein_coding | deleterious(0.02) | benign(0.011) | TCGA-EA-A410-01 | Cervix | cervical & endocervical cancer | Female | <65 | I/II | Unknown | Unknown | SD |
| KLC4 | SNV | Missense_Mutation | novel | c.1174N>C | p.Asp392His | p.D392H | Q9NSK0 | protein_coding | tolerated(0.08) | probably_damaging(0.998) | TCGA-VS-A958-01 | Cervix | cervical & endocervical cancer | Female | <65 | I/II | Chemotherapy | cisplatin | CR |
| KLC4 | SNV | Missense_Mutation | rs201506218 | c.79N>T | p.Arg27Trp | p.R27W | Q9NSK0 | protein_coding | deleterious_low_confidence(0) | possibly_damaging(0.736) | TCGA-AA-3695-01 | Colorectum | colon adenocarcinoma | Female | <65 | III/IV | Unknown | Unknown | SD |
| KLC4 | SNV | Missense_Mutation | rs372388180 | c.542N>T | p.Ser181Leu | p.S181L | Q9NSK0 | protein_coding | tolerated(0.17) | benign(0.012) | TCGA-AA-3713-01 | Colorectum | colon adenocarcinoma | Male | >=65 | III/IV | Chemotherapy | 5-fluorouracil | PR |
| KLC4 | SNV | Missense_Mutation | novel | c.580N>T | p.Asp194Tyr | p.D194Y | Q9NSK0 | protein_coding | deleterious(0) | probably_damaging(0.998) | TCGA-AA-3845-01 | Colorectum | colon adenocarcinoma | Female | >=65 | I/II | Unknown | Unknown | PD |
| Page: 1 2 3 4 5 6 |
Top |
Related drugs of malignant transformation related genes |
| Identification of chemicals and drugs interact with genes involved in malignant transfromation |
| (DGIdb 4.0) |
| Entrez ID | Symbol | Category | Interaction Types | Drug Claim Name | Drug Name | PMIDs |
| Page: 1 |

Copyright 2023-Present -The University of Texas Health Science Center at Houston |