
|
|||||
|
 | |
| |
| |
| |
| |
| |
|
Gene: KLC1 |
Gene summary for KLC1 |
| Gene information | Species | Human | Gene symbol | KLC1 | Gene ID | 3831 |
| Gene name | kinesin light chain 1 | |
| Gene Alias | KLC | |
| Cytomap | 14q32.33 | |
| Gene Type | protein-coding | GO ID | GO:0006996 | UniProtAcc | Q07866 |
Top |
Malignant transformation analysis |
| Identification of the aberrant gene expression in precancerous and cancerous lesions by comparing the gene expression of stem-like cells in diseased tissues with normal stem cells |
| Entrez ID | Symbol | Replicates | Species | Organ | Tissue | Adj P-value | Log2FC | Malignancy |
| 3831 | KLC1 | LZE4T | Human | Esophagus | ESCC | 1.98e-05 | 1.48e-01 | 0.0811 |
| 3831 | KLC1 | LZE7T | Human | Esophagus | ESCC | 4.78e-06 | 1.18e-01 | 0.0667 |
| 3831 | KLC1 | LZE20T | Human | Esophagus | ESCC | 4.72e-06 | 2.67e-01 | 0.0662 |
| 3831 | KLC1 | LZE22T | Human | Esophagus | ESCC | 1.11e-02 | 2.76e-01 | 0.068 |
| 3831 | KLC1 | LZE24T | Human | Esophagus | ESCC | 1.01e-15 | 3.26e-01 | 0.0596 |
| 3831 | KLC1 | LZE6T | Human | Esophagus | ESCC | 1.01e-03 | 5.90e-02 | 0.0845 |
| 3831 | KLC1 | P1T-E | Human | Esophagus | ESCC | 3.18e-03 | 2.69e-01 | 0.0875 |
| 3831 | KLC1 | P2T-E | Human | Esophagus | ESCC | 7.75e-29 | 4.34e-01 | 0.1177 |
| 3831 | KLC1 | P4T-E | Human | Esophagus | ESCC | 9.00e-22 | 5.26e-01 | 0.1323 |
| 3831 | KLC1 | P5T-E | Human | Esophagus | ESCC | 5.97e-22 | 4.34e-01 | 0.1327 |
| 3831 | KLC1 | P8T-E | Human | Esophagus | ESCC | 7.79e-20 | 3.17e-01 | 0.0889 |
| 3831 | KLC1 | P9T-E | Human | Esophagus | ESCC | 3.75e-13 | 2.43e-01 | 0.1131 |
| 3831 | KLC1 | P10T-E | Human | Esophagus | ESCC | 3.03e-69 | 1.36e+00 | 0.116 |
| 3831 | KLC1 | P11T-E | Human | Esophagus | ESCC | 8.02e-09 | 3.65e-01 | 0.1426 |
| 3831 | KLC1 | P12T-E | Human | Esophagus | ESCC | 7.27e-32 | 6.56e-01 | 0.1122 |
| 3831 | KLC1 | P15T-E | Human | Esophagus | ESCC | 2.54e-34 | 7.28e-01 | 0.1149 |
| 3831 | KLC1 | P16T-E | Human | Esophagus | ESCC | 4.90e-22 | 4.21e-01 | 0.1153 |
| 3831 | KLC1 | P17T-E | Human | Esophagus | ESCC | 3.40e-08 | 2.60e-01 | 0.1278 |
| 3831 | KLC1 | P19T-E | Human | Esophagus | ESCC | 2.81e-04 | 6.32e-01 | 0.1662 |
| 3831 | KLC1 | P20T-E | Human | Esophagus | ESCC | 2.29e-17 | 3.50e-01 | 0.1124 |
| Page: 1 2 3 4 5 6 7 |
| Tissue | Expression Dynamics | Abbreviation |
| Esophagus | 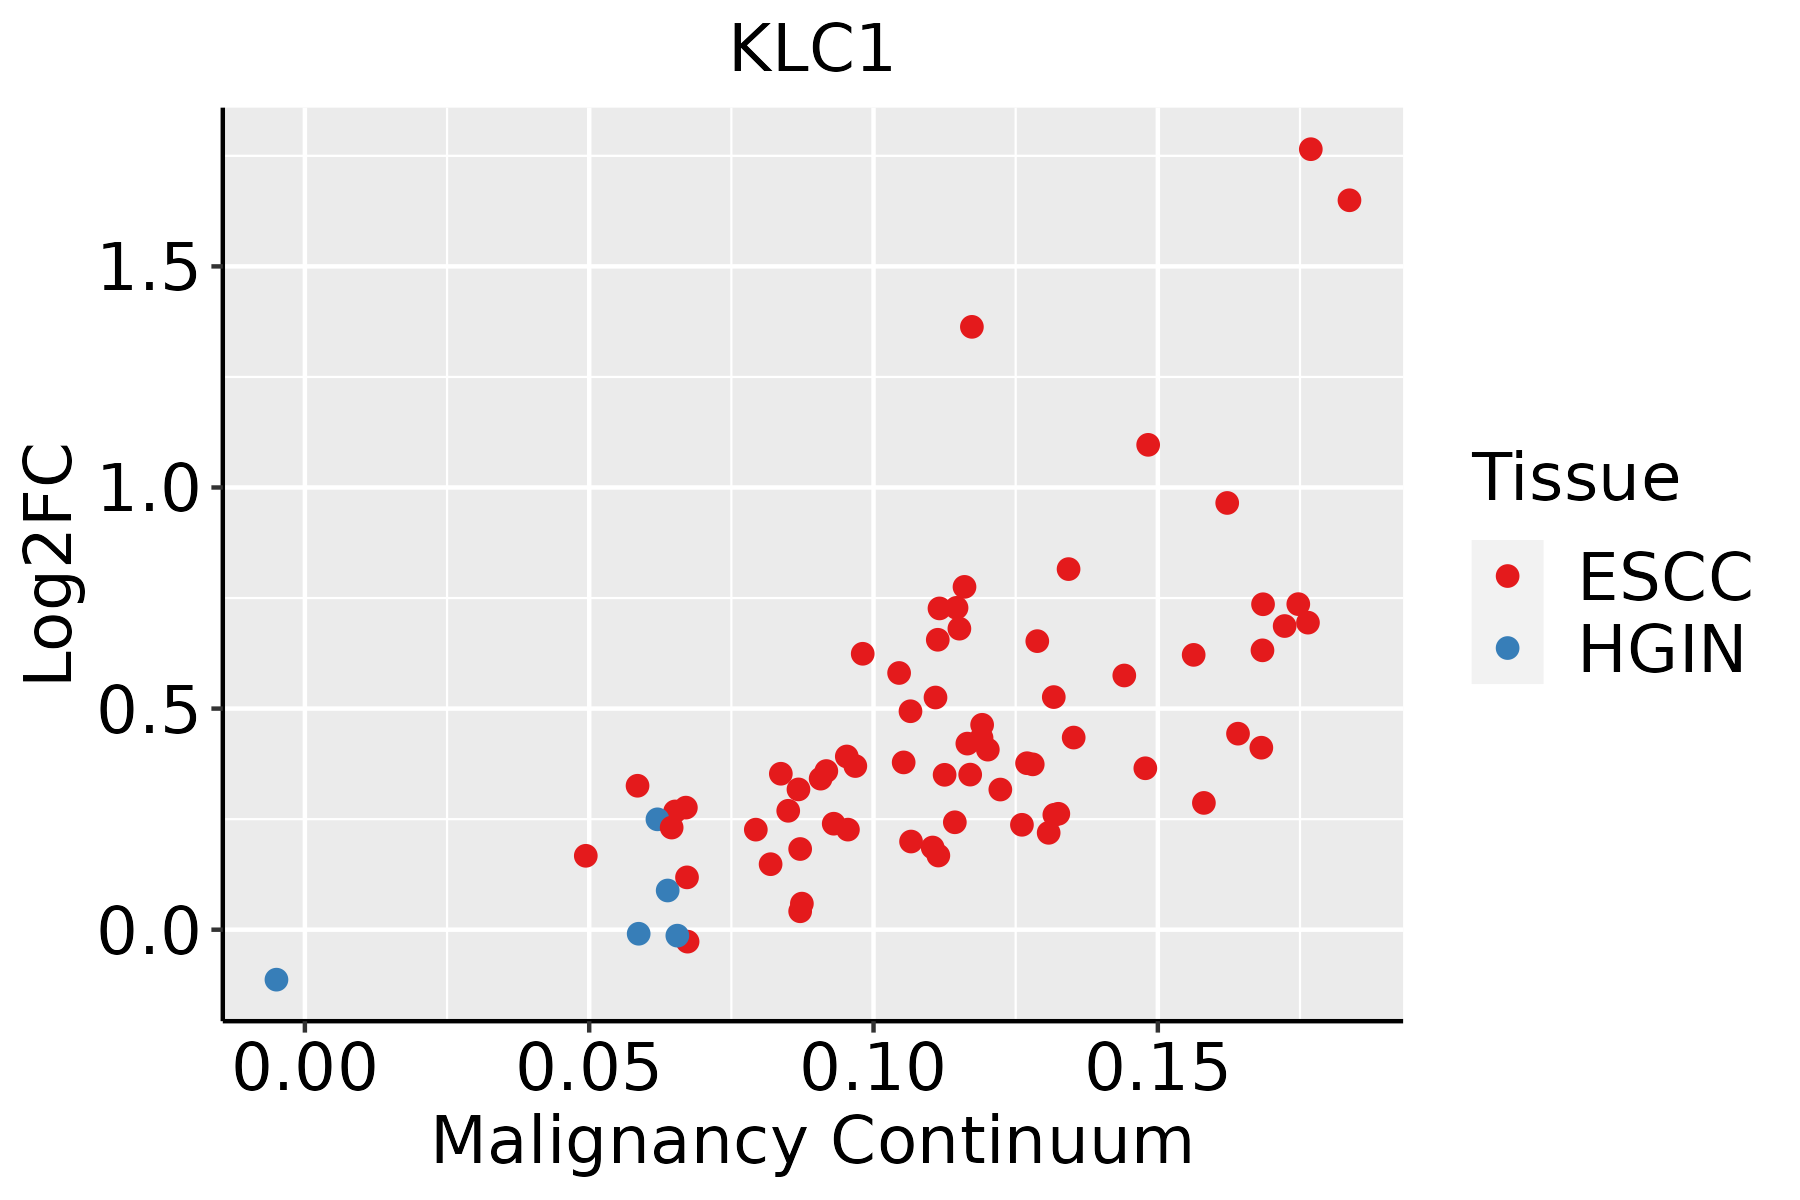 | ESCC: Esophageal squamous cell carcinoma |
| HGIN: High-grade intraepithelial neoplasias | ||
| LGIN: Low-grade intraepithelial neoplasias | ||
| Liver | 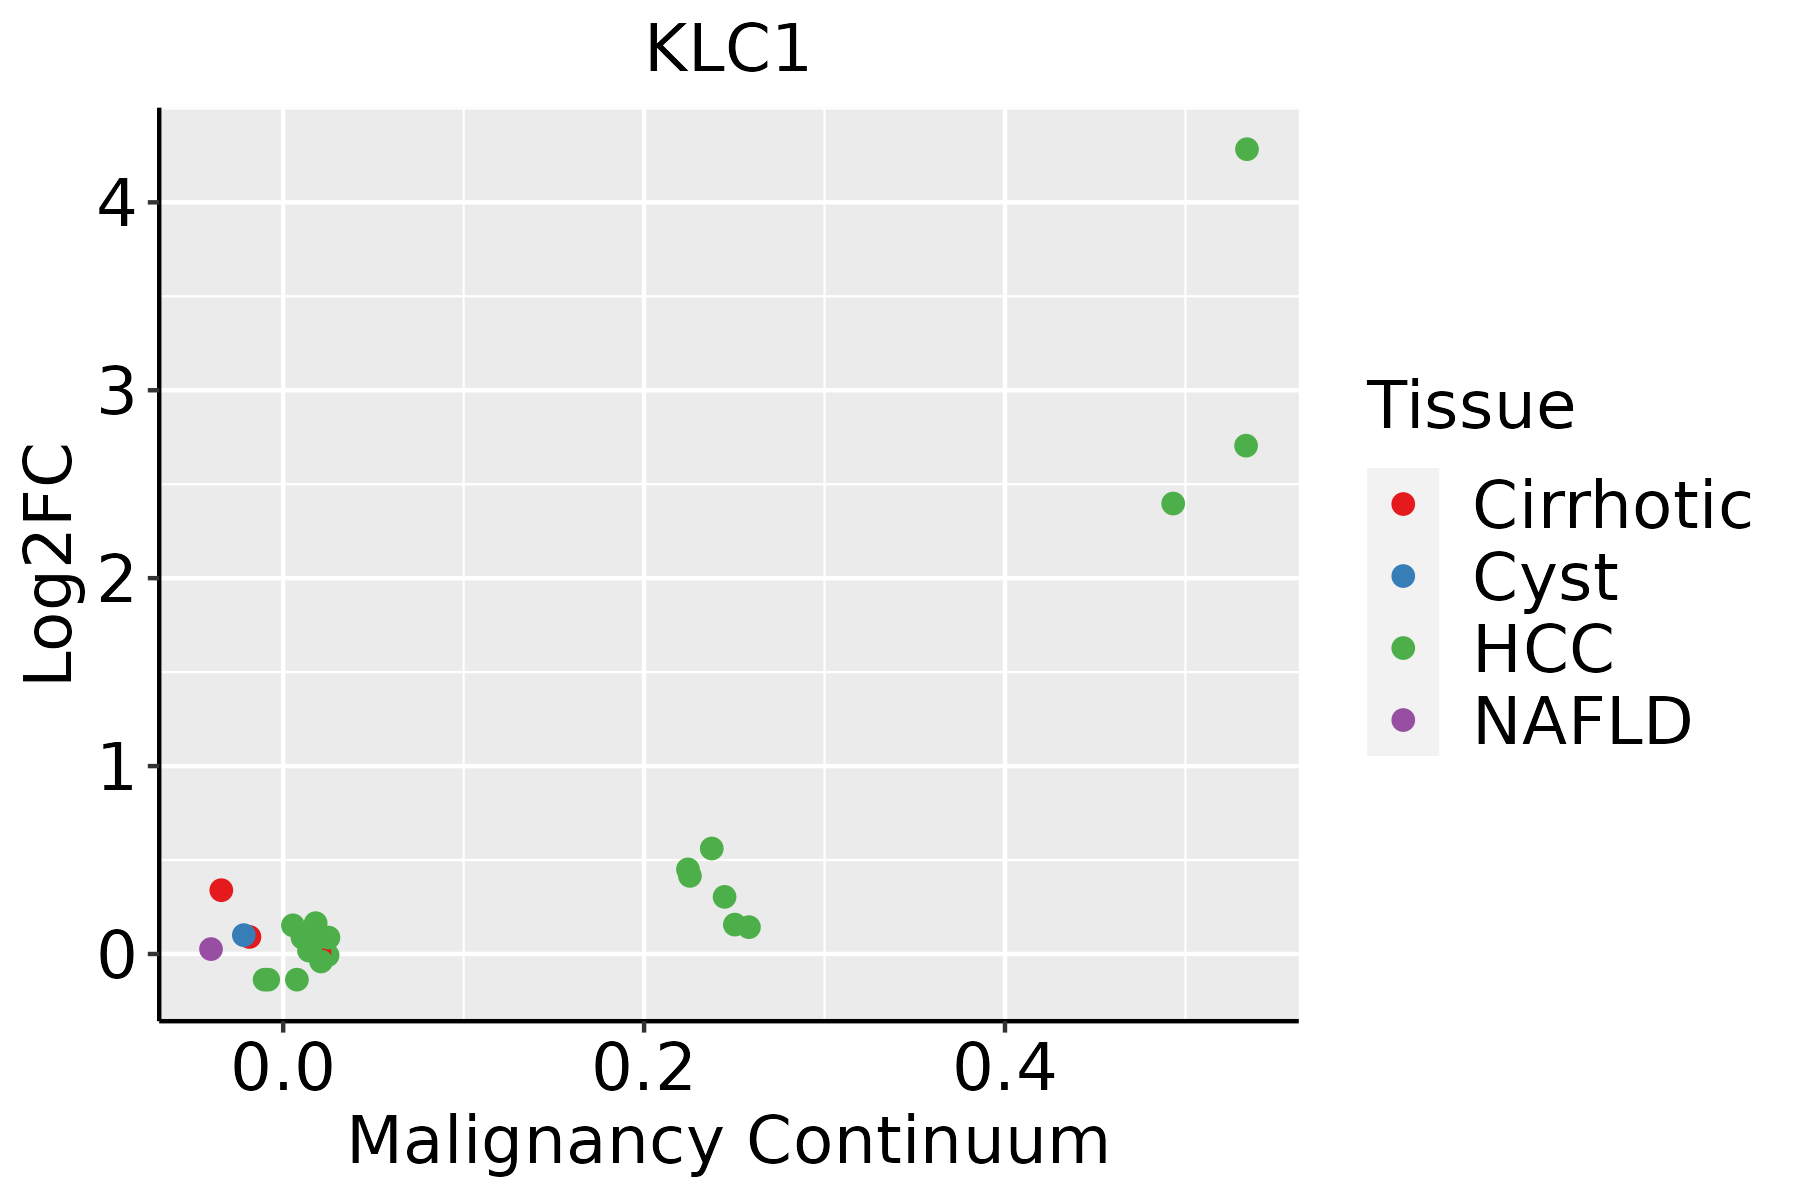 | HCC: Hepatocellular carcinoma |
| NAFLD: Non-alcoholic fatty liver disease | ||
| Lung | 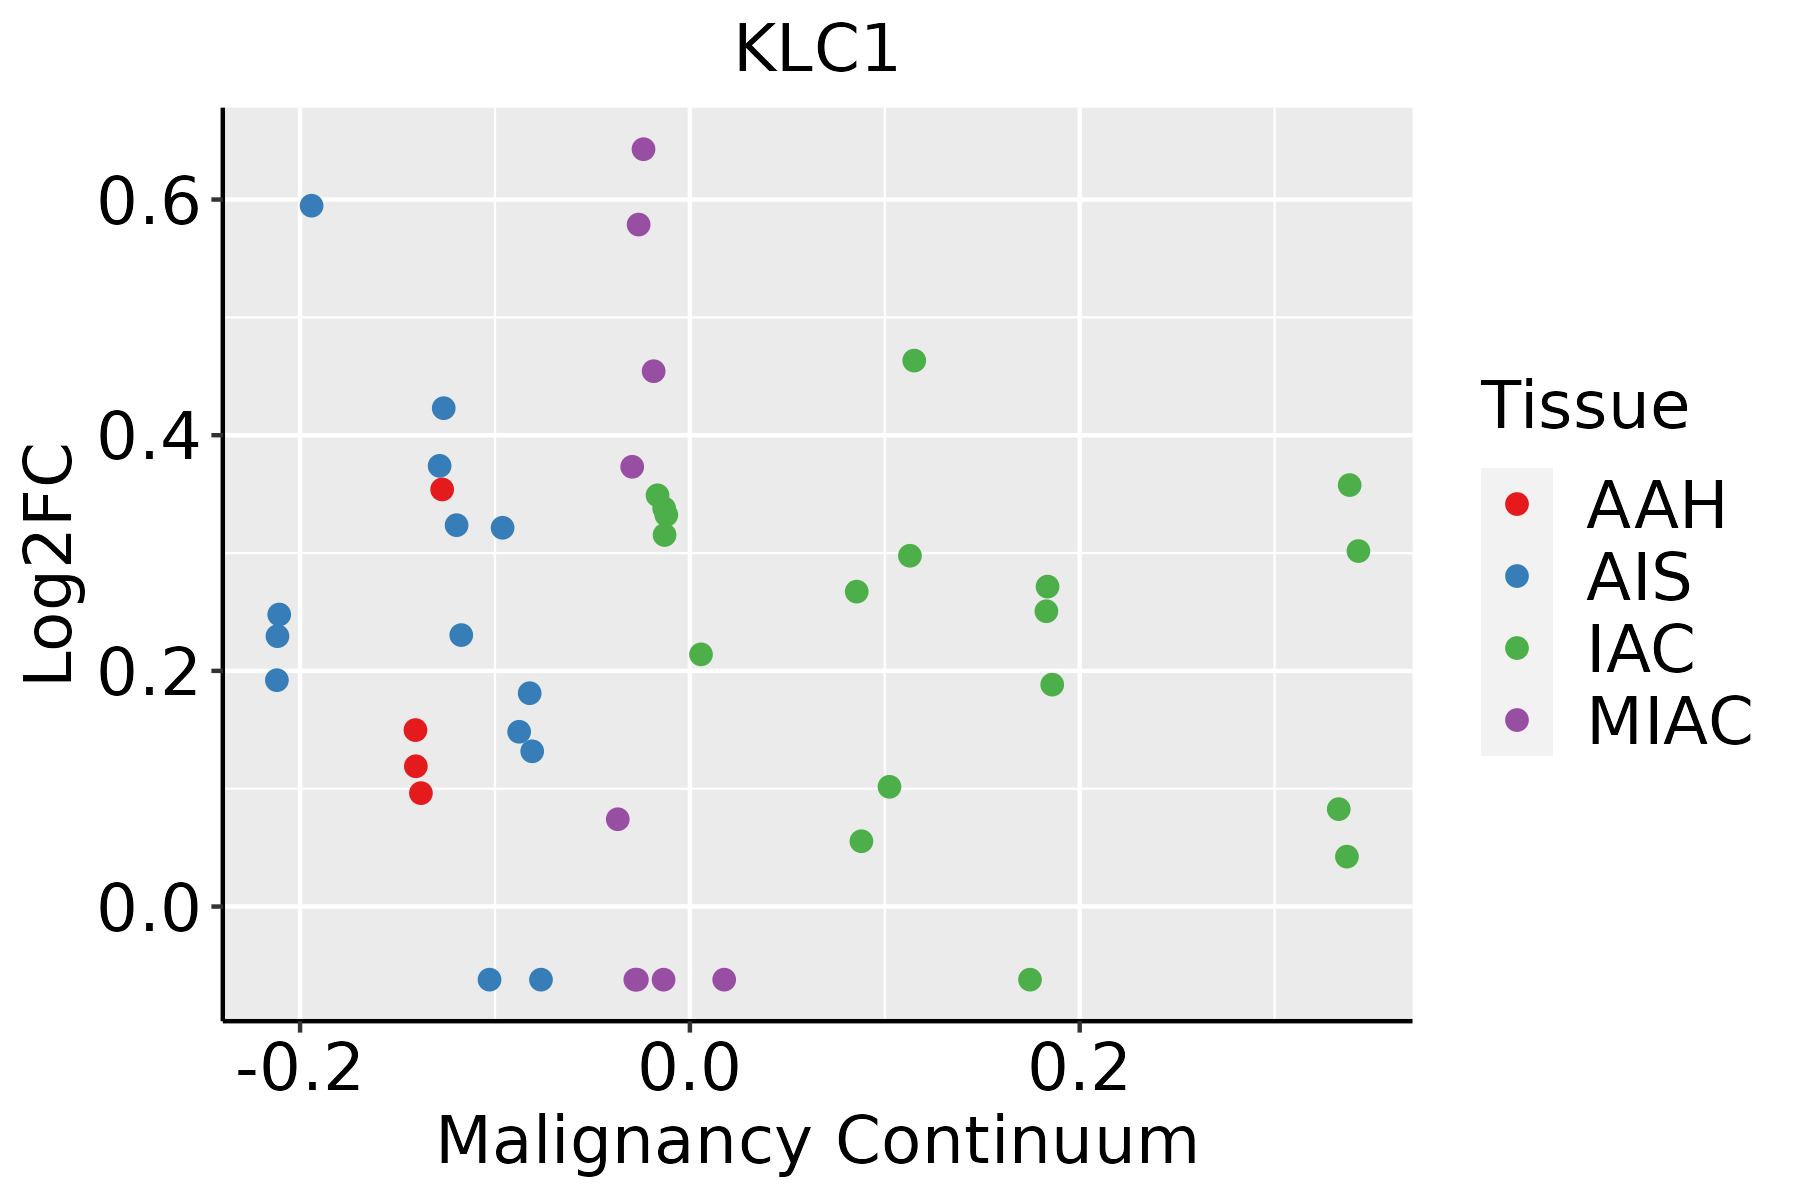 | AAH: Atypical adenomatous hyperplasia |
| AIS: Adenocarcinoma in situ | ||
| IAC: Invasive lung adenocarcinoma | ||
| MIA: Minimally invasive adenocarcinoma | ||
| Oral Cavity | 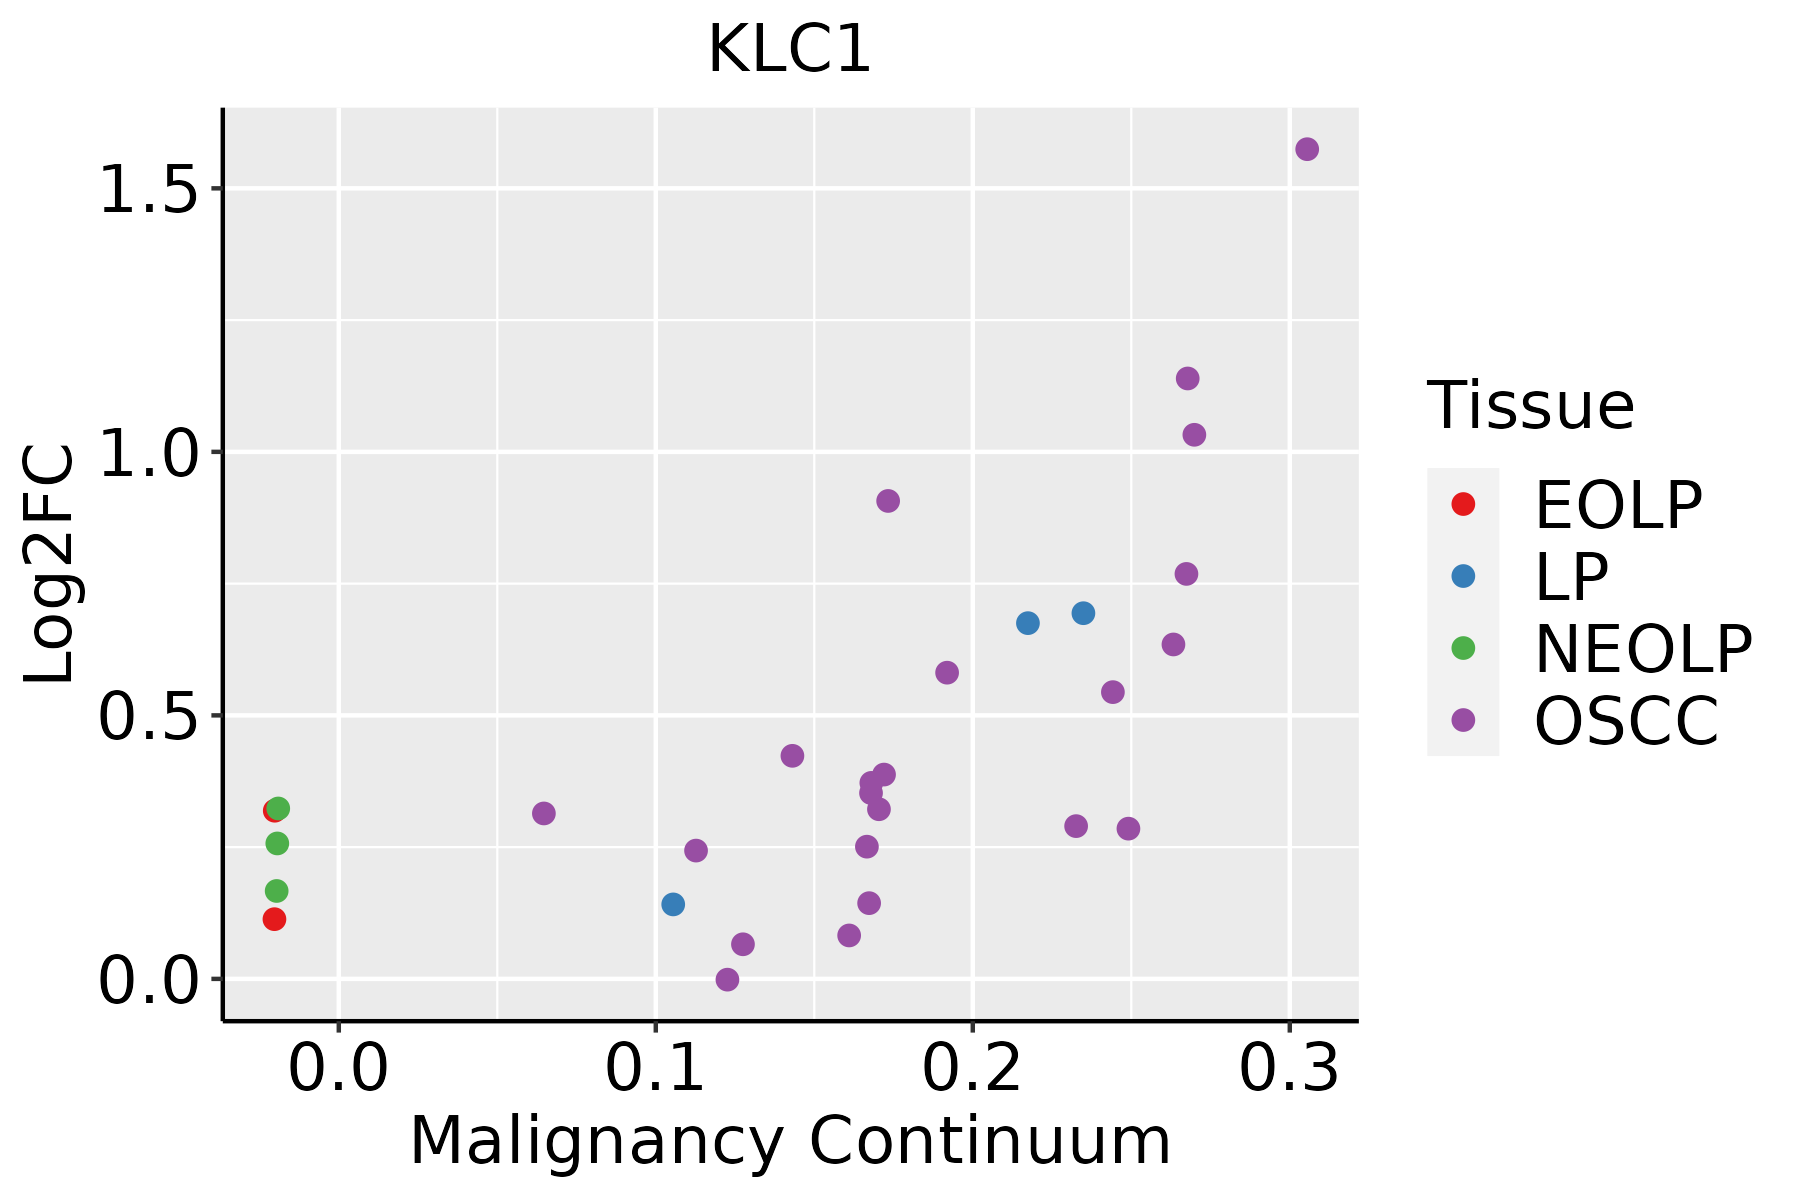 | EOLP: Erosive Oral lichen planus |
| LP: leukoplakia | ||
| NEOLP: Non-erosive oral lichen planus | ||
| OSCC: Oral squamous cell carcinoma | ||
| Skin |  | AK: Actinic keratosis |
| cSCC: Cutaneous squamous cell carcinoma | ||
| SCCIS:squamous cell carcinoma in situ | ||
| Thyroid | 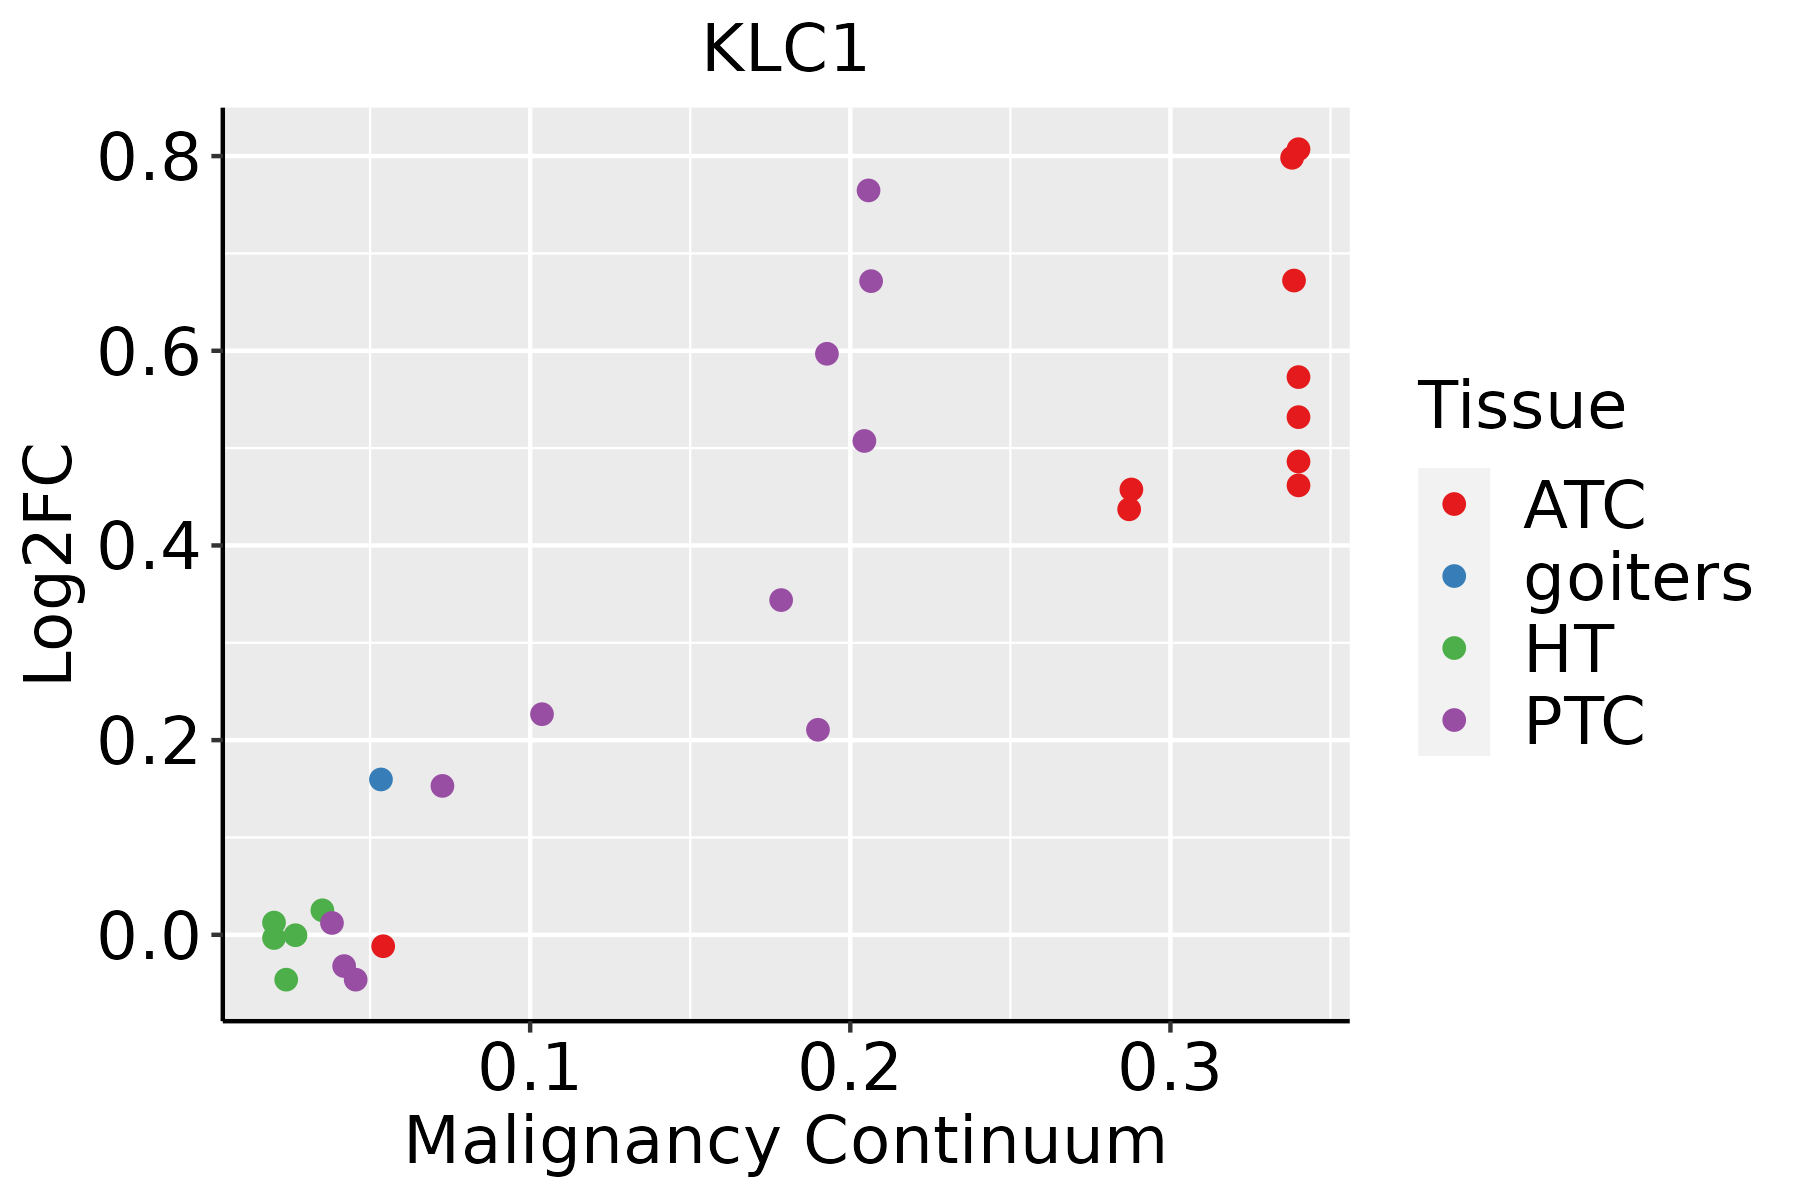 | ATC: Anaplastic thyroid cancer |
| HT: Hashimoto's thyroiditis | ||
| PTC: Papillary thyroid cancer |
| ∗log2FC in expression of this searched gene in stem-like cells from each diseased tissue sample relative to stem-like cells in normal samples in each tissue plotted against the malignancy continuum. Samples are colored based on if they are from different disease stage. |
Top |
Malignant transformation related pathway analysis |
| Find out the enriched GO biological processes and KEGG pathways involved in transition from healthy to precancer to cancer |
| Tissue | Disease Stage | Enriched GO biological Processes |
| Colorectum | AD |  |
| Colorectum | SER |  |
| Colorectum | MSS |  |
| Colorectum | MSI-H |  |
| Colorectum | FAP |  |
| ∗Top 15 enriched GO BP terms are showed in the bar plot of each disease state in each tissue. Each row represents a significant GO biological process which is colored according to the -log10(p.adjust). |
| Page: 1 2 3 4 5 6 7 8 9 |
| GO ID | Tissue | Disease Stage | Description | Gene Ratio | Bg Ratio | pvalue | p.adjust | Count |
| GO:0022411111 | Esophagus | ESCC | cellular component disassembly | 305/8552 | 443/18723 | 1.94e-23 | 4.57e-21 | 305 |
| GO:0071826111 | Esophagus | ESCC | ribonucleoprotein complex subunit organization | 166/8552 | 227/18723 | 2.94e-17 | 2.42e-15 | 166 |
| GO:190300816 | Esophagus | ESCC | organelle disassembly | 89/8552 | 114/18723 | 1.36e-12 | 5.80e-11 | 89 |
| GO:003298416 | Esophagus | ESCC | protein-containing complex disassembly | 151/8552 | 224/18723 | 3.45e-11 | 1.15e-09 | 151 |
| GO:002241112 | Liver | HCC | cellular component disassembly | 282/7958 | 443/18723 | 1.02e-19 | 1.38e-17 | 282 |
| GO:007182622 | Liver | HCC | ribonucleoprotein complex subunit organization | 159/7958 | 227/18723 | 3.14e-17 | 3.06e-15 | 159 |
| GO:190300811 | Liver | HCC | organelle disassembly | 89/7958 | 114/18723 | 8.68e-15 | 5.73e-13 | 89 |
| GO:003298411 | Liver | HCC | protein-containing complex disassembly | 138/7958 | 224/18723 | 5.59e-09 | 1.46e-07 | 138 |
| GO:00718268 | Lung | IAC | ribonucleoprotein complex subunit organization | 46/2061 | 227/18723 | 3.02e-05 | 7.79e-04 | 46 |
| GO:00224118 | Lung | IAC | cellular component disassembly | 68/2061 | 443/18723 | 2.89e-03 | 2.60e-02 | 68 |
| GO:007182613 | Lung | AIS | ribonucleoprotein complex subunit organization | 41/1849 | 227/18723 | 1.03e-04 | 2.50e-03 | 41 |
| GO:007182633 | Lung | MIAC | ribonucleoprotein complex subunit organization | 29/967 | 227/18723 | 6.37e-06 | 6.28e-04 | 29 |
| GO:002241119 | Oral cavity | OSCC | cellular component disassembly | 283/7305 | 443/18723 | 9.57e-27 | 3.37e-24 | 283 |
| GO:007182620 | Oral cavity | OSCC | ribonucleoprotein complex subunit organization | 152/7305 | 227/18723 | 1.05e-17 | 1.01e-15 | 152 |
| GO:19030088 | Oral cavity | OSCC | organelle disassembly | 85/7305 | 114/18723 | 1.15e-14 | 6.93e-13 | 85 |
| GO:003298410 | Oral cavity | OSCC | protein-containing complex disassembly | 136/7305 | 224/18723 | 3.42e-11 | 1.13e-09 | 136 |
| GO:0071826110 | Oral cavity | LP | ribonucleoprotein complex subunit organization | 130/4623 | 227/18723 | 7.54e-26 | 3.63e-23 | 130 |
| GO:0022411110 | Oral cavity | LP | cellular component disassembly | 173/4623 | 443/18723 | 9.97e-12 | 7.44e-10 | 173 |
| GO:190300815 | Oral cavity | LP | organelle disassembly | 60/4623 | 114/18723 | 1.28e-10 | 7.30e-09 | 60 |
| GO:003298414 | Oral cavity | LP | protein-containing complex disassembly | 83/4623 | 224/18723 | 2.38e-05 | 3.86e-04 | 83 |
| Page: 1 2 3 |
| Pathway ID | Tissue | Disease Stage | Description | Gene Ratio | Bg Ratio | pvalue | p.adjust | qvalue | Count |
| hsa05014210 | Esophagus | ESCC | Amyotrophic lateral sclerosis | 266/4205 | 364/8465 | 1.31e-20 | 2.20e-18 | 1.13e-18 | 266 |
| hsa05132211 | Esophagus | ESCC | Salmonella infection | 191/4205 | 249/8465 | 6.51e-19 | 5.45e-17 | 2.79e-17 | 191 |
| hsa05016210 | Esophagus | ESCC | Huntington disease | 226/4205 | 306/8465 | 1.38e-18 | 8.72e-17 | 4.46e-17 | 226 |
| hsa05012211 | Esophagus | ESCC | Parkinson disease | 201/4205 | 266/8465 | 1.56e-18 | 8.72e-17 | 4.46e-17 | 201 |
| hsa05022210 | Esophagus | ESCC | Pathways of neurodegeneration - multiple diseases | 318/4205 | 476/8465 | 6.10e-15 | 2.04e-13 | 1.05e-13 | 318 |
| hsa05010210 | Esophagus | ESCC | Alzheimer disease | 263/4205 | 384/8465 | 1.80e-14 | 5.47e-13 | 2.80e-13 | 263 |
| hsa05020210 | Esophagus | ESCC | Prion disease | 193/4205 | 273/8465 | 6.42e-13 | 1.34e-11 | 6.89e-12 | 193 |
| hsa0501438 | Esophagus | ESCC | Amyotrophic lateral sclerosis | 266/4205 | 364/8465 | 1.31e-20 | 2.20e-18 | 1.13e-18 | 266 |
| hsa05132310 | Esophagus | ESCC | Salmonella infection | 191/4205 | 249/8465 | 6.51e-19 | 5.45e-17 | 2.79e-17 | 191 |
| hsa0501638 | Esophagus | ESCC | Huntington disease | 226/4205 | 306/8465 | 1.38e-18 | 8.72e-17 | 4.46e-17 | 226 |
| hsa05012310 | Esophagus | ESCC | Parkinson disease | 201/4205 | 266/8465 | 1.56e-18 | 8.72e-17 | 4.46e-17 | 201 |
| hsa0502238 | Esophagus | ESCC | Pathways of neurodegeneration - multiple diseases | 318/4205 | 476/8465 | 6.10e-15 | 2.04e-13 | 1.05e-13 | 318 |
| hsa0501038 | Esophagus | ESCC | Alzheimer disease | 263/4205 | 384/8465 | 1.80e-14 | 5.47e-13 | 2.80e-13 | 263 |
| hsa0502038 | Esophagus | ESCC | Prion disease | 193/4205 | 273/8465 | 6.42e-13 | 1.34e-11 | 6.89e-12 | 193 |
| hsa0501222 | Liver | HCC | Parkinson disease | 198/4020 | 266/8465 | 9.40e-20 | 1.58e-17 | 8.76e-18 | 198 |
| hsa0501622 | Liver | HCC | Huntington disease | 219/4020 | 306/8465 | 3.06e-18 | 3.42e-16 | 1.90e-16 | 219 |
| hsa0501422 | Liver | HCC | Amyotrophic lateral sclerosis | 252/4020 | 364/8465 | 8.85e-18 | 7.41e-16 | 4.12e-16 | 252 |
| hsa0502022 | Liver | HCC | Prion disease | 195/4020 | 273/8465 | 3.26e-16 | 1.56e-14 | 8.67e-15 | 195 |
| hsa0513242 | Liver | HCC | Salmonella infection | 178/4020 | 249/8465 | 5.90e-15 | 1.98e-13 | 1.10e-13 | 178 |
| hsa0501022 | Liver | HCC | Alzheimer disease | 254/4020 | 384/8465 | 3.75e-14 | 8.97e-13 | 4.99e-13 | 254 |
| Page: 1 2 3 4 5 |
Top |
Cell-cell communication analysis |
| Identification of potential cell-cell interactions between two cell types and their ligand-receptor pairs for different disease states |
| Ligand | Receptor | LRpair | Pathway | Tissue | Disease Stage |
| Page: 1 |
Top |
Single-cell gene regulatory network inference analysis |
| Find out the significant the regulons (TFs) and the target genes of each regulon across cell types for different disease states |
| TF | Cell Type | Tissue | Disease Stage | Target Gene | RSS | Regulon Activity |
| ∗The dot plots of a searched regulon are shown for all cell subpopulations in each disease state of each tissue based on the regulon specific score inferred using pySCENIC and by calculating the average expression. |
| Page: 1 |
Top |
Somatic mutation of malignant transformation related genes |
| Annotation of somatic variants for genes involved in malignant transformation |
| Hugo Symbol | Variant Class | Variant Classification | dbSNP RS | HGVSc | HGVSp | HGVSp Short | SWISSPROT | BIOTYPE | SIFT | PolyPhen | Tumor Sample Barcode | Tissue | Histology | Sex | Age | Stage | Therapy Types | Drugs | Outcome |
| KLC1 | SNV | Missense_Mutation | c.937N>C | p.Tyr313His | p.Y313H | Q07866 | protein_coding | deleterious(0.03) | possibly_damaging(0.728) | TCGA-AO-A128-01 | Breast | breast invasive carcinoma | Female | <65 | I/II | Chemotherapy | doxorubicin | SD | |
| KLC1 | SNV | Missense_Mutation | novel | c.973G>C | p.Glu325Gln | p.E325Q | Q07866 | protein_coding | deleterious(0.03) | possibly_damaging(0.832) | TCGA-BH-A0B6-01 | Breast | breast invasive carcinoma | Female | <65 | I/II | Unknown | Unknown | SD |
| KLC1 | SNV | Missense_Mutation | novel | c.1569N>C | p.Glu523Asp | p.E523D | Q07866 | protein_coding | tolerated_low_confidence(0.54) | benign(0.003) | TCGA-BH-A2L8-01 | Breast | breast invasive carcinoma | Female | <65 | I/II | Chemotherapy | cytoxan | CR |
| KLC1 | SNV | Missense_Mutation | c.1496N>G | p.Asp499Gly | p.D499G | Q07866 | protein_coding | deleterious(0.03) | possibly_damaging(0.756) | TCGA-D8-A1XQ-01 | Breast | breast invasive carcinoma | Female | >=65 | I/II | Unknown | Unknown | SD | |
| KLC1 | insertion | Nonsense_Mutation | novel | c.759_760insCCCAGGGCAAGGAAGTGAGTGATGGGTGATGCAG | p.Val254ProfsTer6 | p.V254Pfs*6 | Q07866 | protein_coding | TCGA-AO-A0J9-01 | Breast | breast invasive carcinoma | Female | <65 | III/IV | Chemotherapy | cyclophosphamide | PD | ||
| KLC1 | SNV | Missense_Mutation | novel | c.967N>A | p.Ala323Thr | p.A323T | Q07866 | protein_coding | deleterious(0) | possibly_damaging(0.635) | TCGA-2W-A8YY-01 | Cervix | cervical & endocervical cancer | Female | <65 | I/II | Chemotherapy | cisplatin | CR |
| KLC1 | SNV | Missense_Mutation | novel | c.114N>T | p.Leu38Phe | p.L38F | Q07866 | protein_coding | deleterious(0) | probably_damaging(0.999) | TCGA-C5-A8YT-01 | Cervix | cervical & endocervical cancer | Female | <65 | I/II | Chemotherapy | cisplatin | PD |
| KLC1 | SNV | Missense_Mutation | c.77N>G | p.Ser26Cys | p.S26C | Q07866 | protein_coding | tolerated(0.13) | benign(0.046) | TCGA-IR-A3LA-01 | Cervix | cervical & endocervical cancer | Female | <65 | I/II | Chemotherapy | cisplatin | CR | |
| KLC1 | SNV | Missense_Mutation | novel | c.377N>G | p.Asn126Ser | p.N126S | Q07866 | protein_coding | tolerated(0.78) | benign(0.142) | TCGA-VS-A9UJ-01 | Cervix | cervical & endocervical cancer | Female | <65 | I/II | Unknown | Unknown | PD |
| KLC1 | SNV | Missense_Mutation | c.380C>T | p.Thr127Met | p.T127M | Q07866 | protein_coding | deleterious(0.01) | probably_damaging(0.999) | TCGA-A6-5661-01 | Colorectum | colon adenocarcinoma | Female | >=65 | I/II | Unknown | Unknown | SD |
| Page: 1 2 3 4 5 |
Top |
Related drugs of malignant transformation related genes |
| Identification of chemicals and drugs interact with genes involved in malignant transfromation |
| (DGIdb 4.0) |
| Entrez ID | Symbol | Category | Interaction Types | Drug Claim Name | Drug Name | PMIDs |
| 3831 | KLC1 | NA | fluorouracil | FLUOROURACIL | 17549067 | |
| 3831 | KLC1 | NA | leucovorin | LEUCOVORIN | 17549067 | |
| 3831 | KLC1 | NA | irinotecan | IRINOTECAN | 17549067 |
| Page: 1 |

Copyright 2023-Present -The University of Texas Health Science Center at Houston |